#sonification
Text

NASA Data Sonification: Black Hole Remix
In this sonification of Perseus. the sound waves astronomers previously identified were extracted and made audible for the first time. The sound waves were extracted outward from the center. (source)
#space#black holes#perseus#nasa#sound waves#solar winds#interesting#perseus galaxy cluster#sonification
111K notes
·
View notes
Photo

Otherworldly Possessed Abandonware
#abandonware#abstract#glitch#glitchcore#glitchart#processing#pixel#dither#hexedit#sonification#webcore#internetcore#dark#dos#zxspecturm#databending#demoncore
777 notes
·
View notes
Text
Tour the Ocean through the Art of Sound
The ocean is one of the largest ecosystems on our planet. From eye-catching waves to the darkness of the twilight zone, it’s a place filled with mystery and rapid change.

For a scientist studying ocean color at NASA’s Goddard Space Flight Center in Greenbelt, Maryland, there was one more question–what does it sound like?
Before long, a “symphonic ocean experience” was born, combining satellite imagery, ocean color data and programming expertise. Learn more about how data gets converted to music and sound here:
youtube
This World Oceans Day, enjoy a tour of the ocean set to sound. Here we go:
Bering Sea
This melody explores the phytoplankton blooms in the western Bering Sea along the coast of the Kamchatka Peninsula collected by Aqua/MODIS on May 15, 2021. The melody created for this image was aimed at capturing the movement of the eddies or the circular movements of water. Data came from the image’s red, green, and blue channels.
youtube
Rio de la Plata
This melody explores a spring bloom in the South Atlantic Ocean off the coast of Argentina, Uruguay, and Brazil, lending the water many different shades of green, blue, and brown. The Rio de la Plata estuary in the northwest corner of the above image gets most of its tan coloration from sediments suspended in the water. The melody paired with the data evokes the sediment plumes and swirls happening off the coast.
youtube
Coral Sea
Data for the sounds of the Coral Sea were collected over the course of one year from the Aqua/Modis satellite. The information was extracted from a series of 32-day rolling averages for the year 2020, displaying the movement of chlorophyll a data.
youtube
Chlorophyll a is a specific form of chlorophyll used in photosynthesis. It absorbs most energy from wavelengths of violet-blue and orange-red light. It is a poor absorber of green and near-green portions of the spectrum, and that’s why it appears green.
Western Australia
Off the coast of western Australia is the appearance of swirls in the ocean. To catch the movement of the Indian Ocean, data was collected from 31 days of imagery examining blue wavelengths of light. The information was gathered from the Suomi-NPP/VIIRS instrument aboard the Joint Polar Satellite System (JPSS) series of spacecraft.
youtube
More moments of zen
Looking for more moments of zen? Explore them with NASA’s Soundcloud page, where many are out of this world. Curious on how we get these breathtaking ocean images? Take time to read about Goddard Oceanographer Norman Kuring and how he helped create them.
#World Oceans Day#oceanography#NASA#sonification#music#soundcloud#earth#planet earth#ocean#sea#ambient#Youtube
2K notes
·
View notes
Text
Greco (after Friedrich), James Usill, 2023
38 notes
·
View notes
Text
#glamglitchpunk#glitch#glitchart#databending#digitalart#lofi#lowfidelity#datamoshing#sonification#surreal#art#noise#loop#gif
17 notes
·
View notes
Text

5 notes
·
View notes
Text
Fuck you, *sonics your geats*

22 notes
·
View notes
Text
Data sonification of the Black Hole at the Center of the Perseus Galaxy Cluster (X-ray)
youtube
3 notes
·
View notes
Text
Listen to the eerie sounds of distant galaxies in breathtaking NASA video
Hear the beauty of deep space thanks to the sonification of telescope data.
Relish in the pleasant thrumming of galaxies and stars in deep space whose data has been "sonified" into orchestral music. Sound cannot travel through space, thanks to the lack of air to act as a medium. Instead, NASA has produced musical tones from the same telescope data that is manifested into pictures such that you can now hear the beauty of space.
"The visualization team started with the scientific observations from the various telescopes, and then applied some of the same software that Hollywood uses in their feature films to the data," Frank Summers, who is a visualization scientist at the Space Telescope Science Institute in Maryland, said in a statement.
A newly released 30-second video glides you through the five galaxies of Stephan's Quintet in the Pegasus constellation, four of which are gravitationally bound to each other at about 290 million light-years away while the fifth one is an innocent bystander roughly 39 million light-years away.
The R Aquarii binary star captured by NASA's flying telescope SOFIA. (Image credit: NASA)
The new video is still except for a white horizontal line that combs through the galaxy group and reveals where the sounds are coming from. Each of the five galaxies lets out a big whoosh while the foreground stars hum in warm and mellowed tones of a xylophone-like instrument called a glass marimba. The musical piece is also sprinkled with higher pitches of a string instrument, which represents spikes around a star in telescope images that are formed when starlight bends around the hexagonal mirrors of NASA's James Webb Space Telescope (JWST).
"Astronomy has always been very visual, but there's no reason why we have to represent the data through that manner alone," Kimberly Arcand, who is a visualization scientist at the Chandra X-ray Center in Massachusetts, said in the same statement. "This type of depiction is taking the scientific story of Stephan's Quintet — the deep, dense, and beautiful dataset — and translating it into an auditory experience."
As part of an ongoing project to convert telescope data into audio experiences, NASA also released sonifications of two other celestial targets by combining data from the agency's Chandra X-ray Observatory, JWST, Hubble Space Telescope, and the now-retired Spitzer Space Telescope.
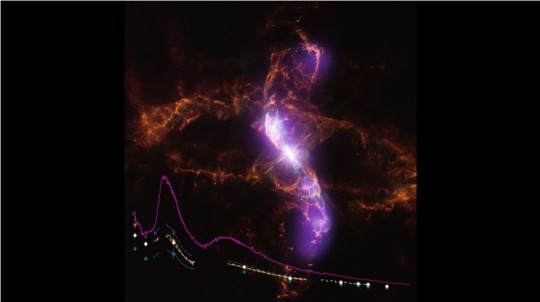
The musical piece on R Aquarii, which is a binary star system of a dim white dwarf and a pulsating red giant about 650 light-years from Earth, increases in volume in proportion to the brightness of sources and their distances from the center.
At two o'clock and eight o'clock positions, you can hear a strong wind, which reflects a jet of ionized matter blasting out of the white dwarf and slamming into surrounding stellar material. Hubble's data, which are visualized as "ribbon-like arcs" in the image, can be heard as soothing sounds like those that resonate from Tibetan singing bowls while Chandra's data are represented as a "windy purr," NASA representatives wrote in an image description published Tuesday (June 20).
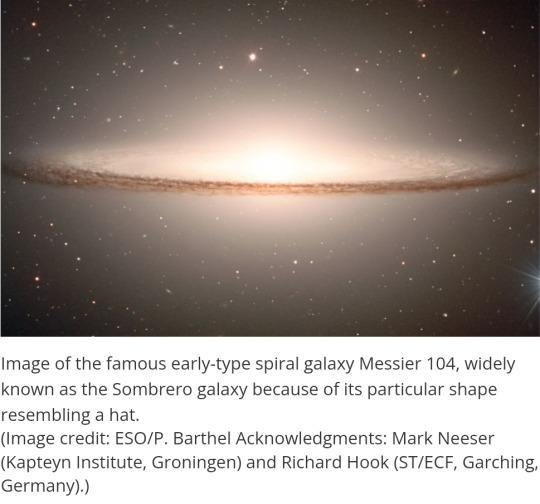
The soundtrack of Messier 104 (or M104) — a giant galaxy in the Virgo cluster about 28 million light-years away, is more like a whistle that shrills and mellows according to the brightness of the sources.
Translating data into sounds can help people process the information in different ways and bring to light certain aspects of data that were not noticed previously, scientists say. Such data sonifications also make the beauty of the universe accessible to visually impaired space enthusiasts. "Sonifications offer a sensory way for me to experience the scale and potency of astronomical phenomena," Christine Malec, who is a member of the blind and partially sighted community supporting NASA's sonification project, said in the same statement. "They are an invitation to blind and partially-sighted people to listen, enjoy, and then go deeper by reading to understand what exactly is being heard."
#2023#your friendly neighborhood space nerd#space#nasa#galaxies#sonification#beautiful#vacuum of space#astronomy
2 notes
·
View notes
Photo


#deltarune#deltarune ch 2#rouxls kaard#deltarune lancer#lancer#susie#noelle holiday#berdly#deltarune queen#sonification#sonicsona
17 notes
·
View notes
Photo
『-』°°°·.°『-』H̴̬̲͠͝A̴̠̬̒R̷̬͔̫̄̕S̶̛͓̱̜̊̄H̴̙̝͚́͝ ̵͈̯̪̈́P̸͍̐̊͆R̷̪͇̍͑̾O̶̞̰͛Ć̴̜̹͔Ë̶͖͔̳́͝S̴̱͎̘̉͝S̴͍̦̠̃̍̽ 『-』°°°·.°『-』
#databending#sonification#glic#processing#glitch#glitch art#cybercore#webcore#internet#postinternet#techcore#y2k#y2kcore#90s#grunge#data#generative#generative art#genart#abstract#abstraction#glitchcore#scifi#industry data#industry#factory#machine#ai#gan#vintage
146 notes
·
View notes
Text
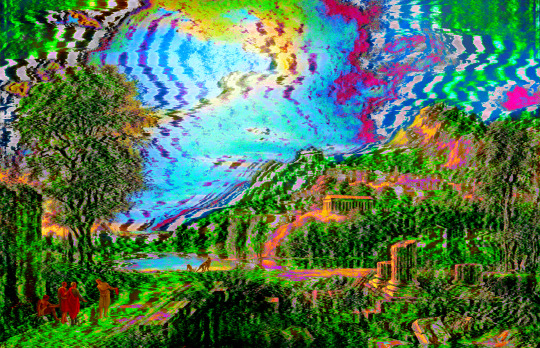
Agrigentum (after de Valenciennes)
44 notes
·
View notes
Photo

#glamglitchpunk#glitch#glitchart#digitalart#databending#sonification#abstraction#abstract#abstractart#processing#datamoshing
142 notes
·
View notes
Text
Sonification of Electricity usage
I have a smart meter with a display in the hall. Trouble is, I hardly ever look at it and the data shows cumulative values rather than the energy being used right now. I had the idea of sonifying the data being recorded by my ESP8826-based electricity monitor. Currently it reports every minute to my sensor dashboard.
I initially thought of running this on an ESP32 or Pi Pico W since both have onboard Wifi which could be used to retrieve the current data from the dashboard. I looked at a few ways to do this, such as using Midi and even ordered a sound module.
However it occured to me that rather than build a device to play the sounds, it could be done as a web page using JavaScript to play the files. At the very least, this would be very useful for testing sonification schemes .
The key HTML feature is the <audio> tag to define the audio resources and the Javascript API to play the audio track. Playing around with this feature, I realised that audio tracks can be looped and can run in parallel and the volume of each track can be changed as the tracks are played.
An update rate of once a minute is too slow to show devices being turned on and off so the ESP8266 monitor was changed to report to another channel every 6 seconds to the dashboard. Only the latest record is recorded on this channel since a full history would be too large. This reading is fetched from the dashboard at the same rate. I'm exploring the idea of multiple sound tracks whose volume is adjusted in response to the level of usage. Currently I'm using six bird songs. Tracks are allocated to bands and as the level of energy usage, measured in watts, increases, tracks are brought into the soundscape with increasing volume.
This approach looks promising because it can be run on a phone and carried around the house, and can be listened to when away from the house. This is the current version. Data fetching and sounds can be turned on and off and the thresholds changed.
The problem now is to design the soundscape and thresholds to best represent the changing energy level.
Other sonification ideas
I'd like to look at getting the national Grid data - obtainable via an API described in https://bscdocs.elexon.co.uk/guidance-notes/bmrs-api-and-data-push-user-guide
This and data from the tree moisture sensor are multi-channel and will need a different approach to generating the soundscape
Extras
Grid in January 2013
Bought this CJMCU-1334 breakout board for playing MP3 files £9
Tutorial
alternatively ESP32 supports BLE which could be used to send MIDI derived sounds to a phone
Free sounds https://freesound.org/
2 notes
·
View notes
Link
NASA has posted an audio clip on YouTube that lets us hear what a black hole sounds like, pitched up so that it would be audible to our ears.
Let’s talk a little bit about what we’re actually hearing here.
Astronomers discovered decades ago that Perseus’ black hole sends out pressure waves, which sort of ripple through the hot gasses in the area, and these ripples produce sound.
Now because space is a vacuum, normally sound waves don’t have a medium to travel through and become audible. But Perseus’ black hole gets past this barrier due to how close it is to the cluster’s gas, the gas acts as a medium for the sound to travel through.
In 2003, a team from NASA’s Chandra X-ray Observatory took data gathered from these ripples and converted them over to audible sound. Unfortunately, there was a problem. When they finished the sonification process (a fancy word for ‘turning data into audible sound’), they discovered that the monster black hole played a note 57 octaves below middle C, or one million, billion times lower than the lowest sound audible to the human ear.
So, in honor of Black Hole Week, NASA cleaned it up (which you can read about how they did it exactly in the video description) and pitched it up 57 and 58 octaves so that we could hear what these tears in the fabric of reality sound like. Or, to put it in NASA’s own words, “Another way to put this is that they are being heard 144 quadrillion and 288 quadrillion times higher than their original frequency.”
And it sounds about how you would expect it to. Terrifying, haunting, but also vastly intriguing to hear the song of the universe with our own ears.
-Astronomer
5 notes
·
View notes
Text
When the moon passes between the sun and Earth on April 8, it’s what Texans and others in the path of the total eclipse will see – the sky going from bright to dark and back again – that makes the moment special. But a group of astronomers at Harvard wants everyone to experience these rare moments, including observers who are blind or have limited vision.
Harvard astronomer Allyson Bieryla directs the LightSound Project, which runs workshops where volunteers help build small boxes that turn the sight of an eclipse into sound, and distributes the devices to those who want them.
“It’s essentially a solar eclipse sonification tool that we designed to aid the blind and low-vision community. Sonification, simply put, is taking data and turning it into sound,” Bieryla said. “So in this case, we’re taking light and converting it into sound during this solar eclipse.
In 2017, the Harvard scientists built three sonification devices for an eclipse event. For the upcoming April eclipse, the group wants to make 750 available.
LightSound’s devices come in a handheld, 3D-printed case. When a user points the device toward a light source, like the sun, the light it sees is converted to sound.
“The sound output gets mapped to instruments based on the brightness of the light. And so the brightest light, bright like sunlight, essentially would be mapped to kind of like a flute sound,” Bieryla said. “The midrange goes to a clarinet kind of sound, and then during totality or the darker times during eclipse, it’s kind of a low clicking sound.”
(more in article)
#LightSound Project#Shelly Brisbin#Texas Standard#Allyson Bieryla#Harvard#sonification#blind#visually impaired
0 notes
Last Seen Blogs


thervdio-blog
THERVDIO

raiza-sergeantasmr
raiza-Sergeant ASMR

woozingie
brrr ratata

smallcures
only the smallest cures