#sql change data capture
Explore tagged Tumblr posts
Visit Tumblr Blog
Explore Tumblr blogs with no restrictions, modern design and the best experience.
Last Seen Tumblr Blogs


Fun Fact
Tumblr was acquired by Yahoo for $1.1B in 2013.
Text
Tracking Changes in SQL Server 2022
In the latest update of SQL Server 2022, keeping an eye on database table alterations has gotten a bit easier for the folks who build and maintain our databases. This piece is all about giving you the lowdown on how to make the most of SQL Server’s built-in goodies for change tracking. We’re zeroing in on Change Data Capture (CDC) and Temporal Tables, which are like superheroes for making sure…
View On WordPress
#CDC SQL Server#Change Data Capture#Data Auditing SQL Server#System-Versioned Temporal Tables#Temporal Tables SQL Server
1 note
·
View note
Text
Unlock Real-Time Insights with SQL Server Change Data Capture
Introduction:
In today's fast-paced digital landscape, businesses need real-time insights to stay competitive. SQL Server Change Data Capture (CDC) is a powerful feature that enables organizations to capture and track changes made to their SQL Server databases. In this article, we will explore the benefits of SQL Server Change Data Capture and how it empowers businesses to make informed decisions based on real-time data.

Efficient Tracking of Data Changes:
SQL Server Change Data Capture provides a reliable and efficient way to track changes made to the database. With CDC, you can capture changes at the row level, including inserts, updates, and deletes. This granular level of tracking allows you to understand the evolution of your data over time and enables you to analyze trends, identify anomalies, and make data-driven decisions. By capturing changes efficiently, CDC reduces the overhead on your SQL Server and ensures minimal impact on the database performance.
Real-Time Data Integration:
One of the significant advantages of SQL Server Change Data Capture is its ability to facilitate real-time data integration. CDC captures and stores changed data in a separate change table, allowing you to easily access and integrate it with other systems or applications. This enables real-time data synchronization between different databases, data warehouses, or analytical platforms. By having access to up-to-date data, you can gain valuable insights, streamline business processes, and improve decision-making efficiency.
Auditing and Compliance:
Maintaining data integrity and meeting regulatory compliance requirements are essential for businesses across various industries. SQL Server Change Data Capture helps organizations fulfill auditing and compliance needs by providing a reliable and transparent trail of all changes made to the database. The captured change data includes the old and new values, timestamps, and user information, allowing you to track and monitor data modifications. This level of auditing capability ensures data accountability and helps organizations comply with industry regulations and internal policies.
Simplified Data Warehousing and Reporting:
SQL Server Change Data Capture simplifies the process of data warehousing and reporting. By capturing changes at the source database, CDC eliminates the need for complex and time-consuming extraction, transformation, and loading (ETL) processes. You can directly access the captured change data and populate your data warehouse in near real-time, enabling faster and more accurate reporting. This streamlined approach to data warehousing enhances the overall efficiency of your analytics and reporting workflows.
Efficient Data Recovery and Rollbacks:
In the event of data corruption or unintended changes, SQL Server Change Data Capture proves invaluable for efficient data recovery and rollbacks. By utilizing the captured change data, you can identify and isolate specific changes made to the database. This allows you to restore the affected data to its previous state, minimizing the impact of errors and reducing downtime. The ability to quickly recover and roll back changes enhances data reliability and safeguards the integrity of your SQL Server databases.
Integration with Third-Party Tools:
SQL Server Change Data Capture seamlessly integrates with various third-party tools and technologies. Whether you need to feed change data into a data integration platform, perform advanced analytics using business intelligence tools, or trigger event-driven workflows, CDC provides the necessary flexibility and compatibility. This integration capability expands the possibilities of utilizing change data across your entire data ecosystem, enabling you to derive maximum value from your SQL Server databases.
Conclusion:
SQL Server Change Data Capture empowers organizations to unlock real-time insights and make informed decisions based on up-to-date data. With efficient tracking of data changes, real-time data integration, auditing and compliance features, simplified data warehousing, efficient data recovery, and seamless integration with third-party tools, CDC offers a comprehensive solution for capturing and utilizing change data. By implementing SQL Server Change Data Capture, businesses can stay ahead of the competition, improve decision-making processes, and drive success in today's data-driven world.
0 notes
Text
BigQuery Data Canvas: Now More Powerful for Faster Insights

Turn data into insights faster with the updated BigQuery data canvas.
Today's data-driven world requires quick insights. Many struggle to transform raw data into meaningful intelligence. Complex SQL queries, tedious investigations, and the split between technical and non-technical users slow progress. BigQuery Data Canvas is a visual workspace that democratises data research and unleashes BigQuery data potential. At Google Cloud Next '25 this month, Google Cloud introduced Data Canvas, powered by Gemini, with AI-assisted conversation. One question covers data exploration, visualisation, and workflow analysis in this chat experience.
Data canvas is a paradigm change for data practitioners, not just a new function. By seamlessly combining visual processes with BigQuery and Gemini, Google Cloud is turning raw data into valuable insights.
Key traits: In-depth
Explore the data canvas assistant's powers.
Gemini fuels AI data agents.
Google has added Gemini, their powerful AI model, to Data Canvas to boost data exploration. It lets you ask data questions, enhance queries using natural language, and obtain informative and useful replies. The Gemini-powered data canvas queries and provides dataset information when you select “Show me the top 10 customers by revenue”. Gemini's data discovery recommendations help you find relevant datasets.
The Gemini-powered AI conversation experience captures workflow analysis from data exploration to visualisation with one prompt. Not sure where to start? Start analysing your data by following the directions. BigQuery Data Canvas uses Gemini to generate natural language enquiries about your data and SQL queries based on your favourite tables. To answer your questions, Gemini might use many data sources.
You may also direct the system to transfer domain knowledge about your data to increase answer accuracy. You may tell Gemini that your company's fiscal year is not January–December using system instructions. Some system directives, such “always present findings with charts, use green colour for positive and red colour for negative,” might influence how your replies are presented and returned.
Complex Python analysis for forecasting and anomaly identification will soon be available in chat. If your inquiry is complex, Gemini chat assistant will use a Python code interpreter to reply. Turn this option on in the settings bar.
Visual query building: Explore several perspectives in one place. Imagine a single hub where you can filter, link, aggregate, or display data from several tables, each in its own container, on the same page for data analysis. Data Canvas uses a DAG (Directed Acyclic Graph) method instead of a linear one, allowing you to explore alternative views, return to prior phases, or compare outcomes.
Data may be added easily by finding and adding tables to the canvas. Starting with natural language queries to your data, Data Canvas will automatically generate the SQL, which you can analyse and edit. Our node-based technique lets SQL professionals and rookie analysts pursue insights without having to cope with complex query syntax.
Interactive visualisations: Instant insights
Data Canvas offers interactive tables, graphs, and charts. Customising visualisations, interactively examining data, and identifying patterns and irregularities are easy. Do you want to see regional sales distribution? Data Canvas automatically creates a chart using the “Region” and “Sales” variables. Just choose the best visualisation or make your own to watch your data come to life. These visualisations may be downloaded as PNGs or imported into Looker Studio for customisation and dissemination.
Implementing data canvas in practice
New AI functionalities on BigQuery data canvas may be used in many ways. Here are some industry-specific ideas to inspire you.
Telecom diagnostics and support: Faster service restoration
Consider a telecom support team helping clients. Using a data canvas, support tickets may be queried for customer phone, postcode, service, timestamp, and nearby mobile tower. BigQuery processes support tickets hourly. Each data item is maintained in a distinct node inside a canvas, so analysts may perform this study without switching query tabs. This visual method helps them find local outages, send personnel to the right towers, and fix service interruptions faster.
E-commerce analytics: Expanding sales and customer engagement
Imagine marketing personnel analysing customer purchasing data to optimise adverts. Data canvas lets them graphically mix customer and product information, filter by prior purchases, and examine demographic sales tendencies. By quickly identifying high-value customer categories, best-selling goods, and marketing success, they can make data-driven judgements.
Supply chain optimisation: logistics simplification
Logistics management may utilise Data Canvas to track inventories, delivery routes, and bottlenecks. Visualising supply chain data may boost efficiency, cut costs, and enhance delivery dates. They may also create interactive dashboards to track performance indicators and make real-time changes.
Visual data exploration is the future, and BigQuery data canvas, powered by AI, makes data useful and accessible to everyone. It combines Gemini's intelligence, BigQuery's power, and visual processes to maximise your data. Start your future data exploration experience now.
#BigQuery#DataCanvas#GoogleCloud#AImodel#Implementingdatacanvas#BigqueryDatacanvas#CanvasData#Datacanvasassistant#News#Technews#Technology#Technologynews#Technologytrends#govindhtech
0 notes
Text
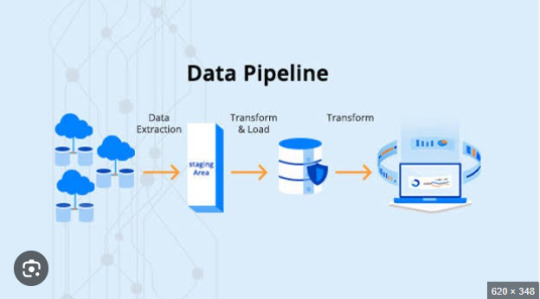
How to Optimize ETL Pipelines for Performance and Scalability

As data continues to grow in volume, velocity, and variety, the importance of optimizing your ETL pipeline for performance and scalability cannot be overstated. An ETL (Extract, Transform, Load) pipeline is the backbone of any modern data architecture, responsible for moving and transforming raw data into valuable insights. However, without proper optimization, even a well-designed ETL pipeline can become a bottleneck, leading to slow processing, increased costs, and data inconsistencies.
Whether you're building your first pipeline or scaling existing workflows, this guide will walk you through the key strategies to improve the performance and scalability of your ETL pipeline.
1. Design with Modularity in Mind
The first step toward a scalable ETL pipeline is designing it with modular components. Break down your pipeline into independent stages — extraction, transformation, and loading — each responsible for a distinct task. Modular architecture allows for easier debugging, scaling individual components, and replacing specific stages without affecting the entire workflow.
For example:
Keep extraction scripts isolated from transformation logic
Use separate environments or containers for each stage
Implement well-defined interfaces for data flow between stages
2. Use Incremental Loads Over Full Loads
One of the biggest performance drains in ETL processes is loading the entire dataset every time. Instead, use incremental loads — only extract and process new or updated records since the last run. This reduces data volume, speeds up processing, and decreases strain on source systems.
Techniques to implement incremental loads include:
Using timestamps or change data capture (CDC)
Maintaining checkpoints or watermark tables
Leveraging database triggers or logs for change tracking
3. Leverage Parallel Processing
Modern data tools and cloud platforms support parallel processing, where multiple operations are executed simultaneously. By breaking large datasets into smaller chunks and processing them in parallel threads or workers, you can significantly reduce ETL run times.
Best practices for parallelism:
Partition data by time, geography, or IDs
Use multiprocessing in Python or distributed systems like Apache Spark
Optimize resource allocation in cloud-based ETL services
4. Push Down Processing to the Source System
Whenever possible, push computation to the database or source system rather than pulling data into your ETL tool for processing. Databases are optimized for query execution and can filter, sort, and aggregate data more efficiently.
Examples include:
Using SQL queries for filtering data before extraction
Aggregating large datasets within the database
Using stored procedures to perform heavy transformations
This minimizes data movement and improves pipeline efficiency.
5. Monitor, Log, and Profile Your ETL Pipeline
Optimization is not a one-time activity — it's an ongoing process. Use monitoring tools to track pipeline performance, identify bottlenecks, and collect error logs.
What to monitor:
Data throughput (rows/records per second)
CPU and memory usage
Job duration and frequency of failures
Time spent at each ETL stage
Popular tools include Apache Airflow for orchestration, Prometheus for metrics, and custom dashboards built on Grafana or Kibana.
6. Use Scalable Storage and Compute Resources
Cloud-native ETL tools like AWS Glue, Google Dataflow, and Azure Data Factory offer auto-scaling capabilities that adjust resources based on workload. Leveraging these platforms ensures you’re only using (and paying for) what you need.
Additionally:
Store intermediate files in cloud storage (e.g., Amazon S3)
Use distributed compute engines like Spark or Dask
Separate compute and storage to scale each independently
Conclusion
A fast, reliable, and scalable ETL pipeline is crucial to building robust data infrastructure in 2025 and beyond. By designing modular systems, embracing incremental and parallel processing, offloading tasks to the database, and continuously monitoring performance, data teams can optimize their pipelines for both current and future needs.
In the era of big data and real-time analytics, even small performance improvements in your ETL workflow can lead to major gains in efficiency and insight delivery. Start optimizing today to unlock the full potential of your data pipeline.
0 notes
Text
Unlocking Success: Strategies for Generating Highly Qualified B2B Leads
Quality Over Quantity: The New Age of Lead Generation
In today’s B2B landscape, the real challenge isn’t generating leads—it’s generating qualified ones. With decision-makers more informed and buyer journeys more complex than ever, the shotgun approach to lead generation simply doesn’t deliver ROI anymore. What businesses need now is precision, relevance, and timing.

At Acceligize, we specialize in helping companies move from high-volume lead lists to high-value conversations. Our success-driven strategies are designed to identify real buying intent, capture interest at the right stage, and drive engagement with decision-makers who are actively seeking solutions. This is how qualified leads are born—and how businesses grow smarter, not just faster.
Intent Data: The Catalyst for Smarter Targeting
Every successful lead generation strategy starts with knowing who is ready to buy. That’s where intent data becomes game-changing. By analyzing digital footprints—search behaviors, content engagement, competitor interactions—Acceligize pinpoints businesses that are actively researching solutions in your category.
This allows your team to engage prospects early, long before they reach out. It’s not just cold outreach—it’s timely outreach, backed by data that reveals interest, urgency, and relevance. It’s how we connect your solutions with prospects when they need it most.
Precision Targeting Through Ideal Customer Profiling
Understanding your Ideal Customer Profile (ICP) is essential to narrowing the field. At Acceligize, we refine your ICP with firmographic and technographic filters, layering in job titles, industry verticals, company size, tech stacks, and even buying cycles.
This means your campaigns don’t just reach “leads”—they reach decision-makers at organizations with real buying potential. It’s not about filling your pipeline with names—it’s about filling it with opportunities that align with your product, value proposition, and sales goals.
Content That Converts: Fuel for Qualified Engagement
High-quality leads demand high-quality content. Whether it’s an executive whitepaper, a product comparison guide, or a personalized case study, content is the bridge between your brand and your buyer’s pain points.
Acceligize empowers brands to deploy stage-specific content across channels. From awareness-driving assets to conversion-focused materials, we ensure your content not only attracts attention but also builds trust and drives action.
Our global content syndication model ensures this content reaches key personas across industries, markets, and time zones—exactly when they’re ready to engage.
To know more about our solutions, visit@ http://acceligize.com/our-solutions/
Multi-Channel Engagement: Meeting Buyers Where They Are
No two buyers are the same, and neither are their engagement preferences. That’s why our lead generation strategies at Acceligize are built on a multi-channel foundation. We deploy targeted campaigns across email, display ads, social media, content syndication, webinars, and account-based marketing.
This omnichannel approach ensures that your brand stays top-of-mind and accessible at every touchpoint, increasing the chances of conversion and deepening lead quality through continuous, value-driven engagement.
Qualification Frameworks that Drive Sales-Ready Leads
Generating a lead is one thing—qualifying it is another. Acceligize applies custom BANT and CHAMP frameworks to validate interest, authority, need, and budget before a lead is passed to your sales team.
We filter leads not just by data, but by intent signals and behavioral insights, delivering MQLs and SQLs that are genuinely ready for the next step. This minimizes sales cycle delays, improves conversion rates, and boosts your revenue per lead.
Real-Time Reporting and Optimization
To truly unlock success, you need visibility. Acceligize provides real-time reporting dashboards and campaign analytics that offer deep insight into lead sources, engagement metrics, and qualification status.
This transparency allows for ongoing optimization, letting you double down on what works, fine-tune targeting, and refine messaging—all in sync with your sales pipeline priorities.
Why Acceligize? Your Growth, Our Mission
We don’t just generate leads—we create momentum. Acceligize combines cutting-edge data, strategic content, and global channel expertise to deliver highly qualified B2B leads that convert. Our focus is on outcomes, not output—so your marketing investment drives measurable business value.Read More@ https://acceligize.com/featured-blogs/unlocking-success-strategies-for-generating-highly-qualified-b2b-leads/
#b2b#b2b lead generation#b2b saas#b2b services#b2bbusiness#b2bmarketing#b2bdatabase#b2bsales#Highly Qualified Leads#b2b acceligize
0 notes
Text
Implementing Data Lineage Tracking in Azure Data Factory

1. Introduction
In modern data pipelines, data lineage tracking is crucial for understanding where data originates, how it transforms, and where it flows. Azure Data Factory (ADF) provides multiple ways to track data lineage, ensuring data governance, compliance, and troubleshooting.
Why is Data Lineage Important?
✅ Regulatory Compliance — Ensure compliance with GDPR, HIPAA, and other regulations. ✅ Data Quality & Governance — Track errors, transformations, and data movement. ✅ Impact Analysis — Understand dependencies and assess changes before implementation. ✅ Operational Debugging — Identify issues in the data pipeline efficiently.
2. Understanding Data Lineage in Azure Data Factory
Data lineage refers to the tracking of data movement from source to destination. In ADF, data lineage can be categorized into:
Column-level lineage — Tracks how individual columns are transformed.
Table-level lineage — Monitors entire datasets or tables.
Pipeline-level lineage — Shows data movement across pipelines.
3. Methods to Implement Data Lineage Tracking in ADF
3.1 Using Azure Purview for Automated Lineage Tracking
Azure Purview is a data governance tool that can track end-to-end lineage in ADF.
Connect Azure Purview to Azure Data Factory.
Enable data scanning for ADF pipelines.
View the lineage graph in the Purview interface.
💡 Best For: Enterprise-grade governance and automated lineage tracking.
3.2 Logging Pipeline Metadata for Custom Lineage Tracking
You can create a custom lineage tracking system by storing pipeline metadata in Azure SQL Database or Azure Data Lake.
Enable pipeline logging using Azure Monitor or Log Analytics.
Capture metadata such as:
Source and destination datasets
Transformation activities
Execution timestamps
Store the logs in a central repository for visualization.
💡 Best For: Organizations needing custom, flexible lineage tracking.
3.3 Using Power BI for Visual Lineage Representation
Power BI can be used to visualize lineage by querying metadata stored in Azure SQL or Data Lake.
Extract ADF pipeline metadata.
Build a data flow diagram in Power BI.
Enable scheduled refresh to keep lineage data up to date.
💡 Best For: Organizations that want self-service lineage tracking without additional tools.
3.4 Using ADF REST API for Lineage Data Extraction
ADF’s REST API allows you to extract pipeline execution details programmatically.
Use Web Activity in ADF to call the Pipeline Runs API.
Capture pipeline metadata:
pipelineName
activityName
executionStartTime
sourceDataset & destinationDataset
Store this data in Azure Log Analytics or a custom dashboard.
💡 Best For: Developers needing API-based automation for lineage tracking.
4. Best Practices for Data Lineage in ADF
✅ Automate Data Lineage Tracking — Use Azure Purview for seamless monitoring. ✅ Store Lineage Data Efficiently — Use Azure SQL, ADLS, or Power BI for visualization. ✅ Monitor Pipeline Execution — Leverage ADF logs and monitoring dashboards. ✅ Ensure Data Security — Use RBAC (Role-Based Access Control) to restrict lineage data access.
5. Conclusion
Implementing data lineage tracking in Azure Data Factory is essential for data governance, compliance, and troubleshooting. Whether you use Azure Purview, custom logs, Power BI, or REST APIs, tracking lineage ensures data integrity and transparency across the organization.
WEBSITE: https://www.ficusoft.in/azure-data-factory-training-in-chennai/
0 notes
Text
AI-Powered Market Research: Transforming Data into Actionable Insights with ConvertML

In today’s fast-paced digital landscape, businesses must stay ahead by making data-driven decisions. Traditional market research analytics often involves long cycles of data collection, segmentation, and analysis, delaying crucial marketing and sales initiatives. ConvertML is here to change that. With its AI-powered market research, businesses can instantly generate market research insights, uncover hidden patterns, and launch high-performing campaigns effortlessly.
The Power of AI-Powered Market Research
ConvertML turns customer signals into intelligent segments, helping businesses launch winning campaigns in just four steps:
Bring Data
Run AI-powered market research models
Generate intuitive visuals
Implement actionable insights
With all your data sources available in a single dashboard, ConvertML ensures you never miss key insights.
Make a Move Before Your Customers Move On
With ConvertML, you can analyze customer data across multiple platforms to identify valuable customer segments before your competitors do. The platform simplifies data processing, turning survey responses, CRM data, and customer interactions into precise audience segments that sync directly to your marketing platforms.
Turn Data into Winning Segments
Instead of waiting weeks for analysis, ConvertML instantly processes thousands of behavioral signals into revenue opportunities. Businesses can:
Identify high-value customer segments and launch targeted campaigns.
Capture hidden revenue by understanding what drives customer decisions.
Engage customers at the right time to maximize conversions.
Skip the Analytics Queue – Get Insights Instantly
Forget waiting for analysts or running SQL queries. ConvertML’s GenAI Copilot processes customer data instantly, creating ready-to-use segments and generating strategic recommendations backed by advanced analytics.
Market Research Analytics That Goes Beyond Averages
Many businesses lose valuable customers because their surface-level analysis fails to reveal critical insights. ConvertML’s advanced analytics tools uncover hidden patterns in customer responses:
Cross-tab survey questions to see how different demographics respond instead of relying on misleading averages.
Compare response patterns to identify key likes and dislikes about new features.
Highlight significant differences in customer sentiment to address churn risks before they escalate.
Create Granular Segments Instead of Surface-Level Ones
Demographic-based segmentation isn’t enough in today’s competitive market. ConvertML uses factor analysis and advanced clustering to:
Discover natural customer groups based on behavior, preferences, transactions, and engagement patterns.
Track how customer segments shift over time, adapting marketing strategies accordingly.
Move beyond broad personalization to execute targeted, behavior-based campaigns.
Extract Deeper Insights from Your Surveys
Businesses often struggle to analyze survey responses effectively. ConvertML’s AI-powered market research provides advanced sentiment analytics to:
Process thousands of responses instantly and detect urgent feedback.
Automatically group feedback by themes such as product issues or feature requests.
Track real-time sentiment changes to prevent customer dissatisfaction from escalating.
Don’t Wait for Analysts – Get AI-Powered Insights in Minutes
Businesses stuck in cycles of reactive analysis lose valuable opportunities. ConvertML’s GenAI-powered insights provide:
Immediate summaries of customer behavior through AI-driven analysis.
Segment-specific insights showing how different groups react to business changes.
Actionable recommendations tailored to each segment for optimized strategy execution.
Conversational AI: No More SQL or Complex Queries
Extracting meaningful insights shouldn’t require technical expertise. ConvertML’s Copilot, a multi-agent chatbot, makes analytics accessible to everyone:
Ask questions naturally, such as “Why did enterprise satisfaction drop in the Northeast region?” and receive actionable insights instantly.
Dive deeper into data with follow-up questions for a comprehensive understanding.
Create on-demand visualizations like plots and charts with simple queries.
Revolutionize Your Market Research with ConvertML
ConvertML empowers businesses to move faster, predict trends, and optimize customer engagement with its AI-powered analytics. By leveraging market research insights and market research analytics, you can:
Segment your audience with precision.
Capture hidden revenue opportunities.
Reduce customer churn with predictive analytics.
Get real-time insights for proactive decision-making.
In a world where customer preferences shift rapidly, AI-powered market research is the key to staying ahead. ConvertML’s intuitive platform ensures that businesses never miss an opportunity to optimize their marketing efforts and drive growth.
Ready to unlock the full potential of your data? Book a demo with ConvertML today!
0 notes
Text
AWS Data Analytics Training | AWS Data Engineering Training in Bangalore
What’s the Most Efficient Way to Ingest Real-Time Data Using AWS?
AWS provides a suite of services designed to handle high-velocity, real-time data ingestion efficiently. In this article, we explore the best approaches and services AWS offers to build a scalable, real-time data ingestion pipeline.
Understanding Real-Time Data Ingestion
Real-time data ingestion involves capturing, processing, and storing data as it is generated, with minimal latency. This is essential for applications like fraud detection, IoT monitoring, live analytics, and real-time dashboards. AWS Data Engineering Course
Key Challenges in Real-Time Data Ingestion
Scalability – Handling large volumes of streaming data without performance degradation.
Latency – Ensuring minimal delay in data processing and ingestion.
Data Durability – Preventing data loss and ensuring reliability.
Cost Optimization – Managing costs while maintaining high throughput.
Security – Protecting data in transit and at rest.
AWS Services for Real-Time Data Ingestion
1. Amazon Kinesis
Kinesis Data Streams (KDS): A highly scalable service for ingesting real-time streaming data from various sources.
Kinesis Data Firehose: A fully managed service that delivers streaming data to destinations like S3, Redshift, or OpenSearch Service.
Kinesis Data Analytics: A service for processing and analyzing streaming data using SQL.
Use Case: Ideal for processing logs, telemetry data, clickstreams, and IoT data.
2. AWS Managed Kafka (Amazon MSK)
Amazon MSK provides a fully managed Apache Kafka service, allowing seamless data streaming and ingestion at scale.
Use Case: Suitable for applications requiring low-latency event streaming, message brokering, and high availability.
3. AWS IoT Core
For IoT applications, AWS IoT Core enables secure and scalable real-time ingestion of data from connected devices.
Use Case: Best for real-time telemetry, device status monitoring, and sensor data streaming.
4. Amazon S3 with Event Notifications
Amazon S3 can be used as a real-time ingestion target when paired with event notifications, triggering AWS Lambda, SNS, or SQS to process newly added data.
Use Case: Ideal for ingesting and processing batch data with near real-time updates.
5. AWS Lambda for Event-Driven Processing
AWS Lambda can process incoming data in real-time by responding to events from Kinesis, S3, DynamoDB Streams, and more. AWS Data Engineer certification
Use Case: Best for serverless event processing without managing infrastructure.
6. Amazon DynamoDB Streams
DynamoDB Streams captures real-time changes to a DynamoDB table and can integrate with AWS Lambda for further processing.
Use Case: Effective for real-time notifications, analytics, and microservices.
Building an Efficient AWS Real-Time Data Ingestion Pipeline
Step 1: Identify Data Sources and Requirements
Determine the data sources (IoT devices, logs, web applications, etc.).
Define latency requirements (milliseconds, seconds, or near real-time?).
Understand data volume and processing needs.
Step 2: Choose the Right AWS Service
For high-throughput, scalable ingestion → Amazon Kinesis or MSK.
For IoT data ingestion → AWS IoT Core.
For event-driven processing → Lambda with DynamoDB Streams or S3 Events.
Step 3: Implement Real-Time Processing and Transformation
Use Kinesis Data Analytics or AWS Lambda to filter, transform, and analyze data.
Store processed data in Amazon S3, Redshift, or OpenSearch Service for further analysis.
Step 4: Optimize for Performance and Cost
Enable auto-scaling in Kinesis or MSK to handle traffic spikes.
Use Kinesis Firehose to buffer and batch data before storing it in S3, reducing costs.
Implement data compression and partitioning strategies in storage. AWS Data Engineering online training
Step 5: Secure and Monitor the Pipeline
Use AWS Identity and Access Management (IAM) for fine-grained access control.
Monitor ingestion performance with Amazon CloudWatch and AWS X-Ray.
Best Practices for AWS Real-Time Data Ingestion
Choose the Right Service: Select an AWS service that aligns with your data velocity and business needs.
Use Serverless Architectures: Reduce operational overhead with Lambda and managed services like Kinesis Firehose.
Enable Auto-Scaling: Ensure scalability by using Kinesis auto-scaling and Kafka partitioning.
Minimize Costs: Optimize data batching, compression, and retention policies.
Ensure Security and Compliance: Implement encryption, access controls, and AWS security best practices. AWS Data Engineer online course
Conclusion
AWS provides a comprehensive set of services to efficiently ingest real-time data for various use cases, from IoT applications to big data analytics. By leveraging Amazon Kinesis, AWS IoT Core, MSK, Lambda, and DynamoDB Streams, businesses can build scalable, low-latency, and cost-effective data pipelines. The key to success is choosing the right services, optimizing performance, and ensuring security to handle real-time data ingestion effectively.
Would you like more details on a specific AWS service or implementation example? Let me know!
Visualpath is Leading Best AWS Data Engineering training.Get an offering Data Engineering course in Hyderabad.With experienced,real-time trainers.And real-time projects to help students gain practical skills and interview skills.We are providing 24/7 Access to Recorded Sessions ,For more information,call on +91-7032290546
For more information About AWS Data Engineering training
Call/WhatsApp: +91-7032290546
Visit: https://www.visualpath.in/online-aws-data-engineering-course.html
#AWS Data Engineering Course#AWS Data Engineering training#AWS Data Engineer certification#Data Engineering course in Hyderabad#AWS Data Engineering online training#AWS Data Engineering Training Institute#AWS Data Engineering training in Hyderabad#AWS Data Engineer online course#AWS Data Engineering Training in Bangalore#AWS Data Engineering Online Course in Ameerpet#AWS Data Engineering Online Course in India#AWS Data Engineering Training in Chennai#AWS Data Analytics Training
0 notes
Text

With all the hassles present on the internet, brings forth the importance of cyber security, be it an average citizen an aspiring IT specialist or a student. Every individual can learn the cyber environment and enhance their skills with the right set of tools. Following is a list of free tools for cybersecurity tools every beginner should explore.
1. Wireshark
A hugely potent organized protocol analyzer wireshark enables you to analyze data packets in real times by capturing them. It is an excellent tool for analyzing organized network issues, learning about the functions of networks, and investigating basic-level functions. It can be used by beginners to gain insights on the movement of information across a network and also pinpoint existing potential security issues.
Features:
Pckect analyzing in real-time.
Supports a wide array of protocols.
Easy to use with many visual representations.
2. Nmap (Network Mapper)
A tightly held toolkit for those practicing ethical hacking and penetration testing is a fantastic tool for planning and discovering systems and security audits Nmap. It allows novices to scan systems and enumerate hosts services and ports that are active. Its primary purpose is to scan networks and host services.
Features:
Scan at a super fast speed.
Maps advanced network attractions.
Compatible with multiple operating systems.
3. Metasploit Community Edition
Metasploit could be a broadly utilized entrance testing system. The community edition is free and culminates for tenderfoots to memorize vulnerabilities, misuses, and payloads. It's an intelligent way to see how aggressors can compromise frameworks and how to secure them.
Features:
Extensive library of exploits and payloads.
Easy-to-use graphical interface.
Ideal for practicing ethical hacking techniques.
4. Kali Linux
Kali Linux could be a Debian-based Linux dispersion particularly planned for entrance testing and security examination. Stuffed with a wide cluster of tools, it's a one-stop shop for anybody inquisitive about cybersecurity.
Features:
Pre-installed cybersecurity tools.
Lightweight and customizable.
5. Burp Suite Community Edition
Burp Suite may be a favorite among web application security analyzers. The community version is free and incorporates apparatuses for reviewing HTTP demands, analyzing web vulnerabilities, and understanding how web apps work.
Features:
Comprehensive suite for web vulnerability scanning.
User-friendly interface.
Supports learning about web security.
6. CyberChef
Known as "The Cyber Swiss Armed Force Cut," CyberChef may be a web-based tool for encryption, encoding, and information examination. Its instinctive drag-and-drop interface makes it perfect for apprentices investigating the essentials of cryptography and information change.
Features:
Simplifies data processing tasks.
Hundreds of available operations.
Accessible via a web browser
7. OWASP ZAP (Zed Attack Proxy)
OWASP Destroy is an open-source web application security scanner. It is a beginner-friendly apparatus to memorize approximately web vulnerabilities like SQL infusion, cross-site scripting (XSS), and more.
Features:
Automated vulnerability detection.
Supports manual testing.
Detailed reports and logs.
8. Hashcat
Hashcat may be a free watchword recuperation device that makes a difference to clients getting the significance of secret word security. It bolsters a wide assortment of hashing calculations and illustrates how powerless passwords can be split.
Features:
High-performance password cracking.
Supports GPU acceleration.
Multi-platform support.
9. Vega
Vega is another web security scanner that is well-suited for beginners. It's open source, free, and helps to identify vulnerabilities in web applications. Not very hard to figure out, but very helpful.
Such simple tools are most likely never going to help in things such as penetration testing.
XSS and SQL injection are some of the most common they get through to use the graphical interface they have.
10. ClamAV
ClamAV is another tool that most probably every cybersecurity deploys. Cross-platform functionality always plays a critical role for users as not only are they bound to a particular OS. In terms of the tools available, there is a command line option and also a Graphical User Interface.
Conclusion
Investing in these tools will give you a practical ability on how things work, from advanced systems analysis to web application security. Also, users must remember that these are ethical dilemmas and that all users need to comply with the laws of the land. It should make you better equipped to face the advancing technical era out there. So what are you waiting for, grab this opportunity. visit us Enbridg
0 notes
Text
Ms Office
Microsoft Office: A Comprehensive Overview
Introduction
Microsoft Office, often referred to as MS Office, is a suite of productivity tools developed by Microsoft Corporation. First released in 1990, it has become an industry standard for office applications, with tools widely used in businesses, education, and homes worldwide. It includes various software designed to facilitate document creation, data analysis, presentations, communication, and other professional tasks. Over the years, Microsoft has continuously upgraded Office to meet modern requirements by adding cloud capabilities, collaborative tools, and enhanced security.
Core Components of MS Office
The suite offers a collection of applications, each serving a specific function:
Microsoft Word MS Word is a word processor used to create, edit, and format text documents. It supports advanced features such as tables, templates, mail merge, and collaborative editing, making it suitable for both personal and professional writing, from letters to research papers.
Microsoft Excel Excel is a powerful spreadsheet program primarily used for data analysis and financial modeling. It provides tools for calculations, graph creation, pivot tables, and conditional formatting. Excel also supports Visual Basic for Applications (VBA), a programming language that automates complex tasks.
Microsoft PowerPoint PowerPoint is a presentation software used to create slideshows with text, images, animations, and multimedia. It's a popular tool for business meetings, lectures, and marketing presentations, offering templates and design suggestions to enhance visuals.
Microsoft Outlook Outlook is an email client and personal information manager that combines email, calendar, task management, and contact management features. It is a critical tool for professional communication, especially in corporate environments.
Microsoft Access Access is a database management system used to store, organize, and retrieve data. It is often used for creating small to medium-sized databases and supports SQL queries, forms, and reports.
Microsoft OneNote OneNote is a digital note-taking application that allows users to capture and organize notes, drawings, web clippings, and more. It supports cloud synchronization, enabling users to access notes across devices.
Microsoft Teams Teams is a collaboration platform integrated with Office 365, offering chat, video conferencing, and file sharing. It has become essential in remote work environments, providing seamless integration with other MS Office apps.
Evolution to Microsoft 365
In recent years, Microsoft rebranded its subscription service from “Office 365” to Microsoft 365. This change reflects the broader scope of services beyond traditional office software. Microsoft 365 offers cloud-based versions of all core Office apps, along with additional tools like OneDrive (for cloud storage), SharePoint (for collaboration), and enterprise-level security features.
The cloud-based model allows for continuous updates, enabling users to access the latest features without reinstalling or manually updating software. It also facilitates real-time collaboration, allowing multiple users to edit documents simultaneously, regardless of location.
Editions and Availability
Microsoft Office is available in various editions tailored to specific audiences:
Home & Student: Basic apps like Word, Excel, and PowerPoint.
Business & Enterprise: Includes advanced tools like Outlook, Access, and Teams, along with cloud storage and collaboration services.
Education: Offers discounts or free access to students and educators through institutional partnerships.
The software can be installed on Windows, macOS, and mobile platforms like Android and iOS, ensuring cross-platform compatibility.
Key Features and Benefits
Productivity: MS Office helps users efficiently manage tasks, whether it’s creating reports in Word, analyzing data in Excel, or designing presentations in PowerPoint.
Collaboration: With Microsoft 365, multiple users can work on the same document in real time, promoting teamwork.
Integration: Office apps integrate seamlessly, e.g., embedding Excel charts into Word or scheduling meetings through Outlook and Teams.
Cloud Sync: Microsoft 365’s cloud capabilities ensure that files are accessible from any device with an internet connection.
Security: Microsoft prioritizes data security with advanced encryption and multi-factor authentication to protect user information.
Competitors
While MS Office is dominant, it faces competition from alternatives like Google Workspace (Docs, Sheets, Slides), Apple’s iWork suite, and open-source options such as LibreOffice. However, Microsoft’s strong legacy and feature-rich tools give it a competitive edge, particularly in business environments.
Conclusion
Microsoft Office remains a cornerstone of productivity software, evolving over the decades to meet changing demands in both personal and professional contexts. Its applications are renowned for their usability, versatility, and integration. As businesses and individuals increasingly move towards cloud-based solutions, Microsoft’s pivot to Microsoft 365 ensures that Office will continue to be relevant and indispensable in the future. Whether for students, professionals, or enterprises, MS Office offers tools that empower users to communicate, collaborate, and create with ease.
4o
You said:
what is ms excel in 700 words
ChatGPT said:
ChatGPT
Microsoft Excel: A Powerful Tool for Data Management
Introduction
Microsoft Excel is a spreadsheet software developed by Microsoft and included in the Microsoft Office suite. Since its release in 1985, Excel has become an essential tool for businesses, academia, and individuals worldwide for managing, analyzing, and visualizing data. Excel is renowned for its flexibility, allowing users to perform everything from simple calculations to complex data modeling. Its intuitive interface, combined with advanced features like formulas, pivot tables, and automation, makes it suitable for various tasks, from budgeting to statistical analysis.
Key Features of Excel
Spreadsheets and Worksheets Excel files are called workbooks, and each workbook contains multiple worksheets (or tabs). Worksheets consist of a grid of cells arranged in rows and columns, where users input and manipulate data. Cells are identified by a combination of column letters (e.g., A, B) and row numbers (e.g., 1, 2), making it easy to reference data.
Formulas and Functions One of Excel’s most powerful features is its formula engine, which allows users to perform arithmetic operations and apply functions. Excel offers built-in functions to handle tasks ranging from basic calculations (e.g., SUM, AVERAGE) to more advanced operations (e.g., VLOOKUP, IF statements, and INDEX/MATCH). Functions allow users to automate calculations, saving time and reducing the chance of human error.
Charts and Data Visualization Excel supports a variety of chart types, including bar graphs, line charts, pie charts, and scatter plots. These visual elements help users quickly interpret data and communicate insights effectively. With tools such as conditional formatting, users can also highlight specific data points based on conditions, making patterns and trends easier to spot.
Pivot Tables and Data Summarization Pivot tables allow users to organize, summarize, and analyze large datasets efficiently. They enable the dynamic grouping and filtering of data without altering the original dataset, making them ideal for business reporting and data analysis. Pivot tables are often paired with pivot charts for better visualization of summarized data.
Data Import and Integration Excel can import data from various sources, including databases, CSV files, web pages, and APIs. It also integrates with other Microsoft Office applications (such as Word and PowerPoint) and external services like Microsoft Power BI. This flexibility makes it easy to aggregate and analyze data from multiple sources.
Macros and VBA (Visual Basic for Applications) Excel supports automation through macros, recorded sequences of steps that users can replay to perform repetitive tasks. For more advanced automation, Excel uses VBA, a programming language that allows users to create custom functions, automate workflows, and build complex data manipulation routines.
Collaboration and Cloud Features With Microsoft 365, Excel offers cloud-based features, enabling real-time collaboration. Multiple users can edit a workbook simultaneously, with changes automatically saved and synced. Excel files stored in OneDrive or SharePoint are accessible from any device with internet access.
Applications of Microsoft Excel
Business and Finance Excel is widely used in financial planning and analysis. Businesses rely on it for budgeting, forecasting, cash flow management, and financial reporting. Functions like NPV (Net Present Value) and IRR (Internal Rate of Return) help in investment analysis and decision-making.
Data Analysis and Statistics Excel is a popular tool for data analysis, providing features like data sorting, filtering, and descriptive statistics. Analysts use Excel to clean data, analyze trends, and visualize insights. While it is not as specialized as software like Python or R, Excel’s simplicity makes it accessible to non-programmers.
Project Management Project managers use Excel to create schedules, timelines, and Gantt charts. The ability to link tasks and track progress makes Excel a lightweight alternative to dedicated project management tools. Excel’s conditional formatting can highlight critical paths or upcoming deadlines.
Education and Personal Use Educators use Excel to track student performance, attendance, and grades. Students, in turn, use it for assignments and data projects. At a personal level, individuals use Excel for household budgeting, expense tracking, and planning.
Advantages of Excel
User-Friendly Interface: Excel’s intuitive design makes it accessible to users with varying levels of expertise.
Flexibility: It can handle both small tasks (e.g., grocery lists) and large datasets (e.g., financial reports).
Customization: Users can create customized templates, automate processes with macros, and personalize workflows.
Integration: Excel works seamlessly with other Microsoft tools and third-party applications.
Cross-Platform Availability: Excel is available on Windows, macOS, and mobile platforms, allowing access on the go.
Limitations of Excel
Limited Data Capacity: Excel can handle large datasets, but it may struggle with extremely large files or complex computations, which require specialized software.
Errors and Data Integrity: Incorrect formulas or manual input errors can lead to inaccurate results.
Limited Collaboration: While Excel offers collaboration features, it can’t match the collaborative capabilities of cloud-native tools like Google Sheets.
Learning Curve: Advanced features like pivot tables, VBA, and complex formulas require practice to master.
Conclusion
Microsoft Excel is a versatile and powerful tool that has earned its place as a cornerstone of modern productivity. Its ability to manage, analyze, and visualize data makes it indispensable across industries, from finance and business to education and personal planning. While it has limitations in handling very large datasets or specialized tasks, Excel’s continuous evolution ensures it remains relevant. Whether for simple calculations or complex financial modeling, Excel empowers users to work smarter, offering endless possibilities for data management and decision-making.
0 notes
Text
Firebird to Snowflake Migration A comprehensive Guide
Ask On Data is world’s first chat based AI powered data engineering tool. It is present as a free open source version as well as paid version. In free open source version, you can download from Github and deploy on your own servers, whereas with enterprise version, you can use AskOnData as a managed service.
Advantages of using Ask On Data
Built using advanced AI and LLM, hence there is no learning curve.
Simply type and you can do the required transformations like cleaning, wrangling, transformations and loading
No dependence on technical resources
Super fast to implement (at the speed of typing)
No technical knowledge required to use
Below are the steps to do the data migration activity
Step 1: Connect to Firebird (which acts as source)
Step 2 : Connect to Snowflake (which acts as target)
Step 3: Create a new job. Select your source (Firebird) and select which all tables you would like to migrate.
Step 4 (OPTIONAL): If you would like to do any other tasks like data type conversion, data cleaning, transformations, calculations those also you can instruct to do in natural English. NO knowledge of SQL or python or spark etc required.
Step 5: Orchenstrate/schedule this. While scheduling you can run it as one time load, or change data capture or truncate and load etc.
For more advanced users, Ask On Data is also providing options to write SQL, edit YAML, write PySpark code etc.
There are other functionalities like error logging, notifications, monitoring, logs etc which can provide more information like the amount of data transferred, logs, any error information if the job did not run and other kind of monitoring information etc.
Trying Ask On Data
You can reach out to us on [email protected] for a demo, POC, discussion and further pricing information. You can make use of our managed services or you can also download and install on your own servers our community edition from Github.
0 notes
Text
What Is AWS CloudTrail? And To Explain Features, Benefits

AWS CloudTrail
Monitor user behavior and API utilization on AWS, as well as in hybrid and multicloud settings.
What is AWS CloudTrail?
AWS CloudTrail logs every AWS account activity, including resource access, changes, and timing. It monitors activity from the CLI, SDKs, APIs, and AWS Management Console.
CloudTrail can be used to:
Track Activity: Find out who was responsible for what in your AWS environment.
Boost security by identifying odd or unwanted activity.
Audit and Compliance: Maintain a record for regulatory requirements and audits.
Troubleshoot Issues: Examine logs to look into issues.
The logs are easily reviewed or analyzed later because CloudTrail saves them to an Amazon S3 bucket.
Why AWS CloudTrail?
Governance, compliance, operational audits, and auditing of your AWS account are all made possible by the service AWS CloudTrail.
Benefits
Aggregate and consolidate multisource events
You may use CloudTrail Lake to ingest activity events from AWS as well as sources outside of AWS, such as other cloud providers, in-house apps, and SaaS apps that are either on-premises or in the cloud.
Immutably store audit-worthy events
Audit-worthy events can be permanently stored in AWS CloudTrail Lake. Produce audit reports that are needed by external regulations and internal policies with ease.
Derive insights and analyze unusual activity
Use Amazon Athena or SQL-based searches to identify unwanted access and examine activity logs. For individuals who are not as skilled in creating SQL queries, natural language query generation enabled by generative AI makes this process much simpler. React with automated workflows and rules-based Event Bridge alerts.
Use cases
Compliance & auditing
Use CloudTrail logs to demonstrate compliance with SOC, PCI, and HIPAA rules and shield your company from fines.
Security
By logging user and API activity in your AWS accounts, you can strengthen your security posture. Network activity events for VPC endpoints are another way to improve your data perimeter.
Operations
Use Amazon Athena, natural language query generation, or SQL-based queries to address operational questions, aid with debugging, and look into problems. To further streamline your studies, use the AI-powered query result summarizing tool (in preview) to summarize query results. Use CloudTrail Lake dashboards to see trends.
Features of AWS CloudTrail
Auditing, security monitoring, and operational troubleshooting are made possible via AWS CloudTrail. CloudTrail logs API calls and user activity across AWS services as events. “Who did what, where, and when?” can be answered with the aid of CloudTrail events.
Four types of events are recorded by CloudTrail:
Control plane activities on resources, like adding or removing Amazon Simple Storage Service (S3) buckets, are captured by management events.
Data plane operations within a resource, like reading or writing an Amazon S3 object, are captured by data events.
Network activity events that record activities from a private VPC to the AWS service utilizing VPC endpoints, including AWS API calls to which access was refused (in preview).
Through ongoing analysis of CloudTrail management events, insights events assist AWS users in recognizing and reacting to anomalous activity related to API calls and API error rates.
Trails of AWS CloudTrail
Overview
AWS account actions are recorded by Trails, which then distribute and store the events in Amazon S3. Delivery to Amazon CloudWatch Logs and Amazon EventBridge is an optional feature. You can feed these occurrences into your security monitoring programs. You can search and examine the logs that CloudTrail has collected using your own third-party software or programs like Amazon Athena. AWS Organizations can be used to build trails for a single AWS account or for several AWS accounts.
Storage and monitoring
By establishing trails, you can send your AWS CloudTrail events to S3 and, if desired, to CloudWatch Logs. You can export and save events as you desire after doing this, which gives you access to all event details.
Encrypted activity logs
You may check the integrity of the CloudTrail log files that are kept in your S3 bucket and determine if they have been altered, removed, or left unaltered since CloudTrail sent them there. Log file integrity validation is a useful tool for IT security and auditing procedures. By default, AWS CloudTrail uses S3 server-side encryption (SSE) to encrypt all log files sent to the S3 bucket you specify. If required, you can optionally encrypt your CloudTrail log files using your AWS Key Management Service (KMS) key to further strengthen their security. Your log files are automatically decrypted by S3 if you have the decrypt permissions.
Multi-Region
AWS CloudTrail may be set up to record and store events from several AWS Regions in one place. This setup ensures that all settings are applied uniformly to both freshly launched and existing Regions.
Multi-account
CloudTrail may be set up to record and store events from several AWS accounts in one place. This setup ensures that all settings are applied uniformly to both newly generated and existing accounts.
AWS CloudTrail pricing
AWS CloudTrail: Why Use It?
By tracing your user behavior and API calls, AWS CloudTrail Pricing makes audits, security monitoring, and operational troubleshooting possible .
AWS CloudTrail Insights
Through ongoing analysis of CloudTrail management events, AWS CloudTrail Insights events assist AWS users in recognizing and reacting to anomalous activity related to API calls and API error rates. Known as the baseline, CloudTrail Insights examines your typical patterns of API call volume and error rates and creates Insights events when either of these deviates from the usual. To identify odd activity and anomalous behavior, you can activate CloudTrail Insights in your event data stores or trails.
Read more on Govindhtech.com
#AWSCloudTrail#multicloud#AmazonS3bucket#SaaS#generativeAI#AmazonS3#AmazonCloudWatch#AWSKeyManagementService#News#Technews#technology#technologynews
0 notes
Text
ETL Pipeline Performance Tuning: How to Reduce Processing Time
In today’s data-driven world, businesses rely heavily on ETL pipelines to extract, transform, and load large volumes of data efficiently. However, slow ETL processes can lead to delays in reporting, bottlenecks in data analytics, and increased infrastructure costs. Optimizing ETL pipeline performance is crucial for ensuring smooth data workflows, reducing processing time, and improving scalability.
In this article, we’ll explore various ETL pipeline performance tuning techniques to help you enhance speed, efficiency, and reliability in data processing.
1. Optimize Data Extraction
The extraction phase is the first step of the ETL pipeline and involves retrieving data from various sources. Inefficient data extraction can slow down the entire process. Here’s how to optimize it:
a) Extract Only Required Data
Instead of pulling all records, use incremental extraction to fetch only new or modified data.
Implement change data capture (CDC) to track and extract only updated records.
b) Use Efficient Querying Techniques
Optimize SQL queries with proper indexing, partitioning, and WHERE clauses to fetch data faster.
Avoid SELECT * statements; instead, select only required columns.
c) Parallel Data Extraction
If dealing with large datasets, extract data in parallel using multi-threading or distributed processing techniques.
2. Improve Data Transformation Efficiency
The transformation phase is often the most resource-intensive step in an ETL pipeline. Optimizing transformations can significantly reduce processing time.
a) Push Transformations to the Source Database
Offload heavy transformations (aggregations, joins, filtering) to the source database instead of handling them in the ETL process.
Use database-native stored procedures to improve execution speed.
b) Optimize Joins and Aggregations
Reduce the number of JOIN operations by using proper indexing and denormalization.
Use hash joins instead of nested loops for large datasets.
Apply window functions for aggregations instead of multiple group-by queries.
c) Implement Data Partitioning
Partition data horizontally (sharding) to distribute processing load.
Use bucketing and clustering in data warehouses like BigQuery or Snowflake for optimized query performance.
d) Use In-Memory Processing
Utilize in-memory computation engines like Apache Spark instead of disk-based processing to boost transformation speed.
3. Enhance Data Loading Speed
The loading phase in an ETL pipeline can become a bottleneck if not managed efficiently. Here’s how to optimize it:
a) Bulk Loading Instead of Row-by-Row Inserts
Use batch inserts to load data in chunks rather than inserting records individually.
Tools like COPY command in Redshift or LOAD DATA INFILE in MySQL improve bulk loading efficiency.
b) Disable Indexes and Constraints During Load
Temporarily disable foreign keys and indexes before loading large datasets, then re-enable them afterward.
This prevents unnecessary index updates for each insert, reducing load time.
c) Use Parallel Data Loading
Distribute data loading across multiple threads or nodes to reduce execution time.
Use distributed processing frameworks like Hadoop, Spark, or Google BigQuery for massive datasets.
4. Optimize ETL Pipeline Infrastructure
Hardware and infrastructure play a crucial role in ETL pipeline performance. Consider these optimizations:
a) Choose the Right ETL Tool & Framework
Tools like Apache NiFi, Airflow, Talend, and AWS Glue offer different performance capabilities. Select the one that fits your use case.
Use cloud-native ETL solutions (e.g., Snowflake, AWS Glue, Google Dataflow) for auto-scaling and cost optimization.
b) Leverage Distributed Computing
Use distributed processing engines like Apache Spark instead of single-node ETL tools.
Implement horizontal scaling to distribute workloads efficiently.
c) Optimize Storage & Network Performance
Store intermediate results in columnar formats (e.g., Parquet, ORC) instead of row-based formats (CSV, JSON) for better read performance.
Use compression techniques to reduce storage size and improve I/O speed.
Optimize network latency by placing ETL jobs closer to data sources.
5. Implement ETL Monitoring & Performance Tracking
Continuous monitoring helps identify performance issues before they impact business operations. Here’s how:
a) Use ETL Performance Monitoring Tools
Use logging and alerting tools like Prometheus, Grafana, or AWS CloudWatch to monitor ETL jobs.
Set up real-time dashboards to track pipeline execution times and failures.
b) Profile and Optimize Slow Queries
Use EXPLAIN PLAN in SQL databases to analyze query execution plans.
Identify and remove slow queries, redundant processing, and unnecessary transformations.
c) Implement Retry & Error Handling Mechanisms
Use checkpointing to resume ETL jobs from failure points instead of restarting them.
Implement automatic retries for temporary failures like network issues.
Conclusion
Improving ETL pipeline performance requires optimizing data extraction, transformation, and loading processes, along with choosing the right tools and infrastructure. By implementing best practices such as parallel processing, in-memory computing, bulk loading, and query optimization, businesses can significantly reduce ETL processing time and improve data pipeline efficiency.
If you’re dealing with slow ETL jobs, start by identifying bottlenecks, optimizing SQL queries, and leveraging distributed computing frameworks to handle large-scale data processing effectively. By continuously monitoring and fine-tuning your ETL workflows, you ensure faster, more reliable, and scalable data processing—empowering your business with real-time insights and decision-making capabilities.
0 notes
Text
B2B Buyer Intent Data Game-Changers: Unlocking Smarter Lead Generation with Acceligize
The Rise of Intent Data in Modern B2B Marketing In today’s highly competitive B2B landscape, understanding who your buyers are is no longer enough. To drive true demand generation success, brands must uncover what those buyers are actively researching, when they are in-market, and why they’re searching in the first place. That’s where B2B buyer intent data has become a game-changer.
By tapping into behavioral signals across digital channels, buyer intent data allows businesses to identify prospects who are actively evaluating solutions—well before they fill out a form or respond to outreach. At Acceligize, we help forward-thinking B2B organizations harness this intelligence to drive more targeted, personalized, and high-converting marketing campaigns.

What Is Buyer Intent Data—and Why Does It Matter in B2B? Buyer intent data refers to the digital footprints left behind when prospects research topics, visit competitor sites, engage with industry content, or participate in relevant online activities. This data signals potential purchase intent—and when captured effectively, it reveals which companies are “in-market” right now.
Unlike traditional lead scoring, which relies heavily on historical or firmographic information, intent data provides real-time insight into active buying behavior. For B2B companies, this changes everything: it shortens sales cycles, enhances account prioritization, and dramatically improves pipeline quality.
Acceligize: Powering Demand Generation with Intent Intelligence At Acceligize, we’ve embedded buyer intent intelligence into the core of our B2B demand generation solutions. Our advanced data ecosystem aggregates and analyzes billions of intent signals across content networks, search behavior, and media engagement. This allows our clients to:
Identify high-potential accounts earlier in the buying journey
Deliver personalized messaging tailored to specific interests and research topics
Prioritize outreach to leads that are more likely to convert
Align marketing and sales teams with a shared understanding of buyer readiness
By focusing on behavior-based triggers rather than assumptions, we enable businesses to meet prospects with exactly what they need, exactly when they need it.
B2B Buyer Intent Data Trends to Watch in 2025 The use of intent data is evolving rapidly—and staying ahead requires awareness of key trends:
AI-Driven Predictive Analytics: More companies are combining AI and machine learning with intent data to forecast buying signals with greater accuracy. Acceligize integrates AI layers to recommend content, channels, and timing based on intent scoring models.
Hyper-Personalization at Scale: Intent data fuels deeper personalization across campaigns. With real-time insights, marketers can craft content journeys that feel tailored to the individual, even within large ABM programs.
Intent-Based ABM: Account-Based Marketing is no longer just about targeting ideal customers—it’s about targeting the right accounts at the right time. Acceligize’s ABM strategies leverage intent to prioritize account lists dynamically and optimize outreach efficiency.
Cross-Channel Signal Integration: From webinars to search engines, buyer activity spans multiple touchpoints. Acceligize tracks and unifies signals across channels to create a comprehensive view of intent that’s actionable across platforms.
How Intent Data Accelerates Pipeline and ROI B2B marketers who leverage intent data consistently see better performance across the funnel. Why? Because they focus resources where the interest already exists. Acceligize’s intent-powered campaigns have helped clients achieve:
Up to 3x increase in MQL-to-SQL conversion rates
Reduced cost-per-lead (CPL) by targeting only in-market accounts
Improved sales velocity and shorter deal cycles
Higher account engagement and nurturing efficiency
Get more insights@ https://acceligize.com/our-solutions/
When intent data is applied strategically, it’s not just a performance booster—it becomes a competitive advantage.
Final Thoughts: Ready to Leverage Intent Like a Game-Changer? The future of B2B lead generation is not about casting wider nets—it’s about casting smarter ones. Buyer intent data is changing the rules of engagement, and those who harness it effectively will dominate their market.
At Acceligize, we help our clients turn intent insights into impactful demand generation results. Whether you're launching a new ABM initiative, enhancing your sales outreach, or optimizing your digital campaigns, our intent-driven approach ensures you’re always one step ahead of the buyer—and the competition.
Read More@ https://acceligize.com/featured-blogs/b2b-buyer-intent-data-game-changers/
#b2b#b2b lead generation#b2b saas#b2b services#b2bbusiness#b2bdatabase#b2bmarketing#b2bsales#digital painting#Acceligize#Acceligize b2b demand generation
0 notes
Text
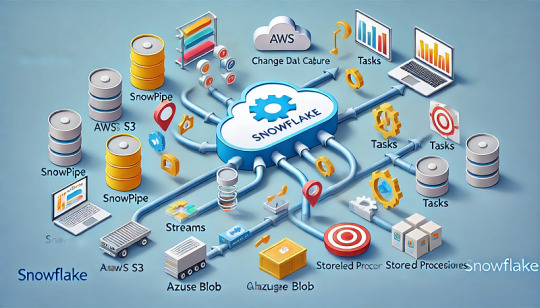
A guide to setting up automated data workflows with Snowflake.
Introduction
In today’s data-driven world, organizations need to process vast amounts of data efficiently. Snowflake, a cloud-based data platform, offers powerful automation features that help streamline workflows, reduce manual effort, and enhance data processing efficiency.
Automating data workflows in Snowflake is essential for:
Real-time data ingestion from various sources.
Incremental data processing using change data capture (CDC).
Scheduled data transformations for ETL/ELT pipelines.
Trigger-based workflows that respond to new data events.
This guide will walk you through Snowflake’s automation features, step-by-step implementation, and best practices to ensure optimal workflow execution.
Understanding Snowflake Automation Features
Snowflake provides several built-in automation tools to simplify data workflows:
1. Snowpipe: Automated Data Ingestion
What it does: Snowpipe enables continuous and automated loading of data from cloud storage (AWS S3, Azure Blob, or Google Cloud Storage) into Snowflake tables.
Key Benefits:
Near real-time data ingestion.
Cost-efficient pay-per-use pricing model.
Automatic triggering using cloud storage event notifications.
2. Streams: Change Data Capture (CDC) in Snowflake
What it does: Streams track inserts, updates, and deletes in a table, enabling incremental data processing.
Key Benefits:
Efficient CDC mechanism for ETL workflows.
Ensures only modified data is processed, reducing compute costs.
Works seamlessly with Snowflake Tasks for automation.
3. Tasks: Automating SQL Workflows
What it does: Snowflake Tasks allow scheduling and chaining of SQL queries, enabling sequential execution.
Key Benefits:
Automates transformations and incremental data loads.
Supports event-driven workflows.
Can be scheduled using cron expressions.
4. Stored Procedures: Automating Complex Business Logic
What it does: Stored procedures allow procedural execution of SQL and Python-based logic within Snowflake.
Key Benefits:
Enables advanced data processing beyond standard SQL queries.
Supports loops, conditions, and API calls.
Works well with Tasks and Streams for automation.
Step-by-Step Guide to Setting Up Automated Workflows in Snowflake
1. Automating Data Ingestion with Snowpipe
Step 1: Create an External Stage
sqlCREATE OR REPLACE STAGE my_s3_stage URL = 's3://my-bucket/data/' STORAGE_INTEGRATION = my_s3_integration;
Step 2: Define a File Format
sqlCREATE OR REPLACE FILE FORMAT my_csv_format TYPE = 'CSV' FIELD_OPTIONALLY_ENCLOSED_BY = '"';
Step 3: Create a Table for the Incoming Data
sqlCREATE OR REPLACE TABLE raw_data ( id INT, name STRING, created_at TIMESTAMP );
Step 4: Create and Configure Snowpipe
sqlCREATE OR REPLACE PIPE my_snowpipe AUTO_INGEST = TRUE AS COPY INTO raw_data FROM @my_s3_stage FILE_FORMAT = (FORMAT_NAME = my_csv_format);
✅ Outcome: This Snowpipe will automatically load new files from S3 into the raw_data table whenever a new file arrives.
2. Scheduling Workflows Using Snowflake Tasks
Step 1: Create a Task for Data Transformation
sqlCREATE OR REPLACE TASK transform_data_task WAREHOUSE = my_warehouse SCHEDULE = 'USING CRON 0 * * * * UTC' AS INSERT INTO transformed_data SELECT id, name, created_at, CURRENT_TIMESTAMP AS processed_at FROM raw_data;
✅ Outcome: This task runs hourly, transforming raw data into a structured format.
3. Tracking Data Changes with Streams for Incremental ETL
Step 1: Create a Stream on the Source Table
sqlCREATE OR REPLACE STREAM raw_data_stream ON TABLE raw_data;
Step 2: Create a Task to Process Changes
sqlCREATE OR REPLACE TASK incremental_etl_task WAREHOUSE = my_warehouse AFTER transform_data_task AS INSERT INTO processed_data SELECT * FROM raw_data_stream WHERE METADATA$ACTION = 'INSERT';
✅ Outcome:
The Stream captures new rows in raw_data.
The Task processes only the changes, reducing workload and costs.
4. Using Stored Procedures for Automation
Step 1: Create a Python-Based Stored Procedure
sqlCREATE OR REPLACE PROCEDURE cleanup_old_data() RETURNS STRING LANGUAGE PYTHON RUNTIME_VERSION = '3.8' HANDLER = 'cleanup' AS $$ def cleanup(session): session.sql("DELETE FROM processed_data WHERE processed_at < CURRENT_DATE - INTERVAL '30' DAY").collect() return "Cleanup Completed" $$;
Step 2: Automate the Procedure Execution Using a Task
sqlCREATE OR REPLACE TASK cleanup_task WAREHOUSE = my_warehouse SCHEDULE = 'USING CRON 0 0 * * * UTC' AS CALL cleanup_old_data();
✅ Outcome: The procedure automatically deletes old records every day.
Best Practices for Snowflake Automation
1. Optimize Task Scheduling
Avoid overlapping schedules to prevent unnecessary workload spikes.
Use AFTER dependencies instead of cron when chaining tasks.
2. Monitor and Troubleshoot Workflows
Use SHOW TASKS and SHOW PIPES to track execution status.
Check TASK_HISTORY and PIPE_USAGE_HISTORY for errors.
sqlSELECT * FROM SNOWFLAKE.INFORMATION_SCHEMA.TASK_HISTORY WHERE STATE != 'SUCCEEDED' ORDER BY COMPLETED_TIME DESC;
3. Cost Management
Choose the right warehouse size for executing tasks.
Pause tasks when not needed to save credits.
Monitor compute costs using WAREHOUSE_METERING_HISTORY.
4. Security Considerations
Grant least privilege access for tasks and Snowpipe.
Use service accounts instead of personal credentials for automation.
Encrypt sensitive data before ingestion.
Conclusion
Snowflake provides powerful automation tools to streamline data workflows, enabling efficient ETL, real-time ingestion, and scheduled transformations. By leveraging Tasks, Streams, Snowpipe, and Stored Procedures, you can build a fully automated data pipeline that is cost-effective, scalable, and easy to manage.
✅ Next Steps:
Experiment with multi-step task workflows.
Integrate Snowflake automation with Apache Airflow.
Explore event-driven pipelines using cloud functions.
WEBSITE: https://www.ficusoft.in/snowflake-training-in-chennai/
0 notes
Text
API Automation Testing: Challenges and How to Overcome Them
API automation testing is crucial for validating backend systems, ensuring robust integration, and maintaining seamless communication between applications. However, it comes with its own set of challenges.
Test Data Management:
APIs often require dynamic data that changes with each test. Generating appropriate test data, handling data dependencies, and ensuring data consistency can be difficult. To overcome this, implement data-driven testing and use mock servers to simulate data responses.
API Versioning:
As APIs evolve, maintaining test scripts across versions can be tricky. API Automated Testing may break due to changes in API endpoints or parameters. A solution is to design adaptable test scripts that can easily handle version control by using proper tagging and modular code.
Error Handling:
Automating edge cases and error scenarios, such as server downtime or rate limits, is challenging. Employ robust error-handling mechanisms in your scripts to capture and log all possible failure points for future analysis.
Security Testing:
Ensuring APIs are secure from vulnerabilities such as SQL injection or unauthorized access requires specialized tools. Use security testing tools and integrate them into your CI/CD pipeline to test API security continuously.
By addressing these challenges, API automation testing can lead to more reliable and secure software.
#api automation#api automation framework#api automation testing#api automation testing tools#api automation tools#api testing framework#api testing techniques#api testing tools#api tools
0 notes