#sub4
Explore tagged Tumblr posts
Visit Tumblr Blog
Explore Tumblr blogs with no restrictions, modern design and the best experience.
Last Seen Tumblr Blogs


Fun Fact
Mobile Tumblr US users spend an average of 4.04 minutes per session on the app.
Text
As the seasons change, so do our fashion choices. Puffer jackets, particularly men’s duck down puffer jackets, offer both style and functionality throughout the year. Whether you’re navigating chilly autumn evenings or braving the winter cold, there’s a perfect puffer jacket look for every season. Let’s dive into some stylish outfit inspirations for men featuring the versatile duck down puffer jacket.
0 notes
Text
5 months til new wheelchair yippee!! sticking with RGK (i love my big green beast) but cannot wait to have something that fits properly (and has push handles)
#will buy from the preloved section of their site tho... can't afford a sub4 out of pocket#crazy that i could buy a chair fully custom to me for the same price#but i'm set on rgk...#4 KILOGRAMS IS CRAZY LIGHT!!!! how can i pass that up#trying to limit my spending because i need a power assist too
7 notes
·
View notes
Text
A full run. She is going to be a sub4 who sets 8s.
18 notes
·
View notes
Text
Submachine Legacy: additional commentary (Monoliths, Shattered Quadrant, and other details)
Apparently I am NOT done talking about this game, lol. To see me talking about the main levels + optional ruins, check my previous post. Beware of spoilers.
General comments

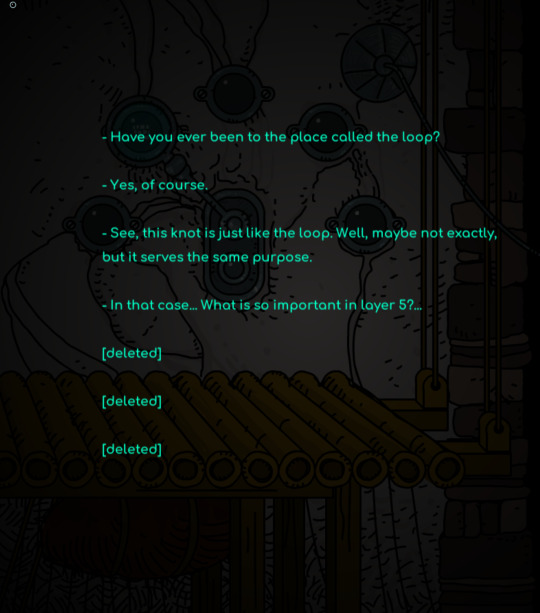
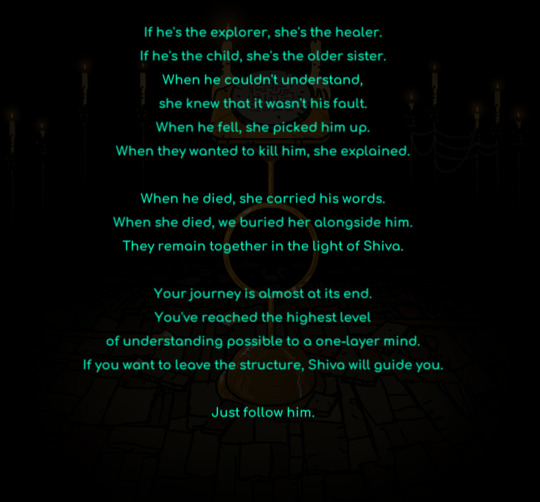
I must comment on the map/menu/however this is called because I noticed (rather late) on my going back and forth the details literally surrounding each level. Namely, how level 3 and 'break the loop' are in the middle a spiral, I assume to symbolize the loopy nature of the locations. Level 6 is in the middle of an octagon, kind of like a shield, which goes well with it being the defence systems of the Submachine. Level 7 lays in the middle of many more concentrical circles, which I'm guessing has to do something about it being the Core of the Submachine. And level 8 rests against seven parallel lines, which goes nicely with you jumping through the seven main layers in that level.
I may be, once again, reading too much into details, but I think it makes enough sense and I like it. Kind of wondering now if level 9 shouldn't have something special about it too as the Knot.
Anyway.
Monoliths/Secrets
So, I was right in the end that we'll have to come back to this with the navigator, but wrong in the we actually can't take the navigator with us and must jump back and forth between levels (so much going back and forth). Anyway, this gives us new tidbits of Submachine lore (which is nice).


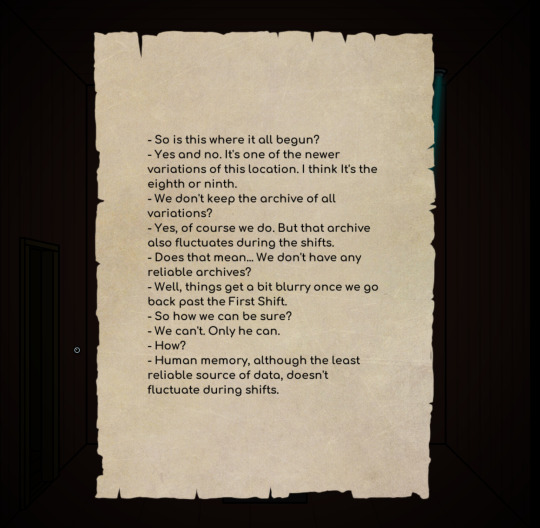
This goes on in the Lighthouse. Love how the fact that different versions of the game exist is being incorporated to the lore.


Finally figured how this one worked out. Turns out in the end the Loop did have a layer coordinate thingy (which I started suspecting when I didn't find one at level 7 either) it just was hidden as a secret. Kind of a pity, since I liked the idea of loops being something that maybe existed outside/beyond layers maybe. It's not like I had a lot of time to think about this/develop it into a proper theory, so it's not like I was super attached to it either, so it's fine.


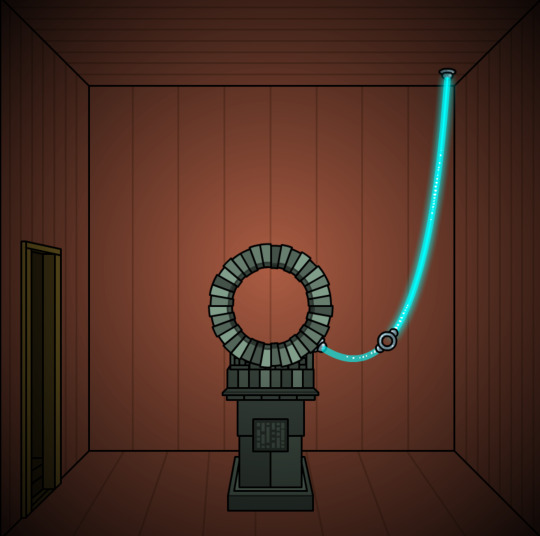
Lots of portals but no notes in level 4 (that I remember, I binge-played the unlocking Monoliths and it's kinda blurry what is from what level. Should have named the screenshots, lol). BUT! We finally can unlock that door from Sub4, which was satisfying.


Level 5 is as in 4, meaning no notes found. But again, I like how you could finally see what was behind that closed door though!


Lots of goodies in level 6! It was nice to get extra content while also keeping the 'secret' notes we had in the originals. Go hunting lore.

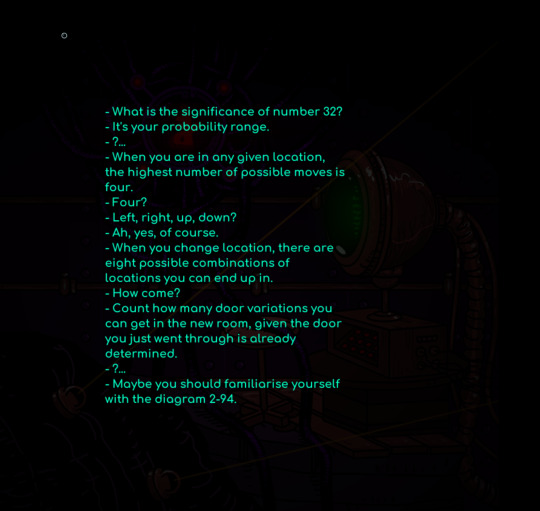
I love this. I love the note talking about the significance of 32 when it's something we've all collectively lost our minds about. I love this xD


Here we got the same notes we did in the originals, but as a matter of fact I did not remember the one screenshot here and WHAT?! If I weren't so sleepy right now I'd be talking about it probably (as it is I am surprised I can write anything with a semblance of coherence right now, may my insomnia fuck off and leave me alone).


I'm gonna be very honest, I needed the help of the very kind people making guides on Steam for this because I had all the secrets but couldn't figure out how to access the secret room (previously I got the opposite problem, could access the portals but didn't have the secrets to power them). The notes are the same that we had in the originals.


And last but not least level 10, were I thought there was only one secret area but there were two! I thought it wa really cool that you use the pearls and stone cubes for this.
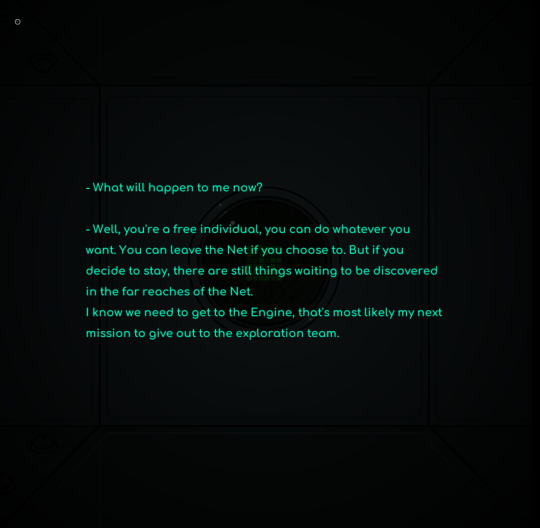
The notes here seem to be more or less the same as the originals, but thw wording has been changed some and we're also being teased about the Engine which has me vibrating.
All in all, nice little extras! Shattered Quadrant will come in the reblogs when I get to play it (yes I know I'm slow playing. Do not judge me)
26 notes
·
View notes
Text
Create Your Perfect Fit with Custom Swimwear
Why Choose Custom Swimwear?
When it comes to swimwear, the perfect fit makes all the difference. Whether you're competing, training, or relaxing at the beach, custom options allow you to achieve a combination of comfort and style. Custom swimwear australia caters to individuals and teams, offering high-quality designs tailored to specific needs. You can pick colours, styles, and materials that suit your taste and align with your unique preferences.
Versatility Meets Functionality
One of the standout benefits of custom swimwear australia is its versatility. From one-piece swimsuits to swim trunks and rash guards, there’s a design for every purpose. Plus, the ability to add logos or personal branding makes it ideal for professional swimming teams, schools, or corporate events. These pieces are crafted with premium fabrics, ensuring durability, UV protection, and quick-drying properties perfect for Australia's sun-soaked shores.
Simple Steps to Customisation
The customisation process is straightforward and user-friendly. You get to choose from a range of styles, sizes, and colours, ensuring that your swimwear matches your vision. For individuals, this means swimwear that fits perfectly and turns heads at the pool. For teams, the ability to feature logos and matching colours builds a sense of unity and professionalism.
Turn your ideas into reality with custom swimwear solutions. Whether it’s for sport or leisure, tailored swimwear guarantees a look and fit that you’ll love!
Source Link: https://sites.google.com/view/sub4-apparel/create-your-perfect-fit-with-custom-swimwear

0 notes
Text

shiloh remembered taking care of some plants that looked too far gone to save. they were crisped at the edges, browned and brittle, drooping like their stems had forgotten how to hold themselves up. they looked like they’d already chosen to give up. shiloh also remembered cradling the pot between his hands, ready to toss it out. and it was blair who had gently stopped him. it wasn't dead, blair had said. plants just look like that sometimes, but if you repot it, give it light, attention, a little patience, it could be brought back to life.
and that’s what this felt like.
milo, smiling at him with that curve of his lips—that smile made shiloh feel like he was waking up. like after all the static years, the numb blur of lonely days, his body remembered what it felt like to be seen. a wilted thing finally turning toward the sun. just that small, familiar moment made something in his chest flutter, weak but alive. it made him want to move, to do something. it wasn’t just the years apart. it was the fact that milo didn’t hate him; that realisation had brought back colour into the grayscale mess of shiloh’s head.
having his friends here in new york was a shock to the system. it was a drastic change in pace that he hadn’t really braced himself for. for so long it had been just him and tj in his smoke-heavy flat, his messy sleeping hours, the occasional bender. but now there were people, voices, footsteps in his hallway, laughter echoing from the living room. ant squealing at every landmark they passed, even if it was just a random statue. blair pointing at buildings with wide eyes like he expected to spot spiderman swinging by. he wanted to keep trying, especially while they were all still here.
“ramen, then,” he nodded, already reaching for the two things he needed—his phone and his keys.
it felt like a privilege, getting to spend a day with milo. but he didn’t know which was worse: being stuck in a car with ant singing empire state of mind and slapping his arm every time he spotted a movie location, or being alone with milo, who made his pulse jump every time he so much as looked at him. he grabbed a black face mask and a pair of sunglasses, tugging them on as he glanced at himself briefly in the mirror near the door. it was just enough to blend in. he was still technically a public figure, the last thing he wanted was a swarm of fans ruining what little time he had with milo. “wala pa atang ten minutes by car 'yun? it’s easier to take the subway, pero baka pagalitan ako ng manager ko. i'm not allowed to commute.”

milo almost laughs when he hears shiloh's voice— like nothing’s changed, like it hasn’t been years, like they didn’t forget how to be around each other. “ ikaw, ikaw nag suggest. i’ll be fine with anything naman. i trust you. ” he teases lightly, eyes flicking toward him with a familiar softness. the same look he used to give him when shiloh would drag him to some new stall or shop back in baguio, rambling about how good something tasted while barely touching his own plate. “ but okay. ramen. kahit saan na lang basta may sabaw at mainit. ”
he doesn’t say it out loud, but he likes watching shiloh do this— offer things. it’s like some muscle memory kicking in, something that exists even after everything they’ve broken. there’s this need in shiloh that milo still recognizes. like he’s trying so hard to fix something, to compensate, to make this visit more than what it is. milo knows. he’s not blind to it. he can feel the tension under the surface, the little tremor in his fingers, the slight twitch in his smile. he knows what this is. he just doesn’t want to name it. and yet, milo feels sorry for making shiloh feel like this.
his own chest feels tight sometimes, like something is folding in on itself. it’s not sadness. not quite. it’s the kind of ache that comes from looking at something beautiful that’s about to disappear. and shiloh— shiloh looks like that. tired eyes, a jaw too sharp now, knuckles tapping against his thigh. and yet, he’s still trying. still offering pieces of himself like crumbs on a trail back to something they used to be. milo can't allow that to happen. he still wants to right all the wrongs between tthem. “ ano, tara? i’m ready when you are. ”
#i was rereading their old threads sa sub4#feeling ko aatakehin ako sa puso#ang sakit ng dibdib ko jusko lord#⠀⠀𐔌 𝒔ℎ𝑖𝑙𝑜ℎ 𝗅𝗂 : general ⁎#⠀⠀𐔌 𝒔ℎ𝑖𝑙𝑜ℎ 𝗅𝗂 : prose ⁎#⠀⠀𐔌 𝒗𝑒𝑟𝑠𝑒 : forevermore ⁎#⠀⠀𐔌 𝒇𝑜𝑟𝑒𝑣𝑒𝑟𝗆𝗈𝗋𝖾 : sub⁴ ⁎#loveszip
27 notes
·
View notes
Text
#Tutorial: Switch Menu
Nesse tutorial você vai aprender a montar o Switch Menu para seu Tumblr, Blog e Afins.
Pra quem não conhece, para aparecer o conteúdo, basta clicar no assunto desejado.

Primeiro passo - Antes de </head> Cole isso aqui lá.
Segundo passo - Crie os botões no seu CSS, do jeito que você quiser, vou colocar o meu, se usar, credite ok? não custa nada!
/**Menu - Endstonight|Tumblr**/ .menutitle{color: #387377; font-family: ‘Yanone Kaffeesatz’, georgia; font-size:16px; line-height:28px; font-weight:normal; padding:5px; margin-bottom:8px; text-align: left; letter-spacing:1px; background: #f0f0f0;text-indent : 10px;-webkit-transition-duration: .40s;} .menutitle:hover{text-indent : 19px;}
( PS: Link da Font - <link href='http://fonts.googleapis.com/css?family=Yanone+Kaffeesatz’ rel='stylesheet’ type='text/css’>
cole antes de </head> )
Terceiro Passo - Faça o iframe comum no seu menu, e depois monte ele, mais ou menos assim:
<div id=“tutos” style=“display:none”>
<div class=“box”><h2>Tutoriais</h2>
<div id=“topdiv”>
<div class=“menutitle” onclick=“SwitchMenu('sub1’)” style=“cursor:pointer” >Menus</div>
<span class=“submenu” id=“sub1”>
Conteudoo
</span>
Obs: Se você for fazer outros menus, basta substituir o sub1 por "sub2" , "sub3" , "sub4", você pode fazer quantos quiser.
Obs 2: Não retire a ID “topdiv” não vai funcionais sem ela.
0 notes
Text


https://www.geocities.ws/eule/sub4.html
1 note
·
View note
Text
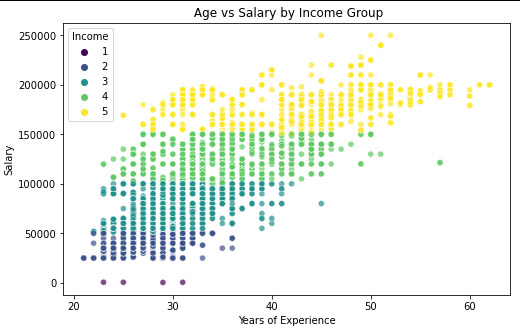
WK4 - Testing a Potential Moderator
For the this example I used parte of the same code used um Wk3, ralatered to Salaries. It was used Salary as the moderator between years of experience and Age.
The rest of the Code:
Define income groups correctly
def Income(sal): if sal['Salary'] <= 10000:
return 1
elif sal['Salary'] <= 50000:
return 2
elif sal['Salary'] <= 100000:
return 3
elif sal['Salary'] <= 150000:
return 4
else: # This ensures salaries > 200000 are assigned group 3 return 5
data_clean['Income'] = data_clean.apply(lambda sal: Income(sal), axis=1)
Create subsets
sub1 = data_clean[data_clean['Income'] == 1] sub2 = data_clean[data_clean['Income'] == 2] sub3 = data_clean[data_clean['Income'] == 3] sub4 = data_clean[data_clean['Income'] == 4] sub5 = data_clean[data_clean['Income'] == 5]
Compute correlation for each subset separately
if len(sub1) > 1: print('Association between Age and Salary for Very Low Income Salary:') print(scipy.stats.pearsonr(sub1['Age'], sub1['Salary']))
if len(sub2) > 1: print('\nAssociation between Age and Salary for Low Income Salary:') print(scipy.stats.pearsonr(sub2['Age'], sub2['Salary']))
if len(sub3) > 1: print('\nAssociation between Age and Salary for Medium Income Salary:') print(scipy.stats.pearsonr(sub3['Age'], sub3['Salary']))
if len(sub4) > 1: print('\nAssociation between Age and Salary for High Income Salary:') print(scipy.stats.pearsonr(sub4['Age'], sub4['Salary']))
if len(sub5) > 1: print('\nAssociation between Age and Salary for Very High Income Salary:') print(scipy.stats.pearsonr(sub5['Age'], sub5['Salary']))
Bar Chart: Average Salary by Income Group
income_salary_avg = data_clean.groupby('Income')['Salary'].mean()
plt.figure(figsize=(8, 5)) sns.barplot(x=income_salary_avg.index, y=income_salary_avg.values, palette="viridis") plt.xlabel("Income Group") plt.ylabel("Average Salary") plt.title("Average Salary by Income Group") plt.xticks(ticks=range(0, 5), labels=["Very Low", "Low", "Medium", "High", "Very High"]) plt.show()

Scatter plot for Age vs Salary by Income Group
plt.figure(figsize=(8, 5)) # Set figure size sns.scatterplot( x=data_clean["Age"], y=data_clean["Salary"], hue=data_clean["Income"], # Color by Income Group palette="viridis", # Choose a color palette alpha=0.7 # Adjust transparency for better visualization ) plt.xlabel("Years of Experience") plt.ylabel("Salary") plt.title(" Age vs Salary by Income Group") plt.show()
Scatter plot for Years of Experience vs Salary by Income Group
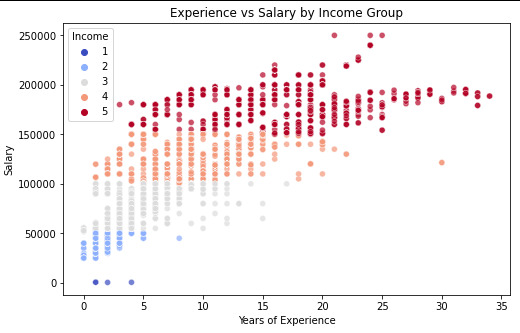
plt.figure(figsize=(8, 5)) sns.scatterplot( x=data_clean["Years of Experience"], y=data_clean["Salary"], hue=data_clean["Income"], palette="coolwarm", alpha=0.7 ) plt.xlabel("Years of Experience") plt.ylabel("Salary") plt.title("Experience vs Salary by Income Group") plt.show()
Scatter plot for Age vs Salary with Regression line styling
plt.figure(figsize=(8, 5))
sns.regplot( x=data_clean["Age"], y=data_clean["Salary"], scatter_kws={"alpha": 0.5, "color": "blue"}, # Scatter points styling line_kws={"color": "red"}, # Regression line styling ) plt.xlabel("Age") plt.ylabel("Salary") plt.title("Regression Plot: Age vs Salary") plt.show()

Scatter plot for Years of Experience vs Salary
sns.regplot( x=data_clean["Years of Experience"], y=data_clean["Salary"], scatter_kws={"alpha": 0.5, "color": "green"}, line_kws={"color": "red"}, ) plt.xlabel("Years of Experience") plt.ylabel("Salary") plt.title("Regression Plot: Years of Experience vs Salary") plt.show()

Scatter plot for Age vs Salary by Income Group
plt.figure(figsize=(8, 5))
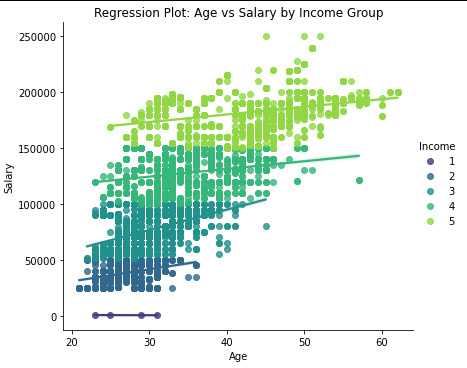
sns.lmplot( x="Age", y="Salary", hue="Income", data=data_clean, palette="viridis", height=5, aspect=1.2 ) plt.xlabel("Age") plt.ylabel("Salary") plt.title("Regression Plot: Age vs Salary by Income Group") plt.show()
Result:

It is possible to verify that correlation between the Age and salary is for Very Low income, is -0.64, which means it ia a negative correlation and has a p-value=0.35, that is over thant p-value<0.05. so p-value for the very low it is no significante.
for the rest of the groups, Low, Medium, High and Very High, the correlation value is positive, and the p-value is unde 0.05, so we cansay that p-valeu for the rest is a significate
it is possivel to see in the Scatter plot .
0 notes
Text
https://opphustle.com/?utm_campaign={replace}&sub2=&sub3=&sub4=171725351713&sub5=720901565753&sub6=21901344475&sub7=m&sub8=&sub9=&sub10=&utm_source=Google&customsource={acc2-vb-AMZNPR}&wbraid=&gbraid=&ref_id=Cj0KCQiA_9u5BhCUARIsABbMSPui--op1Cz1y6xDLcJa0L5lpIW5dBKJzElKgD7hsoTtR4K_uKUhH9oaAlxNEALw_wcB&gclid=Cj0KCQiA_9u5BhCUARIsABbMSPui--op1Cz1y6xDLcJa0L5lpIW5dBKJzElKgD7hsoTtR4K_uKUhH9oaAlxNEALw_wcB
0 notes
Text
Analyzing Alcohol Consumption: Data Management and Frequency Distributions in Python
Python Program:
import pandas import numpy as np
data = pandas.read_csv('nesarc_pds.csv', low_memory=False)
print(len(data)) # Number of observations (rows) print(len(data.columns)) # Number of variables (columns)
Drank atleast 12 alcoholic drinks in last 12 months
sub1=data["S2AQ2"].value_counts(sort=False)
make a copy of inserted data
sub2 = sub1.copy()
print("counts for original S2AQ2") c1= sub2 print(c1)
sub2 = sub2.replace(9, np.nan)
print('counts for S2AQ2 with 9 set to nan') c2= sub2 print(c2)
Drank atleast 1 alcoholic drinks in last 12 months
sub3=data["S2AQ3"].value_counts(sort=False)
make a copy of inserted data
sub4 = sub3.copy()
print("counts for original S2AQ3") c3= sub3 print(c3)
sub3 = sub3.replace(9, np.nan)
print('counts for S2AQ3 with 9 set to nan') c3= sub3 print(c3)
Family or friends told to cut down on drinking
sub5=data["S2AQ18"].value_counts(sort=False)
make a copy of inserted data
sub5 = sub1.copy()
print("counts for original S2AQ18") c1= sub5 print(c1)
sub6 = sub5.replace(9, np.nan)
print('counts for S2AQ18 with 9 set to nan') c2= sub6 print(c2)
Interpretation of Results
Variable 1: This variable primarily took values in numeric numbers. Most frequent values were 1 indicating a yes answer to the questions, and value of 9 was used to display data that could be labelled as missing which is replaced in this code to "nan" using the NumPy library.
Variable 2: This distribution reflects that most of the survey population had at some point in their life drank alcoholic drinks. Most of the population answered "1" yes to drinking. 1 was seen as the most common answer in the data set.
Variable 3: The distribution showed a clear grouping, with most of the survey population having drank alcoholic drinks at some point in their life. However, an anomaly was noticed in S2AQ2 when more people answered "2" or no when asked if they had consumed atleast 12 alcoholic drinks in last 12 months. Summary: In this post, I explored alcohol consumption data, managing variables in Python to create meaningful insights. By handling missing data, recoding variables, and analyzing frequency distributions, I highlighted key trends. Most respondents had consumed alcohol at some point (indicated by a frequent "yes" answer), and missing data was coded as "nan" to ensure clarity. Interestingly, while many had consumed alcohol, fewer had done so in the past year, as reflected by a higher count of "no" answers to recent drinking. This assignment emphasized how strategic data management can unveil important behavioral patterns and anomalies within survey data.
#coursera#data management#data visualization#python#data analysis#datascience#assignment#datamanagement
0 notes
Text
Assignment Week 3:
-- coding: Following assignment on Coursera --
""" Spyder Editor
This is a temporary script file. """
-- coding: utf-8 --
""" Created on Mon May 13 08:30:00 GMT +7, 2024
@author: D.T.Long """
reset all
clear all variables in the memory
import pandas import numpy
any additional libraries would be imported here
Hypothesis
print('My hypothesis is: The higher levels of education, the higher ratio of people who think of themselves as a Democrat.')
Read csv file
data=pandas.read_csv('OOL survey.csv', low_memory=False)
Check the population size and variables
print('Population size:',len(data)) print('Number of variables:',len(data.columns)) print ("Frequency distribution of Democrat, Republican,…. 1=Republic, 2=Democrat, 3=Independent, 4=Others, -1=refused") c1 = data['W1_C1'].value_counts(sort=False) print(c1)
print("Percentage of Republican, Democrat….") p1= data['W1_C1'].value_counts(sort=False, normalize=True) print(p1)
print ("""Counts number of Education (Highest Degree Received): 1 = No formal education, 2 = 1st, 2nd, 3rd, or 4th grade 3 = 5th or 6th grade 4 = 7th or 8th grade 5 = 9th grade 6 = 10th grade 7 = 11th grade 8 = 12th grade NO DIPLOMA 9 = HIGH SCHOOL GRADUATE - high school DIPLOMA or the equivalent (GED) 10 = Some college, no degree 11 = Associate degree 12 = Bachelors degree 13 = Master degree 14 = Professional or Doctorate degree """)
'''# Another way to visualize the Frequency of variables c4 = data['PPEDUC'].value_counts(sort=False) print(c4) '''
ct4 = data.groupby('PPEDUC').size() print(ct4)
'''Another way to visualize the Percentage of variables not following categories print("percentage of Highest Degree Received") p4= data['PPEDUC'].value_counts(sort=False, normalize=True) print(p4)
W3-I: Create subset of Democrat and Education
print("Create subgroup of Democrat and Education") sub3 = data[(data['W1_C1']==2)] sub4 = sub3[['W1_C1','W1_C1B','W1_C1C','PPEDUC']] sub5 = sub4.copy()
Convert Democrat level to numeric
sub5['W1_C1B'] = pandas.to_numeric(sub5['W1_C1B'])
Replace blank and -1 (refuse) to python missing (NaN)
sub5['W1_C1B']=sub5['W1_C1B'].replace(-1, numpy.nan) sub5['W1_C1C']=sub5['W1_C1C'].replace(r'^\s*$', numpy.nan, regex=True)
Check 10 first row'
'sub5.head(10)
Check the population and variables size of sub5 data
print('Population size of subset:',len(sub5)) print('Number of variables of subset:',len(sub5.columns))
Frequency distribution for Democrat level
print ("Frequency distribution for Democrat level: 1.0 = Strong, 2.0 = Not very strong, NaN = Missing data") c5 = sub5['W1_C1B'].value_counts(sort=False, dropna = False) print(c5)
Percentage for Democrat level
print("Percentage for Democrat level") p5= sub5['W1_C1B'].value_counts(sort=False, normalize=True, dropna=False) print(p5)
Frequency distribution for closer to Democratic Party
print ("""Frequency distribution of Democrat closer to Democratic Party: 1.0 = Closer to the Republician Party 2.0 = Closer to the Democratic Party 3.0 = Neither closer to the Democratic Party nor Republician Party NaN = Missing data """) c6 = sub5['W1_C1C'].value_counts(sort=False, dropna=False) print(c6)
Percentage for closer to Democratic Party
print("Percentage of closer to Democratic Party") p6= sub5['W1_C1C'].value_counts(sort=False, normalize=True, dropna=False) print(p6)
W3-II: Analyse Democrat with Education
print ("""Counts number of Education (Highest Degree Received): 1 = No formal education, 2 = 1st, 2nd, 3rd, or 4th grade 3 = 5th or 6th grade 4 = 7th or 8th grade 5 = 9th grade 6 = 10th grade 7 = 11th grade 8 = 12th grade NO DIPLOMA 9 = HIGH SCHOOL GRADUATE - high school DIPLOMA or the equivalent (GED) 10 = Some college, no degree 11 = Associate degree 12 = Bachelors degree 13 = Master degree 14 = Professional or Doctorate degree """)
Frequency distribution for Democrat with education
ct7 = sub5.groupby('PPEDUC').size() print(ct7)
Percentage for Democrat with education
pt7 = sub5.groupby('PPEDUC').size()/len(data) print(pt7)
print("""My comment: I created subset of Democrat and Education. For Democrats, they almost said that they are strong Democratic with 65.39%; but there is no evidences to confirm the Democrat are closer to Democratic Party (NaN: 100%). The Democrats with HIGH SCHOOL GRADUATE (9) and Some college (10) account for the highest proportion at 29.42%. """)
End of Assignment Week3
The output of my program:


0 notes
Text
Wear Custom Swimwear to Dive Confidently in Australia
Make waves with Sub4’s custom swimwear in Australia collection! Crafted for a perfect fit, premium durability, and stunning designs, our swimwear is designed to help you perform and look your best in the water.
From sleek men’s swim trunks to chic one-piece swimsuits and high-quality swim caps, Sub4 offers everything you need to stand out in the pool or at the beach. Customise your swimwear to match your unique style and needs. Swim strong, swim in style with Sub4!
Visit https://www.sub4.com.au/category/custom-swimming/ now!

1 note
·
View note
Text
Robert F. Kennedy Jr. Speaking at SXSW 2024
Robert F. Kennedy Jr. speaking at SXSW for a private event hosted by American Values 2024
AV24 - Learn more: https://av24.org/
Watch the RFK Jr. doc https://therealrfkjrmovie.com/trailer1/?sub4=7a1058dc8e9a44eea12cf277e37afe52&afid=23
Producer Jeff Hays - Director Ronny Lynch
David Christopher Lee: https://davidsguide.com
Connect on social media and post this episode :)
https://www.instagram.com/shesallovertheplacepodcast/
https://www.instagram.com/chonacas
https://www.instagram.com/saintkyriaki/
https://twitter.com/katiechonacas
Stay connected subscribe to my newsletter to stay connected https://www.chonacas.com/
Check out my new album "A Lover's Fairytale" https://www.chonacas.com/music/
xo KEC
Check out this episode streaming now in over 100 countries
0 notes
Text
The First Data Analysis
Code:
import pandas as pd import numpy as np
data = pd.read_csv('marscrater_pds.csv', low_memory = False)
print("The diameter of craters that causes HuSL") sub1 = data[(data["MORPHOLOGY_EJECTA_2"].str.contains("HuSL"))] c1 = sub1["DIAM_CIRCLE_IMAGE"].value_counts(sort=True) print(c1.head(30))
print("\nThe diameter of craters that causes HuBL") sub2 = data[(data["MORPHOLOGY_EJECTA_2"].str.contains("HuBL"))] c2 = sub2["DIAM_CIRCLE_IMAGE"].value_counts(sort=True) print(c2.head(30))
print("\nThe diameter of craters that causes SmSL") sub3 = data[(data["MORPHOLOGY_EJECTA_2"].str.contains("SmSL"))] c3 = sub3["DIAM_CIRCLE_IMAGE"].value_counts(sort=True) print(c3.head(30))
print("\nThe diameter of craters that causes HuAm") sub4 = data[(data["MORPHOLOGY_EJECTA_2"].str.contains("HuAm"))] c4 = sub4["DIAM_CIRCLE_IMAGE"].value_counts(sort=True) print(c4.head(30))
print("\nThe diameter of craters that causes Hu") sub5 = data[(data["MORPHOLOGY_EJECTA_2"].str.contains("Hu"))] c5 = sub5["DIAM_CIRCLE_IMAGE"].value_counts(sort=True) print(c5.head(30))
print("\nNumber of Layer = 0") sub6 = data[(data["NUMBER_LAYERS"]==0)] c6 = sub6["DIAM_CIRCLE_IMAGE"].value_counts(sort=True) print(c6.head(30))
print("\nNumber of Layer = 1") sub7 = data[(data["NUMBER_LAYERS"]==1)] c7 = sub7["DIAM_CIRCLE_IMAGE"].value_counts(sort=True) print(c7.head(30))
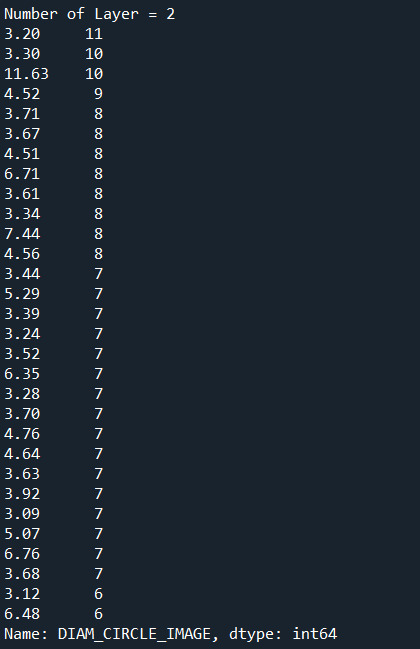
print("\nNumber of Layer = 2") sub8 = data[(data["NUMBER_LAYERS"]==2)] c8 = sub8["DIAM_CIRCLE_IMAGE"].value_counts(sort=True) print(c8.head(30))
print("\nNumber of Layer = 3") sub9 = data[(data["NUMBER_LAYERS"]==3)] c9 = sub9["DIAM_CIRCLE_IMAGE"].value_counts(sort=True) print(c9.head(30))
print("\nNumber of Layer = 4") sub10 = data[(data["NUMBER_LAYERS"]==4)] c10 = sub10["DIAM_CIRCLE_IMAGE"].value_counts(sort=True) print(c10.head(30))
print("\nNumber of Layer = 5") sub11 = data[(data["NUMBER_LAYERS"]==5)] c11 = sub11["DIAM_CIRCLE_IMAGE"].value_counts(sort=True) print(c11.head(30))
Outputs:
the relationships between diameter and morphology ejecta
First of all, as there are may types of morphology ejecta, I would choose the top 5, which are HuSL, HuBL, SmSL, HuAm, and Hu, to analyse their correlations. Also, I chose the top 30 diameters to find the result. Below are the optputs.


2. Does the diameter increase as the number of layers increases?
I think I should change my previous topic after coding with Python because I think it is improper. That is, I came up with this topic, which also relates to the analysis of diameter of craters. So, after checking the type of morphology ejectas, I want to know whether the maximum number of cohensive layers identified is related to the diameter of craters. Also, this time I chose the top 30 as my samples to determine the relationship between the variables. Here's the results.


Conclusions:
In the first result, diameters from 3.09 km to 7.57 km are the ones that are most likely to form a HuSL crater, diameters from 5.05 km to 7.77 km are the ones that are most likely to form a HuBL crater, diameters from 3.03 km to 4.82 km are the ones that are most likely to form a SmSL crater, diameters from 3.07 km to 7.18 km are the ones that are most likely to form a HuAm crater, diameters from 3.26 km to 6.76 km are the ones that are most likely to form a Hu crater.
In the second analysis, yes, the diameter increases as the number of layers increases. Although there are large diameters with less maximum cohensive layers, the overall data shows that the diameter of crater and the number of layers are correlate.
0 notes