#timeseriesanalysis
Explore tagged Tumblr posts
Text

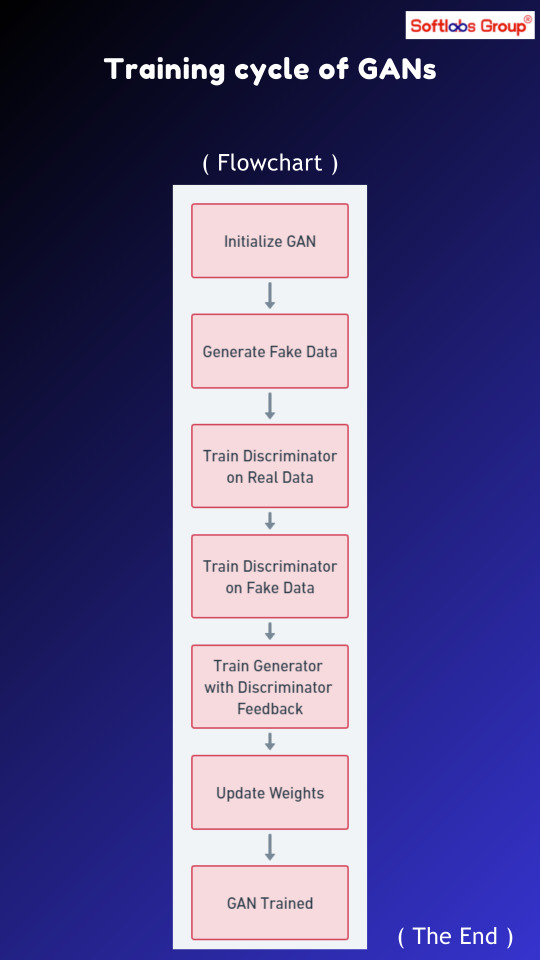
Dive into the dynamic training cycle of Generative Adversarial Networks (GANs) with our comprehensive guide. From inception to convergence, unravel the stages of crafting realistic synthetic data. Simplify your deep learning journey with our expert insights, suitable for both novices and experts. Stay updated with Softlabs Group for more groundbreaking AI revelations!
0 notes
Text
Mastering Date Filtering for Insightful Financial Analysis
#DateFiltering #TimeSeriesAnalysis #PandasLibrary #FinancialAnalysis #StockPerformance Unlock deeper insights into stock performance by mastering date filtering for time series financial data using the Pandas library. Enhance your financial analysis capab
Converting Date Columns to Datetime Objects Mastering Date Filtering. To begin, let’s explore how to convert date columns into datetime objects using the Pandas library. This crucial step ensures your data is in the right format for effective time series analysis. First, we’ll load the Tesla ($TSLA) stock dataset and convert the “Date” column to datetime objects using pd.to_datetime(). import…
0 notes
Photo

Signup for Truepush
https://app.truepush.com/apps
#visitors#wating#timeseriesanalysis#pushyourself#pushnotifications#pushnotification#smartads#messaging#notifications#signuptoday#subscribers#digitalmarketing#digitaladvertisingagency
0 notes
Photo

Statistics for Data Science and Business Analysis.Understand the mechanics of regression analysis.Understand the concepts needed for data science even with Python and R. Check our Info : www.incegna.com Reg Link for Programs : http://www.incegna.com/contact-us Follow us on Facebook : www.facebook.com/INCEGNA/? Follow us on Instagram : https://www.instagram.com/_incegna/ For Queries : [email protected] #datascience,#businessanalysis,#Rprogramming,#python,#Descriptivestatistics,#Inferentialstatistics,#Hypothesistesting,#Regressionanalysis,#visualization,#numpy,#pandas.#businessintelligence,#centrallimittheorem,#machinelearning,#deeplearning,#timeseriesanalysis,#Statisticalanalysis,#GGPlot2 https://www.instagram.com/p/B-MlTURgOtm/?igshid=1w6n0kujzdgj2
#datascience#businessanalysis#rprogramming#python#descriptivestatistics#inferentialstatistics#hypothesistesting#regressionanalysis#visualization#numpy#pandas#businessintelligence#centrallimittheorem#machinelearning#deeplearning#timeseriesanalysis#statisticalanalysis#ggplot2
0 notes
Photo

#SteakAndCheese #FootLong #SubwaySandwich with #WhiteChipMacadamiaCookie before #TimeSeriesAnalysis class by #ThammasatUniversity at #ArtificialIntelligenceAssociationOfThailand (at Subway @ Impact Arena) https://www.instagram.com/p/B0ZwKfwhxaY/?igshid=lanjpo949e1u
#steakandcheese#footlong#subwaysandwich#whitechipmacadamiacookie#timeseriesanalysis#thammasatuniversity#artificialintelligenceassociationofthailand
0 notes
Text

Subscribe here to get Posts and updates on how to improve statistical and causal inference for each individual: statsof1.org/contact 📨📥📫
#nof1 #biostatistics #statistics #statsof1 #nof1stats #causalinference #wearables #epidemiology #digitalhealth #publichealth #timeseries #timeseriesanalysis #esametry #smalldata
3 notes
·
View notes
Text
Time Series is a very useful model when we have an ordered sequence of values of a variable at equally spaced time intervals. In this article, I am interested in using Time Series to analyse price behaviour between January 2010 and May 2018 and perform forecasting to predict prices behaviour for the next 5 years.
For this part of my analysis I am going to be focusing on a very useful method called ARIMA which stands for AutoRegressive Integrated Moving Average. ARIMA is one of the most popular techniques used for time series analysis and forecasting purpose.
R has a function that does the hard job for us, called auto.arima( ) which is an automated way to find the optimized model.
The focus here is analysing the top 6 most expensive counties. Then, we’ll be looking at two counties on the bottom list, and finally, at the overall national level. See top 6 list below:

For a more meaningful analysis I went back to the original dataset on Housing Prices and organized the data by year and by month, calculating the average price of each county using MySQL to query the data.
Next, I have loaded the result dataset into R and used the function filter( ) to select each county.
Since I am dealing with monthly instances, I have selected my frequency at 12, starting point at “2010, 1” (January) and end point at “2018, 5” (May) for all TS models. See model’s process for Dublin below:


We can see from Dickey-Fuller’s test and from the last graph that data is non-stationary and not normally distributed which is what we want to proceed with an AUTO.ARIMA modelling.
Using seasonal decomposition on the following graph we can analyse the observed data versus the trend line, showing an increase over the years. The graph shows also that in fact there is a seasonal frequency reinforcing the monthly prices recorded. The last part shows the Random or Remainder which is the “random” noise in the data.
plot(decompose(tsDub))

Looking closely at the trend line for house prices behaviour over the last 8 years in Dublin is possible to see that despite massive price drop from 2010 to 2013, prices have been dramatically increasing with slight fluctuations.

As mentioned previously, the best way to build our model is using R’s function auto.arima( ) which is automatic way to find the optimized model and does all the adjustments needed to provide the best model.

Note that we set the parameter D=1, which governs seasonal differencing to ensure that seasonality is preserved. (The default NA allows auto.arima() to use or not use seasonality).
Also, note that here I used the parameter “trace” to show all the possible models and to highlight the best one, which is the one with the lowest “AIC”. See output below:
Let’s analyse the outcome:
tsdisplay(residuals(dub.fit), lag.max=45)

We can see a satisfactory white noise at ACF and PACF boxes with the big majority (over 95%) of the lines within the blue lines, indicating that the residuals are behaving like white noise.
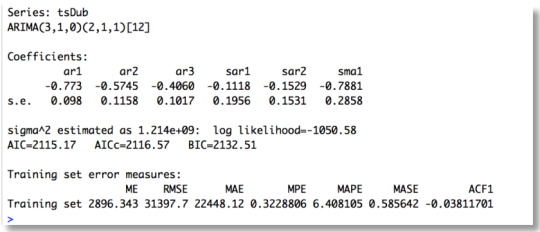
Below we can see that Log Likelihood excluding the minus is sufficiently high, 1050.58, which is what we want. And the values BIC and AIC were the lowest ones of all ARIMA models tested by the auto.arima( ) function.

Validating our model against residuals using Ljung-Box:
We can see that p-values are quite insignificant, meaning that our model is free of auto-correlation which is what we want.
Forecasting the next 5 years:

I have applied the same procedure to model Time series for Wicklow, Cork, Kildare, Galway and Meath (top highest on price list) and for Donegal and Longford (bottom list) as well as on National level. See price behaviour trend line for the last 8 years and 5 years forecasting for each county below:
This slideshow requires JavaScript.
The top 6 counties are showing a dramatic price increase from 2013/2014 until 2018. And 5 years forecast predicts that increases will be continuing to happen.
Counties like Donegal and Longford, however, had a decrease in prices from 2010 to 2014 and despite increase from 2014, prices are half of what it was in 2010, as we can see on their trend line graph, and although we can see some oscillations over the months, prices seem to remain stable for the next 5 years according to their forecast prediction.
At a national level Time Series Forecasts have shown that prices seem far from stabilising. With rents also increasing, it is cheaper to pay a mortgage than rent, however getting mortgage approved is not the problem, but finding a property we can afford certainly is.
Time Series Analysis on Housing prices with future predictions Time Series is a very useful model when we have an ordered sequence of values of a variable at equally spaced time intervals.
0 notes
Link
😀 100% Off 😀 🔰 Time Series Analysis and Forecasting using Python – 100% Free 🔰 🙏 Enroll ASAP #Development #DataScience #TimeSeriesAnalysis #udemycoupon #freeudemycourses #udemy #freecourses #techbachat https://techbachat.in/featured/time-series-analysis-and-forecasting-using-python-100-free/
0 notes
Text

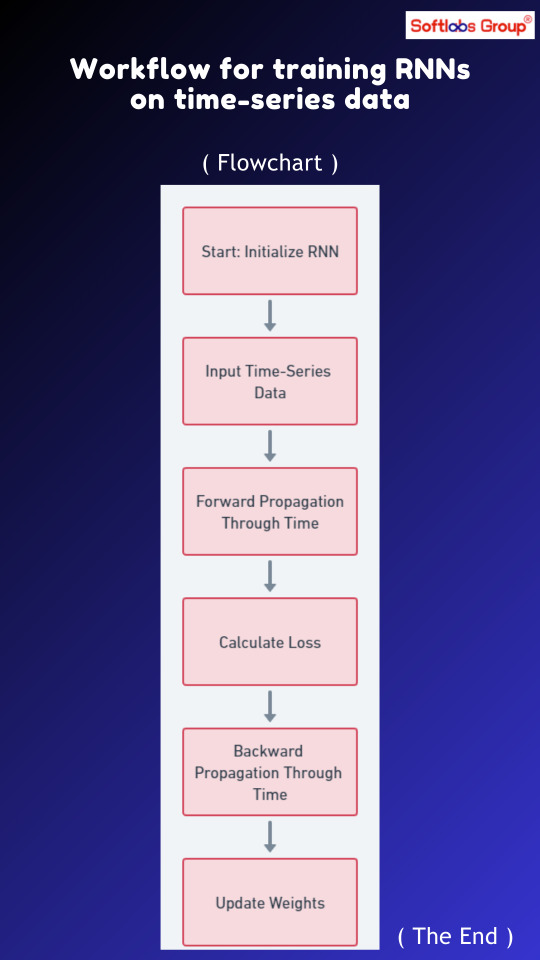
Embark on the journey of training Recurrent Neural Networks (RNNs) for time-series data with our insightful workflow. From data preprocessing to model optimization, unravel the steps in building accurate predictors and decision-makers. Simplify your deep learning endeavors with our guide, suitable for all skill levels. Stay connected with Softlabs Group for more cutting-edge AI insights!
0 notes
Link
😀 100% Off 😀 🔰 Time Series Analysis and Forecasting using Python - 100% Free 🔰 🙏 Enroll ASAP #Development #DataScience #TimeSeriesAnalysis #udemycoupon #freeudemycourses #udemy #freecourses #techbachat https://techbachat.in/featured/time-series-analysis-and-forecasting-using-python-100-free/
0 notes