#ggplot2
Explore tagged Tumblr posts
Visit Tumblr Blog
Explore Tumblr blogs with no restrictions, modern design and the best experience.
Last Seen Tumblr Blogs


Fun Fact
69% of Tumblr users are millennials.
Text
I've been refusing to get into ggplot for several years now and today is the day it's coming back to haunt me. 🥲
#phd#phd student#academia#i need to make pretty plots for my paper manuscript#and all the ones i've used in the past are soooo perfunctory#it's a terrible thing when you're suddenly forced to invest the effort you simply did not want to invest#R#ggplot#ggplot2
17 notes
·
View notes
Text
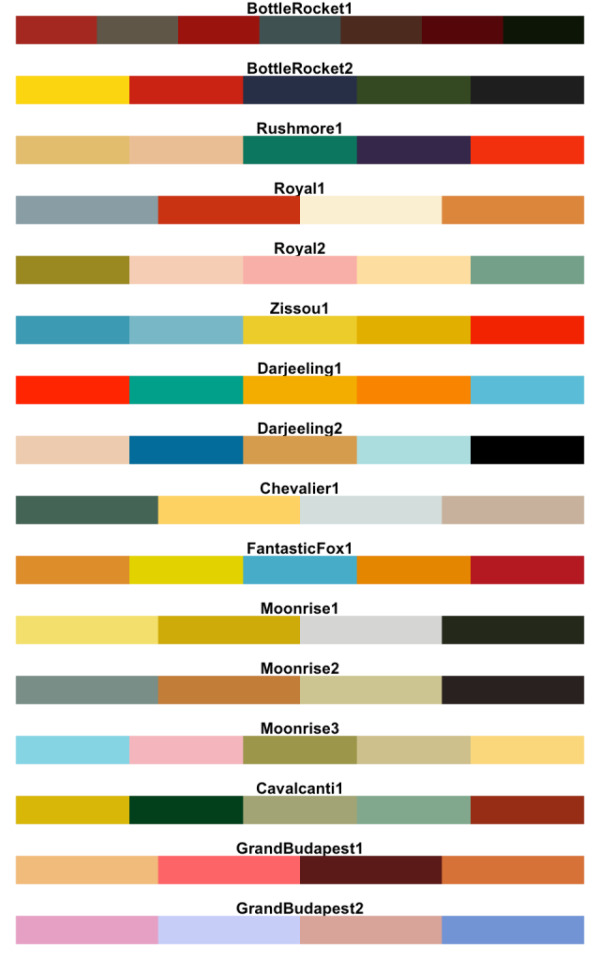
Wes Anderson color palettes

3 notes
·
View notes
Text
0 notes
Text
Unlocking the Power of Data: Essential Skills to Become a Data Scientist

In today's data-driven world, the demand for skilled data scientists is skyrocketing. These professionals are the key to transforming raw information into actionable insights, driving innovation and shaping business strategies. But what exactly does it take to become a data scientist? It's a multidisciplinary field, requiring a unique blend of technical prowess and analytical thinking. Let's break down the essential skills you'll need to embark on this exciting career path.
1. Strong Mathematical and Statistical Foundation:
At the heart of data science lies a deep understanding of mathematics and statistics. You'll need to grasp concepts like:
Linear Algebra and Calculus: Essential for understanding machine learning algorithms and optimizing models.
Probability and Statistics: Crucial for data analysis, hypothesis testing, and drawing meaningful conclusions from data.
2. Programming Proficiency (Python and/or R):
Data scientists are fluent in at least one, if not both, of the dominant programming languages in the field:
Python: Known for its readability and extensive libraries like Pandas, NumPy, Scikit-learn, and TensorFlow, making it ideal for data manipulation, analysis, and machine learning.
R: Specifically designed for statistical computing and graphics, R offers a rich ecosystem of packages for statistical modeling and visualization.
3. Data Wrangling and Preprocessing Skills:
Raw data is rarely clean and ready for analysis. A significant portion of a data scientist's time is spent on:
Data Cleaning: Handling missing values, outliers, and inconsistencies.
Data Transformation: Reshaping, merging, and aggregating data.
Feature Engineering: Creating new features from existing data to improve model performance.
4. Expertise in Databases and SQL:
Data often resides in databases. Proficiency in SQL (Structured Query Language) is essential for:
Extracting Data: Querying and retrieving data from various database systems.
Data Manipulation: Filtering, joining, and aggregating data within databases.
5. Machine Learning Mastery:
Machine learning is a core component of data science, enabling you to build models that learn from data and make predictions or classifications. Key areas include:
Supervised Learning: Regression, classification algorithms.
Unsupervised Learning: Clustering, dimensionality reduction.
Model Selection and Evaluation: Choosing the right algorithms and assessing their performance.
6. Data Visualization and Communication Skills:
Being able to effectively communicate your findings is just as important as the analysis itself. You'll need to:
Visualize Data: Create compelling charts and graphs to explore patterns and insights using libraries like Matplotlib, Seaborn (Python), or ggplot2 (R).
Tell Data Stories: Present your findings in a clear and concise manner that resonates with both technical and non-technical audiences.
7. Critical Thinking and Problem-Solving Abilities:
Data scientists are essentially problem solvers. You need to be able to:
Define Business Problems: Translate business challenges into data science questions.
Develop Analytical Frameworks: Structure your approach to solve complex problems.
Interpret Results: Draw meaningful conclusions and translate them into actionable recommendations.
8. Domain Knowledge (Optional but Highly Beneficial):
Having expertise in the specific industry or domain you're working in can give you a significant advantage. It helps you understand the context of the data and formulate more relevant questions.
9. Curiosity and a Growth Mindset:
The field of data science is constantly evolving. A genuine curiosity and a willingness to learn new technologies and techniques are crucial for long-term success.
10. Strong Communication and Collaboration Skills:
Data scientists often work in teams and need to collaborate effectively with engineers, business stakeholders, and other experts.
Kickstart Your Data Science Journey with Xaltius Academy's Data Science and AI Program:
Acquiring these skills can seem like a daunting task, but structured learning programs can provide a clear and effective path. Xaltius Academy's Data Science and AI Program is designed to equip you with the essential knowledge and practical experience to become a successful data scientist.
Key benefits of the program:
Comprehensive Curriculum: Covers all the core skills mentioned above, from foundational mathematics to advanced machine learning techniques.
Hands-on Projects: Provides practical experience working with real-world datasets and building a strong portfolio.
Expert Instructors: Learn from industry professionals with years of experience in data science and AI.
Career Support: Offers guidance and resources to help you launch your data science career.
Becoming a data scientist is a rewarding journey that blends technical expertise with analytical thinking. By focusing on developing these key skills and leveraging resources like Xaltius Academy's program, you can position yourself for a successful and impactful career in this in-demand field. The power of data is waiting to be unlocked – are you ready to take the challenge?
3 notes
·
View notes
Text
Data Visualization: Transforming Data into Insight
In an technology wherein information is produced at an remarkable tempo, the ability to extract significant insights is extra vital than ever. Data visualization plays a vital function on this procedure, enabling individuals and corporations to understand complex statistics sets, pick out trends, and communicate findings effectively. By converting abstract numbers into intuitive visuals, information visualization bridges the gap among uncooked data and human cognition, turning complexity into readability.
Data Visualization In Research

The Importance of Data Visualization
Data visualization is the graphical illustration of information and facts. By the use of visible elements like charts, graphs, and maps, statistics visualization tools make it less difficult to see and understand styles, trends, and outliers in facts. Its importance lies in numerous key areas:
Improved Understanding: Visuals are processed 60,000 times faster than textual content by way of the human mind. Graphs and charts can screen insights that would pass omitted in spreadsheets.
Enhanced Communication: Well-crafted visualizations allow statistics to be shared in a manner that’s available to a broader audience, no longer simply records analysts or statisticians.
Data-Driven Decision Making: In enterprise, governments, and medical research, visualizations support selection-making via without a doubt showing the implications of various statistics tendencies.
Pattern and Anomaly Detection: They help users quick become aware of deviations, spikes, or drops in data, which could suggest possibilities or threats.
Types of Data Visualization
Data visualization encompasses a big selection of techniques, each applicable to precise types of records and analytical desires. Some of the most commonly used sorts include:
1. Bar Charts
Bar charts are best for comparing quantities throughout classes. They are simple however effective for displaying differences among agencies.
2. Line Graphs
Often used to music changes over time, line graphs display tendencies and fluctuations, making them a fave for time-series information.
3. Pie Charts
They’re satisfactory for simple, clear percent facts.
4. Histograms
Histograms display the distribution of a dataset, making them beneficial for understanding records spread, crucial tendency, and frequency.
5. Heat Maps
Heat maps use colour gradients to indicate value depth throughout two dimensions.
6. Scatter Plots
Scatter plots are used to pick out relationships between variables, often revealing correlations or clusters in facts.
7. Box Plots
Box plots show the distribution of a dataset thru its quartiles, highlighting medians, variability, and ability outliers.
8. Geospatial Maps
These visualizations display facts associated with geographic regions and are extensively utilized in demographic research, environmental tracking, and logistics.
9. Dashboards
Dashboards integrate multiple visualizations into one interface, supplying a actual-time assessment of key metrics and overall performance signs.
Tools for Data Visualization
A huge range of tools is to be had for growing effective statistics visualizations. Popular alternatives encompass:
Tableau: A leading platform for interactive, shareable dashboards with drag-and-drop functions.
Power BI: Microsoft's enterprise analytics tool with sturdy integration into the Office atmosphere.
Google Data Studio: A unfastened tool for developing customizable reports the use of Google records sources.
Ggplot2: A effective R package for constructing state-of-the-art plots the use of the grammar of snap shots.
Each device gives distinctive competencies depending at the user’s technical information, information complexity, and desired results.
Best Practices in Data Visualization
Creating effective facts visualizations requires more than just technical skill. It includes an information of design ideas, cognitive psychology, and storytelling. Here are key exceptional practices:
1. Know Your Audience
Tailor the visualization to the information stage and pursuits of your target market. What a statistics scientist unearths intuitive is probably complicated to a business executive.
2. Choose the Right Chart
Using an inappropriate chart kind can deceive or confuse the viewer. For instance, a line chart ought to not be used for specific information.
Three. Simplify and Clarify
Avoid muddle. Focus on essential statistics and put off unnecessary elements like immoderate gridlines, decorative snap shots, or redundant labels.
Four. Use Color Thoughtfully
Color can enhance know-how but additionally lie to if used improperly. Stick to a consistent color scheme and use contrasts to highlight key points.
5. Tell a Story
Effective facts visualizations guide the viewer through a story. Highlight tendencies, anomalies, or correlations that support your message.
6. Maintain Integrity
Never manipulate axes or distort scales to magnify findings. Ethical visualization ensures accurate illustration of statistics.
Real-World Applications
Data visualization is applied in nearly each region, transforming industries through stepped forward insight and communication.
1. Business Analytics
In commercial enterprise, visualization tools assist in monitoring sales, client behavior, supply chain efficiency, and extra.
2. Healthcare
In medicinal drug and public health, visualizations are crucial for tracking disorder outbreaks, affected person records, and treatment results. For example, COVID-19 dashboards performed a main function in information the pandemic's unfold.
3. Finance
Financial analysts use records visualization to recognize market tendencies, examine investment overall performance, and check chance.
Four. Education
Educators and researchers use visualization to track pupil performance, perceive mastering gaps, and gift studies findings.
Five. Government and Policy
Policymakers use visible facts to understand social trends, aid allocation, and financial overall performance.
6. Journalism
Data journalism is growing hastily. Visual stories on topics like weather change, election results, or social inequality use charts and infographics to inform and engage readers.
Challenges and Limitations
Despite its electricity, facts visualization isn't with out demanding situations:
Data Quality: Inaccurate or incomplete information can lead to deceptive visuals.
Over-Simplification: Trying to make information too easy can lead to lack of nuance or important info.
Misinterpretation: Poor design selections or biased displays can cause audiences to draw wrong conclusions.
Tool Limitations: Not all equipment aid the extent of customization or interactivity wished for unique projects.
Overcoming these demanding situations requires a mix of technical talent, area information, and moral responsibility.
The Future of Data Visualization
The future of statistics visualization is increasingly interactive, actual-time, and AI-assisted. Emerging traits include:
Augmented and Virtual Reality (AR/VR): Immersive visualizations permit users to explore records in three-dimensional environments.
Machine Learning Integration: Algorithms can now endorse or even vehicle-generate visualizations based on the information furnished.
Collaborative Platforms: Teams can now work collectively in actual time on visualization dashboards, improving communique and agility.
These advancements will hold to make records greater accessible and insightful throughout all domain names.
Difference Between Augmented Reality (AR) and Virtual Reality (VR)
What Is Data Analysis In Research
2 notes
·
View notes
Text
Exploring Data Science Tools: My Adventures with Python, R, and More
Welcome to my data science journey! In this blog post, I'm excited to take you on a captivating adventure through the world of data science tools. We'll explore the significance of choosing the right tools and how they've shaped my path in this thrilling field.
Choosing the right tools in data science is akin to a chef selecting the finest ingredients for a culinary masterpiece. Each tool has its unique flavor and purpose, and understanding their nuances is key to becoming a proficient data scientist.
I. The Quest for the Right Tool
My journey began with confusion and curiosity. The world of data science tools was vast and intimidating. I questioned which programming language would be my trusted companion on this expedition. The importance of selecting the right tool soon became evident.
I embarked on a research quest, delving deep into the features and capabilities of various tools. Python and R emerged as the frontrunners, each with its strengths and applications. These two contenders became the focus of my data science adventures.
II. Python: The Swiss Army Knife of Data Science
Python, often hailed as the Swiss Army Knife of data science, stood out for its versatility and widespread popularity. Its extensive library ecosystem, including NumPy for numerical computing, pandas for data manipulation, and Matplotlib for data visualization, made it a compelling choice.
My first experiences with Python were both thrilling and challenging. I dove into coding, faced syntax errors, and wrestled with data structures. But with each obstacle, I discovered new capabilities and expanded my skill set.
III. R: The Statistical Powerhouse
In the world of statistics, R shines as a powerhouse. Its statistical packages like dplyr for data manipulation and ggplot2 for data visualization are renowned for their efficacy. As I ventured into R, I found myself immersed in a world of statistical analysis and data exploration.
My journey with R included memorable encounters with data sets, where I unearthed hidden insights and crafted beautiful visualizations. The statistical prowess of R truly left an indelible mark on my data science adventure.
IV. Beyond Python and R: Exploring Specialized Tools
While Python and R were my primary companions, I couldn't resist exploring specialized tools and programming languages that catered to specific niches in data science. These tools offered unique features and advantages that added depth to my skill set.
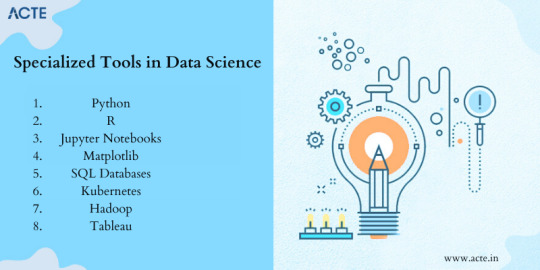
For instance, tools like SQL allowed me to delve into database management and querying, while Scala opened doors to big data analytics. Each tool found its place in my toolkit, serving as a valuable asset in different scenarios.
V. The Learning Curve: Challenges and Rewards
The path I took wasn't without its share of difficulties. Learning Python, R, and specialized tools presented a steep learning curve. Debugging code, grasping complex algorithms, and troubleshooting errors were all part of the process.
However, these challenges brought about incredible rewards. With persistence and dedication, I overcame obstacles, gained a profound understanding of data science, and felt a growing sense of achievement and empowerment.
VI. Leveraging Python and R Together
One of the most exciting revelations in my journey was discovering the synergy between Python and R. These two languages, once considered competitors, complemented each other beautifully.
I began integrating Python and R seamlessly into my data science workflow. Python's data manipulation capabilities combined with R's statistical prowess proved to be a winning combination. Together, they enabled me to tackle diverse data science tasks effectively.
VII. Tips for Beginners
For fellow data science enthusiasts beginning their own journeys, I offer some valuable tips:
Embrace curiosity and stay open to learning.
Work on practical projects while engaging in frequent coding practice.
Explore data science courses and resources to enhance your skills.
Seek guidance from mentors and engage with the data science community.
Remember that the journey is continuous—there's always more to learn and discover.
My adventures with Python, R, and various data science tools have been transformative. I've learned that choosing the right tool for the job is crucial, but versatility and adaptability are equally important traits for a data scientist.
As I summarize my expedition, I emphasize the significance of selecting tools that align with your project requirements and objectives. Each tool has a unique role to play, and mastering them unlocks endless possibilities in the world of data science.
I encourage you to embark on your own tool exploration journey in data science. Embrace the challenges, relish the rewards, and remember that the adventure is ongoing. May your path in data science be as exhilarating and fulfilling as mine has been.
Happy data exploring!
22 notes
·
View notes
Text
How do I learn R, Python and data science?
Learning R, Python, and Data Science: A Comprehensive Guide
Choosing the Right Language
R vs. Python: Both R and Python are very powerful tools for doing data science. R is usually preferred for doing statistical analysis and data visualisations, whereas Python is much more general and currently is very popular for machine learning and general-purpose programming. Your choice of which language to learn should consider your specific goals and preferences.
Building a Strong Foundation
Structured Courses Online Courses and Tutorials: Coursera, edX, and Lejhro offer courses and tutorials in R and Python for data science. Look out for courses that develop theoretical knowledge with practical exercises. Practise your skills with hands-on coding challenges using accompanying datasets, offered on websites like Kaggle and DataCamp.
Books: There are enough books to learn R and Python for data science. You may go through the classical ones: "R for Data Science" by Hadley Wickham, and "Python for Data Analysis" by Wes McKinney.
Learning Data Science Concepts
Statistics: Know basic statistical concepts: probability, distribution, hypothesis testing, and regression analysis.
Cleaning and Preprocessing: Learn how to handle missing data techniques, outliers, and data normalisation.
Data Visualization: Expert libraries to provide informative visualisations, including but not limited to Matplotlib and Seaborn in Python and ggplot2 in R.
Machine Learning: Learn algorithms-Linear Regression, Logistic Regression, Decision Trees, Random Forest, Neural Networks, etc.
Deep Learning: Study deep neural network architecture and how to build and train them using the frameworks TensorFlow and PyTorch.
Practical Experience
Personal Projects: In this, you apply your knowledge to personal projects which help in building a portfolio.
Kaggle Competitions: Participate in Kaggle competitions to solve real-world problems in data science and learn from others.
Contributions to Open-Source Projects: Contribute to some open-source projects for data science in order to gain experience and work with other people.
Other Advice
Join Online Communities: Join online forums or communities such as Stack Overflow and Reddit to ask questions, get help, and connect with other data scientists.
Attend Conferences and Meetups: This is a fantastic way to network with similar working professionals in the field and know the latest trends going on in the industry.
Practice Regularly: For becoming proficient in data science, consistent practice is an indispensable element. Devote some time each day for practising coding challenges or personal projects.
This can be achieved by following the above-mentioned steps and having a little bit of dedication towards learning R, Python, and Data Science.
2 notes
·
View notes
Text
"(.. density..) WaS DePrEcAtEd In GgPlOt2 3.4.0" then why's it still work fuckass. Shut the fuck up.
4 notes
·
View notes
Text
Dragged kicking and screaming and crying into R Studio and then starts playing with ggplot2 and becomes pacified like a dog with a bone
5 notes
·
View notes
Text
youtube
0 notes
Text
Embarking on the Odyssey of Data Science Mastery: A Comprehensive 8-Step Guide
Navigating the dynamic waters of data science requires a combination of technical acumen and analytical finesse. This comprehensive guide unfolds an 8-step roadmap, not just to become a data scientist but to master the intricate art and science that defines this dynamic field.

1. Building a Sturdy Mathematical Foundation: The Pillars of Understanding
Embark on your journey with a laser focus on constructing a formidable foundation in fundamental mathematical principles, probability theory, and statistics. This foundational knowledge serves as the bedrock upon which you'll interpret data and seamlessly implement statistical models with precision.
2. Mastering Programming Languages: The Data Scientist's Linguistic Proficiency
In the vast toolkit of a data scientist, mastery in a programming language is key. Delve into the intricacies of Python or R, navigating the landscape of data manipulation libraries like Pandas or data.table. These tools become your allies in handling large datasets with finesse.
3. Navigating Data Analysis Libraries: Unleashing the Power of Manipulation
With programming proficiency comes the need to manipulate and analyze data efficiently. This is where libraries like Pandas (Python) and dplyr (R) shine. Pandas, known for its ease of use, provides data structures and functions needed to manipulate structured data seamlessly, while dplyr simplifies data manipulation in R.
4. Crafting Visual Narratives: The Art of Data Visualization
Transforming complex insights into compelling visual narratives is the hallmark of a skilled data scientist. Immerse yourself in the world of data visualization tools such as Matplotlib, Seaborn, or ggplot2. Through mastery of these tools, your analytical findings metamorphose into visually striking stories.
5. Navigating the Landscape of Machine Learning Basics: Algorithms as Your Guide
Machine learning (ML) is the heart of data science. Start with the basics – linear regression, logistic regression, and classification algorithms. Platforms like Scikit-Learn (Python) and caret (R) provide practical implementations. A solid grasp of the fundamentals empowers you to tackle a myriad of real-world problems.
6. Bridging Theory and Practice: The Power of Hands-On Projects
Theoretical knowledge gains potency when applied. Platforms like Kaggle provide datasets and competitions, allowing you to test your skills in a real-world context. Building a portfolio of projects showcases your skills to potential employers and collaborators.
7. Structured Learning Paths: The Guiding Compass of Online Courses
The world of data science is vast, and structured courses can act as your compass. Platforms like Coursera, edX, and Udacity offer courses tailored to various aspects of data science. These courses provide not just theoretical knowledge but hands-on experience, ensuring a well-rounded education.
8. Learning Together: The Vibrant Tapestry of Community Engagement
Data science is not a solitary pursuit. Engage with the community. Platforms like Stack Overflow, Reddit (r/datascience), and GitHub offer spaces to ask questions, share insights, and learn from experienced practitioners. Actively participating in the data science community exposes you to the latest trends, tools, and best practices.
Conclusion: A Journey of Continuous Discovery Embarking on the data science odyssey is not a sprint; it's a marathon of continuous learning. Each step in this guide is a stepping stone, guiding you through the intricate landscape of data science. As you navigate through the sea of data, may your curiosity be your compass, and may the insights you unearth become beacons of knowledge in the vast realm of data science. Best of luck on your journey!
#data science course#datascience#technology#data science certification#data science training#tech#education
4 notes
·
View notes
Text
tumblr poll results are often misleading for polls that involve more than one variable
my mission is to create representations of data collected in tumblr polls that allow the data to be interpreted meaningfully, and to improve statistical literacy on this website.
if you’re like me, you’ve probably looked at polls interrogating more than one variable, you know, ones like this:
Q: ARE YOU WEARING PANTS RIGHT NOW?
OPTION 1: Yes, and I’m a horse that uses tumblr - 0.1%
OPTION 2: No, and I’m a horse that uses tumblr - 0.7%
OPTION 3: Yes, and I’m a human - 69%
OPTION 4: No, and I’m a human - 30.2%
and thought to yourself, “man, a bar chart without any kind of normalization is a super confusing and possibly misleading way to represent these data.” or maybe that’s just me.
I feel strongly about good data viz, and I started doing this for myself because I was curious how certain poll results would look if the data were represented better. this is (mostly) a lighthearted blog.
if I reblog your poll and you want my reblog deleted, tell me via the ask box and I’ll delete it—but you need to provide a reason (“this poll was a joke” is a perfectly valid reason, as is “I don’t like your vibe”—you just have to tell me something). this is because lack of statistical literacy and bad data representation being seen by large swaths of young impressionable tumblr users genuinely concerns me a little bit. please note (before you, poll creator, get offended) that tumblr’s polling system is at fault here, not you, poll creator, trying to collect information with a very limited data collection tool.
you can submit polls you want interpretation for and I’ll do my best. rules for submitting polls:
the poll doesn’t have to have closed, but I won’t interpret the data until the poll closes. for obvious reasons.
you can submit joke polls, but I will treat them the same as any other poll.
some polls are formulated in such a way that makes the data collected inherently uninterpretable. if you submit a poll that I feel is uninterpretable, I will say so. don’t get mad, it’s my opinion.
please DO NOT submit polls from fandom-oriented poll blogs (character tournaments, the like). I just don’t care and don’t want to get caught up in drama surrounding those sorts of things.
about the mod: I’m an adult. mid 20s. my pronouns are he/him. I am white, transgender, autistic, and queer. I’m a biologist, which is a field with a serious data misinterpretation and misrepresentation problem, which is why I’ve got this big ass chip on my shoulder.
I do data viz in R using ggplot2, which is overkill for this application, but it’s fun for me, and stupid easy to crank out plots. I’ll publish all code I write for this blog. Learn R! She’s open source! She’s kinda wacky and illogical sometimes as a result but we love her!
no terf shit. no racist shit. no cop shit. no zionists. kill yourselves and go to hell. will do my best to check OPs for these things but if I reblog a poll made by someone who falls into any of these categories please let me know ASAP so I can delete and block.
6 notes
·
View notes
Text
Unlock the World of Data Analysis: Programming Languages for Success!
�� When it comes to data analysis, choosing the right programming language can make all the difference. Here are some popular languages that empower professionals in this exciting field
https://www.clinicalbiostats.com/
🐍 Python: Known for its versatility, Python offers a robust ecosystem of libraries like Pandas, NumPy, and Matplotlib. It's beginner-friendly and widely used for data manipulation, visualization, and machine learning.
📈 R: Built specifically for statistical analysis, R provides an extensive collection of packages like dplyr, ggplot2, and caret. It excels in data exploration, visualization, and advanced statistical modeling.
🔢 SQL: Structured Query Language (SQL) is essential for working with databases. It allows you to extract, manipulate, and analyze large datasets efficiently, making it a go-to language for data retrieval and management.
💻 Java: Widely used in enterprise-level applications, Java offers powerful libraries like Apache Hadoop and Apache Spark for big data processing. It provides scalability and performance for complex data analysis tasks.
📊 MATLAB: Renowned for its mathematical and numerical computing capabilities, MATLAB is favored in academic and research settings. It excels in data visualization, signal processing, and algorithm development.
🔬 Julia: Known for its speed and ease of use, Julia is gaining popularity in scientific computing and data analysis. Its syntax resembles mathematical notation, making it intuitive for scientists and statisticians.
🌐 Scala: Scala, with its seamless integration with Apache Spark, is a valuable language for distributed data processing and big data analytics. It combines object-oriented and functional programming paradigms.
💪 The key is to choose a language that aligns with your specific goals and preferences. Embrace the power of programming and unleash your potential in the dynamic field of data analysis! 💻📈
#DataAnalysis#ProgrammingLanguages#Python#RStats#SQL#Java#MATLAB#JuliaLang#Scala#DataScience#BigData#CareerOpportunities#biostatistics#onlinelearning#lifesciences#epidemiology#genetics#pythonprogramming#clinicalbiostatistics#datavisualization#clinicaltrials
4 notes
·
View notes
Text
Data Science Demystified: Your Guide to a Career in Analytics After Computer Training

For the technology era, data lives everywhere-from your daily social media scroll to intricate financial transactions. Raw data is just numbers and alphabets; Data Science works behind the scenes to transform it into actionable insight that leads to business decisions, technological advances, or even social changes. If you've finished your computer training and want to undertake a career that offers challenges alongside rewards, then the data-science-and-analytics lane would be just perfect for you.
At TCCI- Tririd Computer Coaching Institute, we have seen the rise of data skills. Our computer classes in Ahmedabad build the foundation; our Data Science course in Ahmedabad is then taught to take students from beginner-level computer knowledge to an extremely high-demand career in analytics.
So what is data science? And how could you start your awesome journey? Time to demystify!
What is Data Science, Really?
Imagine a wide ocean of information. The Data Scientist is a skilled navigator using a mixture of statistics, programming, and domain knowledge to:
Collect and Clean Data: Gather information from various sources and prepare it for its analysis (sometimes preparing data takes as much as 80% of the actual work!).
Analyze: Use statistical methods and machine learning algorithms to find common patterns, occurrences, and co-relations.
Interpret Results: Translate very complex results into understandable insights for business purposes.
Communicate: Tell a story with data through visualization, giving decision-makers the information they need to confidently take action.
It is the multidisciplinary field comprising computer science, engineering, mathematics, and business know-how.
Key Skills You'll Need for a Career in Data Analytics
Your computer training is, to begin with, a wonderful advantage. Let's analyze the specific set of skills you will develop on this foundation:
1. Programming (Python & R):
Python: The principal language used by data scientists, with its rich ecosystem of libraries (like Pandas, NumPy, Scikit-learn, TensorFlow, Keras) used for tasks involving data wrangling, data analysis, and machine-learning researchers.
R: Favorited among statisticians for strong statistical modeling and fine capabilities in data visualization.
This is where your basic programming from computer classes will come into good use.
2. Statistics and Mathematics:
Things like defining and understanding probability, hypothesis testing, regression, and statistical modeling are what permit you to get to an interpretation of the data.
It's here that the analytical thinking learned in your computer training course will be useful.
3. Database Management (SQL):
Structured Query Language (SQL) is the language you will use to query and manipulate data stored in relational databases to extract relevant data for analysis.
4. Machine Learning Fundamentals:
Understanding algorithms such as linear regression, decision trees, clustering, and neural networks in order to develop predictive models and search for patterns.
5. Visualization of Data:
Using tools such as Matplotlib and Seaborn in Python; ggplot2 in R; Tableau; or Power BI for building compelling charts and graphs that convey complex insights in straightforward terms.
6. Domain Knowledge & Business Acumen:
One must understand the domain or business context in question to be able to ask the right questions and interpret data meaningfully.
7. Communication & Problem Solving:
The capability of communicating complex technical findings to non-technical stakeholders is paramount. Data scientists are basically storytellers with data.
Your Journey: From Computer Training to Data Science Success
If you've completed foundational computer training, then you've already taken a first step! You might have:
Logical thinking and problem-solving skills.
Some knowledge of the programming basics.
Some knowledge of the operating systems or software.
A Data Science course will then build on this knowledge by introducing you to statistical concepts, advanced programming for data, machine learning algorithms, and visualization tools.
Promising Career Paths in Data Science & Analytics
A career in data science isn't monolithic. Here are some roles you could pursue:
Data Scientist: The all-rounder, involved in the entire data lifecycle from collection to insight.
Data Analyst: Focuses on interpreting existing data to answer specific business questions.
Machine Learning Engineer: Specializes in building and deploying machine learning models.
Business Intelligence (BI) Developer: Creates dashboards and reports to help businesses monitor performance.
Big Data Engineer: Builds and maintains the large-scale data infrastructures.
Why TCCI is Your Ideal Partner for a Data Science Course in Ahmedabad
The Data Science course at TCCI, for data professionals aspiring to grow in Ahmedabad, follows a very comprehensive and industry-relevant syllabus for maximum real-world impact.
Expert Faculty: Instructors who have had extensive real-time experience in the data science and analytics environment themselves conduct classes.
Hands-On Projects: Building portfolios with a sprinkle of practice exercises and real-world case studies is in the curriculum.
Industry-Relevant Tools: Be it Python, R, or SQL along with other trending tools for data visualization.
Career Guidance & Placement Support: Career counseling and placement assistance will be an end-to-end process whereby the trainee will be positioned in their dream job.
Data Science Course in Ahmedabad with a Difference-Fresh Updates to the Curriculum All the Time- Most Relevant and In-Demand Skills for Earning.
Data Science is one booming thing, opening myriad possibilities to whoever possesses the requisite skill set. Right here in Ahmedabad is where your journey of new data specialists begins.
Ready to transform your computer skills into a rewarding career in Data Science?
Contact us
Location: Bopal & Iskcon-Ambli in Ahmedabad, Gujarat
Call now on +91 9825618292
Visit Our Website: http://tccicomputercoaching.com/
#DataScience#DataAnalytics#CareerInTech#AhmedabadTech#TCCIDataScience#LearnDataScience#FutureReady#ComputerTraining#TCCI
0 notes