#webgrinder
Explore tagged Tumblr posts
Visit Tumblr Blog
Explore Tumblr blogs with no restrictions, modern design and the best experience.
Last Seen Tumblr Blogs


Fun Fact
In 2020, 44% of users from Denmark used Tumblr daily.
Text
Not gonna lie, I'm a slacking old geezer at heart. I've created this blog last year because a friend of mine told me tumblr is more chill than other socials about posting frequency and whatnot.
However I have decided to challenge myself to finish 3 pieces per month at minimum and it seems I've done it in February. Although I will not post all the things I do I hope this will help me get a wee bit more consistent with The Internet Webgrind(TM).
Than again, I believe beating my head in for not upholding this standard would be counterproductive in the long run, so I won't be hard on myself if I get cursed by my own will again. No one is gonna die for that
That's all. I hope you all have a nice month of May, remember to set realistic goals for yourselves and to have patience with your skills
0 notes
Link
Scrape product listing data step by step using #Webgrinder. Extract product images, product name, price, discount and availability.
#artificial intelligence#datascience#webscraping#webcrawling#webgrinder#product listing#tesco#technology
0 notes
Text
Xdebug Chrome

Xdebug is an extension for debugging your PHP. The following explains how to configure Xdebug and PhpStorm to debug in your local environment. You can use the IDE of your choice. See the vendor documentation for those applications for further configuration information.
Xdebug Helper
Xdebug Chrome Extension
Chrome Xdebug Not Working
Xdebug Chrome How To Use
You will surely like this chrome extension if you love debugging, profiling and tracing PHP code with Xdebug. It comes handy for PHP developers that loves using PHP tools with Xdebug support like PHPStorm, Eclipse with PDT, Netbeans and MacGDBp or any other Xdebug compatible profiling tool like KCacheGrind, WinCacheGrind or Webgrind. Enabling XDEBUG in Web Browsers Chrome. There are two really useful plugins for Chrome that you should install: XDEBUG Helper- This will enable you to turn XDEBUG on and off from your web browser without having to modify the URL. This is essential when debugging a POST type form submission where you can't just enter a URL.
You can configure Xdebug to run in the Magento Cloud Docker environment for local debugging without changing your Magento Commerce Cloud project configuration. See Configure Xdebug for Docker.
To set up Xdebug, you need to configure a file in your Git repository, configure your IDE, and set up port forwarding. You can configure settings in the magento.app.yaml file. After editing, you can push the Git changes across all Starter environments and Pro Integration environments to enable Xdebug. To push these settings to Pro plan Staging and Production environments, you must enter a ticket.
Once configured, you can debug CLI commands, web requests, and code. Remember, all Magento Commerce Cloud environments are read-only. You need to pull code to your local development environment to perform debugging. For Pro Staging and Production environments, we include additional instructions for Xdebug.
Requirements
To run and use Xdebug, you need the SSH URL for the environment. You can locate the information through the Project Web Interface or your Cloud Onboarding UI.
Configure Xdebug
To configure Xdebug, you need to do the following:
Work in a branch to push file updates
Configure your IDE, like PhpStorm
For configuring on Pro plan Staging and Production, you need to enter a ticket for Staging and Production.
Get started with a branch
To add Xdebug, we recommend creating a branch to work in and add the files.

To get started with environment branches:
On your local workstation, change to your Cloud project directory.
Switch to the Magento file system owner.
Log in to your Magento project.
List your projects.
List environments in the project. Every environment includes an active Git branch that contains your code, database, environment variables, configurations, and services.
It is important to use the magento-cloud environment:list command because it displays environment hierarchies, whereas the git branch command does not.
Fetch origin branches to get the latest code.
Checkout, or switch to, a specific branch and environment.
Git commands only checkout the Git branch. The magento-cloud checkout command checks out the branch and switches to the active environment.
You can create a new environment branch using the magento-cloud environment:branch <environment-name> <parent-environment-ID> command syntax. It may take some additional time to create and activate a new environment branch.
Use the environment ID to pull any updated code to your local. This is not necessary if the environment branch is new.
(Optional) Create a snapshot of the environment as a backup.
Enable Xdebug in your environment
To enable Xdebug for your project, add xdebug to the runtime:extensions section of the .magento.app.yaml file.
You can enable Xdebug directly to all Starter environments and Pro Integration environments. For Pro Staging and Production, you need to update this file and enter a Support ticket to have it enabled. We enable Xdebug on those environments for you.
To enable Xdebug:
In your local terminal, open the .magento.app.yaml file in a text editor.
In the runtime section, under extensions, add xdebug. For example:
Save your changes to the .magento.app.yaml file and exit the text editor.
Add, commit, and push the changes to redeploy the environment.
When deployed to Starter environments and Pro Integration environments, Xdebug is now available. You should continue configuring your IDE. For PhpStorm, see Configure PhpStorm.
Configure PhpStorm
You need to configure PhpStorm to properly work with Xdebug.
To configure PhpStorm to work with Xdebug:
In your PhpStorm project, open the settings panel.
Mac OS X—Select PhpStorm > Preferences.
Windows/Linux—Select File > Settings.
In the Settings panel, expand and locate the Languages & Frameworks > PHP > Servers section.
Click the + to add a server configuration. The project name is in grey at the top.
Configure the following settings for the new server configuration:
Name—enter the same as the hostname. This value is used in and must match the value for PHP_IDE_CONFIG variable in Debug CLI commands.
Host—Enter localhost.
Port—Enter 80.
Debugger—Select Xdebug.
Select Use path mappings. In the File/Directory pane, the root of the project for the serverName displays.
In the Absolute path on the server column, click (Edit) and add a setting based on the environment:
For all Starter environments and Pro Integration environments, the remote path is /app.
For Pro Staging and Production environments:
Production: /app/<project_code>/
Staging: /app/<project_code>_stg/
Change the Xdebug port to 9000 in the Languages & Frameworks > PHP > Debug > Xdebug > Debug Port panel.
Click Apply.
Set up port forwarding
You must map the XDEBUG connection from the server to your local system. To do any type of debugging, you must forward port 9000 from your Magento Commerce Cloud server to your local machine. See one of the following sections:
Port forwarding on Mac or UNIX
To set up port forwarding on a Mac or in a Unix environment:
Open a terminal.
Use SSH to establish the connection.
Add the -v option to the SSH command to show in the terminal whenever a socket is connected to the port that is being forwarded.
If an “unable to connect” or “could not listen to port on remote” error is displayed, there could be another active SSH session persisting on the server that is occupying port 9000. If that connection isn’t being used, you can terminate it.
To troubleshoot the connection:
Use SSH to log in to the remote Integration, Staging, or Production environment.
Enter who to view a list of SSH sessions.
View existing SSH sessions by user. Be careful to not affect a user other than yourself!
Integration: usernames are similar to dd2q5ct7mhgus
Staging: usernames are similar to dd2q5ct7mhgus_stg
Production: usernames are similar to dd2q5ct7mhgus
For a user session that is older than yours, find the pseudo-terminal (PTS) value, such as pts/0.
Kill the process ID (PID) corresponding to the PTS value.
Sample response:
To terminate the connection, enter a kill command with the process ID (PID).
Port forwarding on Windows
To set up port forwarding (SSH tunneling) on Windows, you must configure your Windows terminal application. For this example, we walk through creating an SSH tunnel using Putty. You can use other applications such as Cygwin. For more information on other applications, see the vendor documentation provided with those applications.
To set up an SSH tunnel on Windows using Putty:
If you have not already done so, download Putty.
Start Putty.
In the Category pane, click Session.
Enter the following information:
Hostname (or IP address) field: Enter the SSH URL for your Cloud server
Port field: Enter 22
In the Category pane, click Connection > SSH > Tunnels.
Enter the following information:
Source port field: Enter 9000
Destination field: Enter 127.0.0.1:9000
Click Remote
Click Add.
In the Category pane, click Session.
In the Saved Sessions field, enter a name for this SSH tunnel.
Click Save.
To test the SSH tunnel, click Load, then click Open.
If an “unable to connect” error displays, verify all of the following:
All Putty settings are correct
You are running Putty on the machine on which your private Magento Commerce Cloud SSH keys are located
Configure Pro Staging and Production
To complete configuration for Pro plan Staging and Production environments, you must enter a Support ticket to have Xdebug enabled and configured in Staging and Production environments.
We enable Xdebug in the environment. Be aware that this is a configuration change that requires us to redeploy your Staging and Production environments.
SSH access to Xdebug environments
For initiating debugging, performing setup, and more, you need the SSH commands for accessing the environments. You can get this information, through the Project Web Interface and your project spreadsheet.
Xdebug Helper
For Starter environments and Pro Integration environments, you can use the following Magento Cloud CLI command to SSH into those environments:
To use Xdebug, SSH to the environment as follows:
For example,
Debug for Pro Staging and Production
To use Xdebug specifically on Pro plan Staging and Production environment, you create a separate SSH tunnel and web session only you have access to. This usage differs from typical access, only providing access to you and not to all users.

You need the following:
SSH commands for accessing the environments. You can get this information, through the Project Web Interface or your Cloud Onboarding UI.
The xdebug_key value we set when configuring the Staging and Pro environments
To set up an SSH tunnel to a Staging or Production environment:
Open a terminal.
Clean up all SSH sessions.
Set up the SSH tunnel for Xdebug.
To start debugging using the environment URL:
To enable remote debugging, visit the site in the browser with the following added to the URL where KEY is value for xdebug_key:
This sets the cookie that sends browser requests to trigger Xdebug.
Complete your debugging with Xdebug.
When you are ready to end the session, you can use the following command to remove the cookie and end debugging through the browser where KEY is value for xdebug_key:
The XDEBUG_SESSION_START passed by POST requests are not supported at this time.
Debug CLI commands
This section walks through debugging CLI commands.
To debug CLI commands:
SSH into the server you want to debug using CLI commands.
Create the following environment variables:
These variables are removed when the SSH session ends.
Begin debugging
On Starter environments and Pro Integration environments, run the CLI command to debug.You may add runtime options, for example:
On Pro Staging and Production environments, you must specify the path to the Xdebug php configuration file when debugging CLI commands, for example:
For debugging web requests
The following steps help you debug web requests.
On the Extension menu, click Debug to enable.
Right click, select the options menu, and set the IDE key to PHPSTORM.
Install the Xdebug client on the browser. Configure and enable it.
Example set up on Chrome
This section discusses how to use Xdebug in Chrome using the Xdebug Helper extension. For information about Xdebug tools for other browsers, consult the browser documentation.
To use Xdebug Helper with Chrome:
Create an SSH tunnel to the Cloud server.
Install the Xdebug Helper extension from the Chrome store.
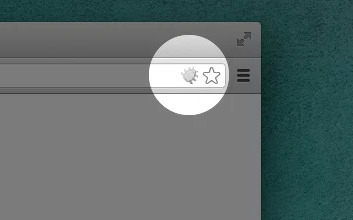
Enable the extension in Chrome as shown in the following figure.
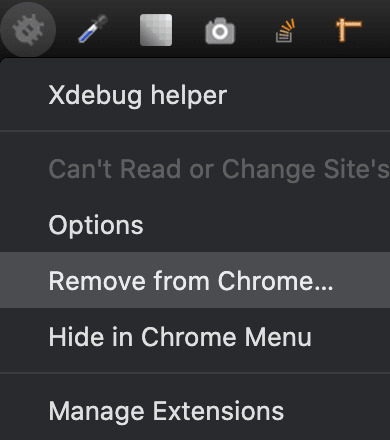
In Chrome, right-click in the Chrome toolbar.
From the pop-up menu, click Options.
From the IDE Key list, click PhpStorm.
Click Save.
Open your PhpStorm project.
In the top navigation bar, click (Start listening).
If the navigation bar isn’t displayed, click View > Navigation Bar.
In the PhpStorm navigation pane, double-click the PHP file to test.
Debug code locally
Due to the read-only environments, you need to pull code locally from an environment or specific Git branch to perform debugging.
The method you choose is up to you. You have the following options:
Check out code from Git and run composer install
This method works unless composer.json references packages in private repositories to which you do not have access. This method results in getting the entire Magento codebase.
Copy the vendor, app, pub, lib, and setup directories
This method results in your having all code you can possibly test. Depending on how many static assets you have, it could result in a long transfer with a large volume of files.
Copy the vendor directory only
Because most Magento and third-party code is in the vendor directory, this method is likely to result in good testing although you will not be testing the entire codebase.
To compress files and copy them to your local machine:
Use SSH to login to the remote environment.
Compress the files.
For example, to compress the vendor directory only, enter
On your local environment, use PhpStorm to compress the files.
After spending way more time that I should like to admit trying to get XDEBUG to work with Notepad++ using the DBGp plugin in anything but the simplest of projects, I decided to look for an alternative.
I compared features of 9 different IDE's for PHP development and reading tons of reviews. There are many great IDE's out there and everyone will have their favourite. My short list ended up including:
Eclipse (PDT) 3.5 -- Didn't bother trying it. While I'm sure it's a fine product, the website is ancient and not user friendly. Way too much work to try and find information. I'm not sure if it is even being developed anymore. PDT isn't even listed in their main list of downloads. Although I didn't try Eclipse (PDT), I did try Aptana which is built on Eclipse but I don't want to have to struggle to figure out the user interface… I want to code!
NetBeans 8 -- Way better user interface than Eclipse in my opinion. It did take me a little to figure out the XDEBUG integration but I got it to work exactly as I expected. My problem was part technology and part learning what I wanted to do in NetBeans which was to initiate the debugging session from within my web browser without having to modify the URL.
Although both of these are free, I would not have minded paying for an IDE for PHP development since I do a fair amount of this for a living. Some of the try before you buy contenders included PhpStorm 7.13 and PHPDesigner 8.1.2.
They all have similar sets of features. PHPDesigner is even a native Windows app which is why I might still consider it.
I decided to give NetBeans a try. There are tons of stories on the Net from developers switching from Eclipse to NetBeans but very few going in the other direction. It includes almost all of the features I regularly use and plugins to fill in the gap. What was it missing? Like many of the cross-platform IDE's, it's a Java application which means it is slower than it could be on Windows. I also wish it had Timed Backups feature like in Notepad++.
Assuming you've downloaded and installed NetBeans, here's how to get it to work with XDEBUG:
Step 1 -- Configure PHP to work with XDEBUG
Modify your php.ini file. Start by commenting out anything that refers to ZEND… by adding a semi-colon in front (to the left) of the line. Zend is not compatible with XDEBUG.
Next comment out everything under the (xdebug) section. Then add the following, making sure to modify the lines that refer to your XAMPP path (doesn't work with the Lite version).
For 64-bit WAMP, the lines would be:
As you can see, the actual filename and location for the php_xdebug.dll file may vary. Check the ext or zend_ext folder to get the correct name for your version of AMP. If your version of AMP did not come with XDEBUG, Follow the instructions found on the XDEBUG Installation Wizard page.
Save your changes and restart Apache.
Step 2- Configure NetBeans to work with XDEBUG
The following instructions are for NetBeans 8 but it should be fairly similar with other versions:
Open your project in NetBeans. If you don't have one yet, create one.
Click Tools > Options > PHP.
Click the Debugging tab and make sure that:
Debugger port: 9000.
Session ID: netbeans-xdebug
Maximum Data Length: 2048
None of the checkboxes are checked.
Click OK.
Click File > Project Properties > Run Configuration > Advanced button.
Select Do Not Open Web Browser and click OK twice.
Important: You will need to repeat these last two steps anytime you create a new project.
You may need to close and restart NetBeans for the changes to take effect as I discovered that they don't always take effect right away when you save.
That's it. It should now be configured and ready to use. Next we will XDEBUG enable your web browser.
Importing Existing Source Code into NetBeans
Creating a new NetBeans project from an existing source code folder/files is easy. The following instructions describe how to create a new NetBeans project using existing source code and without storing NetBeans' own project files in your original source code directory tree. Looks like a lot of steps but it only takes about a minute to complete.
Click File > New Project.
For the Category, select the PHP.
For the Projects, select PHP Application with Existing Sources.
Click Next.
Specify the path to the Source Folder. This is where you source code currently exists.
Specify a project name. This can be anything as long as it is different from other existing NetBeans projects you might have.
Specify the version of PHP you will be using. If you aren't sure, type the following at a Command prompt or verify your log files: php --version . If PHP isn't in your path, you may need to change to the directory where the PHP.exe application is located.
The default UTF-8 should be correct for most situations.
To prevent NetBeans from storing it's files in your source code directory, check the 'Put NetBeans metadata into a separate directory' box and specify the folder where these files should be stored.
Click Next.
For Run As:, select Local Web Site (running on local web server) if it is not already selected.
Project URL should be the path to the localhost that corresponds to source directory specified above. It typically looks like http://localhost/ and may include a folder name if your local website is not in the root of the server.
For PHP, the default index file is typically called index.php unless you've changed it.
DO NOT check the 'Copy files from Source Folder to another location' checkbox if you want to work on your files where they currently reside.
Click Finish.
NetBeans will then create the project and open the default file.
Enabling XDEBUG in Web Browsers
Chrome
There are two really useful plugins for Chrome that you should install:
XDEBUG Helper -- This will enable you to turn XDEBUG on and off from your web browser without having to modify the URL. This is essential when debugging a POST type form submission where you can't just enter a URL.
XDEBUG Output Toggler -- This extension allows you to toggle the visibility of the extremely useful stack trace messages for your PHP.
Firefox
There are also two really useful plugins for Firefox that you should install (to be tested):
easyXdebug or The easiest Xdebug -- This will enable you to turn XDEBUG on and off from your web browser without having to modify the URL. This is essential when debugging a POST type form submission where you can't just enter a URL. I don't recommend installing both of these add-ons as they might conflict with each other since they do the same function.
XDEBUG Error Togger -- This is the same as XDEBUG Output Togger for Chrome. It allows you to toggle the visibility of the extremely useful stack trace messages for your PHP.
Internet Explorer
Unfortunately I don't know of any integration tools that work with IE. If you know if any, leave a comment below. You'll always be able to debug by appending ?XDEBUG_SESSION_START=netbeans-xdebug to the URL
Using XDEBUG in NetBeans
Open your project.
Debugging a Project: Right-click on the project you want to debug. Then click on Debug to start the debugger. There is a Debug Project icon at the top of the editor that you could use however it will not work for debugging a specific file. Debugging a specific file in a project or standalone file: Right-click on the file either in the navigation pane or even in the source code itself and then click Debug. If the file is already open, right click anywhere in the editor window and select Debug.
Set a breakpoint by clicking on the line number in the margin. Otherwise your code will be executed from start to end and nothing will happen in debugger.
Switch to your web browser and load the page you want to debug.
Click the add-on/plugin icon to enable Xdebug in your browser.
Reload the page you want to debug and switch back to NetBeans. You should now notice that the execution of the code has paused where you set the breakpoint above.
You can now use the debugging controls in the toolbar to step over, step into, step out, run to cursor, run, and stop debugging.
Xdebug Chrome Extension
You may notice that your PHP code runs slower when debugging. This is perfectly normal and a good reason to have a fast computer. On the positive side, you'll really notice where the slower parts of your code are.
Troubleshooting
If you can't get it to work, check to make sure that your timezone is properly set in /xampp/php/php.ini. I'm not sure why but it made a difference for me. It will also make dates appear correctly on your website.
Chrome Xdebug Not Working
(Date) ; Defines the default timezone used by the date functions ; Find the value for your location by visiting http://php.net/date.timezone date.timezone = America/Toronto
Xdebug Chrome How To Use
Related Posts:
0 notes
Text
Find the nearest Coronavirus testing facility in India

0 notes
Text
Canna Content Creators

Calling Canna Content Creators
8 more pages of old blog posts before jCruceWeb has restructured all of Nirvana farms' blog pages.

- 36 pages total. - Each page has 20 Posts. - 700+ Posts - Every Post has its own unique image. I will start writing new blog posts again in the new year. With the writing of these blog posts will come the chance to have your content featured. Your webGrinder has been hard at work creating new doors to step through and experience what is on the other side. Visit the Farm! The keyword here is New. I am looking for fresh canna content creators who already produce without pushing them into action.- I am also looking for a new baker to fill the gap left when our lady Maryjen left. - Do you have a canna blog already and want to reach more people? Let's talk. - Do you have a canna talk show or podcast? On the internet, content is king. However, google indexing spiders do not watch videos or look at pictures. As streamers, you have a monumental task before you. Not only do you have to be a star, but written content describing the image/video with text is critical. As quality streamers, your job is to feed google the needed text and links to consume along with your media. Only by doing this can your posts become the highest authority on the given subject matter. If you are already doing this, we should join forces in the new year and grow together. - Are you a Cannabis Grower? Do you want to share your amassed knowledge with those that want to listen and learn? Do you have written lore and well-documented images from past seasons? I am ready to absorb all you can offer. Teach us, Guru! - Do you have other Canna Crafts to share? Contact me, and we will make some magic happen!Am I talking to you? There is no better time than right now for a new beginning. Do not put off until tomorrow what you can accomplish today. Our cup is always full; help me help others help themselves. Make Contact Club Cannabliss Newsletter Be inspired by the unconventional wisdom of our peers and experts as they help us get to a higher state of consciousness.Sign-in and edit your profile. Not yet a Member? Register and claim your spot among the anointed ones!


Indica vs Sativa. Which type of bud comes out on top? You can decide for yourself as we now dive deep into the world of the various types of cannabis strains.
Let's Grow Together!
Please follow our social or subscribe as well to our social channels to stay up to date!

Nirvana Farms Medical - STONER MORNING SHOW - D&D Cooking with Cannabutter Instagram Linkedin Twitter Tumblr Pinterest YouTube - Mix - Medium - Flickr - Email Read the full article
0 notes
Link
0 notes
Link
Just use Webgrinder to extract data from Google maps, including public transport, schools, hospitals, restaurants, pubs, businesses, cinemas, retail parks, superstores and whatever else you fancy!
0 notes