#BI Testing
Explore tagged Tumblr posts
Visit Tumblr Blog
Explore Tumblr blogs with no restrictions, modern design and the best experience.
Last Seen Tumblr Blogs


Fun Fact
Tumblr was the first site to host the blog for President Barack Obama in 2011.
Text
#Performance Testing#Security Testing#Load Testing#Software Optimization#Application Security#QA Performance#Cybersecurity Testing#Stress Testing#Mobile App Testing#Android Testing#iOS App Testing#Cross-Device Testing#Mobile QA#Mobile Automation Testing#App Performance Testing#Real Device Testing#Functional Testing#Software QA#Feature Validation#System Testing#Manual Testing#Automated Functional Testing#End-to-End Testing#Black Box Testing#ETL Testing#Data Validation#Data Warehouse Testing#BI Testing#Database QA#Data Quality Checks
0 notes
Text
What is iceDQ?
iceDQ is a purpose-built platform with integrated data testing, data monitoring and AI based data observability capabilities.
iceDQ is the only platform that works across the entire data development lifecycle – development, QA, and production – ensuring robust data processes and reliable data.
#icedq#etl testing#data warehouse testing#data migration testing#bi testing#etl testing tool#production data monitoring#data migration testing tools#etl testing tools#data reliability engineering
0 notes
Text
Automating Tableau Reports Validation: The Easy Path to Trusted Insights
Automating Tableau Reports Validation is essential to ensure data accuracy, consistency, and reliability across multiple scenarios. Manual validation can be time-consuming and prone to human error, especially when dealing with complex dashboards and large datasets. By leveraging automation, organizations can streamline the validation process, quickly detect discrepancies, and enhance overall data integrity.
Going ahead, we’ll explore automation of Tableau reports validation and how it is done.
Importance of Automating Tableau Reports Validation
Automating Tableau report validation provides several benefits, ensuring accuracy, efficiency, and reliability in BI reporting.
Automating the reports validation reduces the time and effort, which allows analysts to focus on insights rather than troubleshooting the errors
Automation prevents data discrepancies and ensures all reports are pulling in consistent data
Many Organizations deal with high volumes of reports and dashboards. It is difficult to manually validate each report. Automating the reports validation becomes critical to maintain efficiency.
Organizations update their Tableau dashboards very frequently, sometimes daily. On automating the reports validation process, a direct comparison is made between the previous and current data to detect changes or discrepancies. This ensures metrics remain consistent after each data refresh.
BI Validator simplifies BI testing by providing a platform for automated BI report testing. It enables seamless regression, stress, and performance testing, making the process faster and more reliable.
Tableau reports to Database data comparison ensures that the records from the source data are reflected accurately in the visuals of Tableau reports.
This validation process extracts data from Tableau report visuals and compares it with SQL Server, Oracle, Snowflake, or other databases. Datagaps DataOps Suite BI Validator streamlines this by pulling report data, applying transformations, and verifying consistency through automated row-by-row and aggregate comparisons (e.g., counts, sums, averages).
The errors detected usually identify missing, duplicate or mismatched records.
Automation ensures these issues are caught early, reducing manual effort and improving trust in reporting.
Tableau Regression
In the DataOps suite, Regression testing is done by comparing the benchmarked version of tableau report with the live version of the report through Tableau Regression component.
This Tableau regression component can be very useful for automating the testing of Tableau reports or Dashboards during in-place upgrades or changes.
A diagram of a process AI-generated content may be incorrect.
Tableau Upgrade
Tableau Upgrade Component in BI validator helps in automated report testing by comparing the same or different reports of same or different Tableau sources.
The comparison is done in the same manner as regression testing where the differences between the reports can be pointed out both in terms of text as well as appearance.
Generate BI DataFlows is a handy and convenient feature provided by Datagaps DataOps suite to generate multiple dataflows at once for Business Intelligence components like Tableau.
Generate BI DataFlows feature is beneficial in migration scenarios as it enables efficient data comparison between the original and migrated platforms and supports the validations like BI source, Regression and Upgrade. By generating multiple dataflows based on selected reports, users can quickly detect discrepancies or inconsistencies that may arise during the migration process, ensuring data integrity and accuracy while minimizing potential errors. Furthermore, when dealing with a large volume of reports, this feature speeds up the validation process, minimizes manual effort, and improves overall efficiency in detecting and resolving inconsistencies.
As seen from the image, the wizard starts by generating the Dataflow details. The connection details like the engine, validation type, Source-Data Source and Target-Data Source are to be provided by users.
Note: BI source validation and Regression validation types do not prompt for Target-Data source
Let’s take a closer look at the steps involved in “Generate BI Dataflows”
Reports
The Reports section prompts users to select pages from the required reports in the validation process. For Data Compare validation and Upgrade Validation, both source and target pages will be required. For other cases, only the source page will be needed.
Here is a sample screenshot of the extraction of source and target pages from the source and target report respectively
Visual Mapping and Column Mapping (only in Data Compare Validation)
The "Visual Mapping" section allows users to load and compare source and target pages and then establish connections between corresponding tables.
It consists of three sections namely Source Page, Target Page, and Mapping.
In the source page and target page, respective Tableau worksheets are loaded and on selecting the worksheets option, users can preview the data.
After loading the source and target pages, in the mapping section, the dataset columns of source and target will be automatically mapped for each mapping.
After Visual Mapping, the "Column Mapping" section displays the columns of the source dataset and target dataset that were selected for the data comparison. It provides a count of the number of dataset columns that are mapped and unmapped in the "Mapped" and "Unmapped" tabs respectively.
Filters (for the rest of the validation types)
The filters section enables users to apply the filters and parameters on the reports to help in validating them. These filters can either be applied and selected directly through reports or they can be parameterized as well.
Options section varies depending on the type of validation selected by the user. Options section is the pre final stage of generating the flows where some of the advanced options and comparison options are prompted to be selected as per the liking of the user to get the results as they like.
Here’s a sample screenshot of options section before generating the dataflows
This screenshot indicates report to report comparison options to be selected.
Generate section helps to generate multiple dataflows with the selected type of validation depending on the number of selected workbooks for tableau.
The above screenshot indicates that four dataflows are set to be generated on clicking the Generate BI Dataflows button. These dataflows are the same type of validation (Tableau Regression Validation in this case)
Stress Test Plan
To automate the stress testing and performance testing of Tableau Reports, Datagaps DataOps suite BI Validator comes with a component called Stress Test Plan to simulate the number of users actively accessing the reports to analyze how Tableau reports and dashboards perform under heavy load. Results of the stress test plan can be used to point out performance issues, optimize data models and queries to ensure the robustness of the Tableau environment to handle heavy usage patterns. Stress Test Plan allows users to perform the stress testing for multiple views from multiple workbooks at once enabling the flexibility and automation to check for performance bottlenecks of Tableau reports.
For more information on Stress Test Plan, check out “Tableau Performance Testing”.
Integration with CI/CD tools and Pipelines
In addition to these features, DataOps Suite comes with other interesting features like application in built pipelines where the set of Tableau BI dataflows can be run automatically in a certain order either in sequence or parallel.
Also, there’s an inbuilt scheduler in the application where the users can schedule the run of these pipelines involving these BI dataflows well in advance. The jobs can be scheduled to run once or repeatedly as well.
Achieve the seamless and automated Tableau report validation with the advanced capabilities of Datagaps DataOps Suite BI Validator.
0 notes
Text


#⌕﹒ㅤ—ㅤ ⌗﹒ 🐉 ˚₊‧ — ㅤ ⌜ 𝗆𝗈𝗋𝗍𝖺𝗅 𝗄𝗈𝗆𝖻𝖺𝗍 」 .ᐟ#bi han#i want to disobey and test his patience#mortal kombat#mk1#mk1 khaos reigns#mortal kombat 1: khaos reigns#sub zero#bi han sub zero#khaos reigns spoilers
569 notes
·
View notes
Text

None of them can drive cars but Tomas said he drove a tractor once so they made the stupid decision of trusting him
.
.
Ref. Thomas sanders

#haha get it cause he’s Tomas so I used a Tomas sanders pic… rip vine#fr though.. can ANY of them drive?#I genuinely don’t think any of them can#bi Han would try cause he refuses to be told he can’t#kuai is a law abiding citizen but gets dragged along on bi Hans crimes#Tomas just wants any opportunity to bond so he tags along#wait I take that back.. Kuai is a law abiding citizen until it comes to murder#he’s not immune to stabbing people#bi Han tests his patience every day every hour#tomas vrbada#bi-Han#kuai liang#mk smoke#sub zero#mk scorpion#Lin Kuei#vine reference#doodle#my art
1K notes
·
View notes
Text
Them: Wait, so, you think Tommy’s closet joke was actually hysterical and made you love his character even more instead of hating him?
Me:

#911 on abc#911 season 7#911 spoilers#eddie diaz#evan buckley#911 abc#911#911 show#911 fox#911 s7#911 7x05#buck x tommy#bucktommy#evan buck buckely#bi buck#tommy kinard#firefly#anti tommy kinard#I will not stand for Tommy hate#fandom discourse#test me#it was a great joke#it definitely wasn’t enough to out him#please get a grip#some of your anti Tommy posts read like satire#it’s really silly
840 notes
·
View notes
Text


Unsupervised bisexual menace
#house md#gregory house#bisexual#it canon. to me~#Wilson is not around and this is how he breaks the ice#okay gayboy#he flip flops with the term so much#consistently#whichever suits him#he's totally that kind of bi#testing homosexual waters with the faggot gun or something
1K notes
·
View notes
Text
Do the tumblrinas know about Le Nozze di Figaro (1786, Mozart/Da Ponte)
#fr though I feel like the tumblr girlies would love this show (18th century opera)#it has everything:#rich gross men getting their comeuppance#transgenderism#implied gay sex#genuinely adorable and wholesome bi-coded het couple#girl best friends#schemes#unexpected paternity test results#mistaken identities#an arch rival turned supportive mother in law#and a drunk bitchy gardener#also some of the most genuinely romantic moments in all media (to me)#have you ever tried to pull one over on ur boyfriend but he figures it out immediately because he would recognize your voice anywhere?#this happened to my good friend susanna once#opera#mozart#le nozze di figaro#the marriage of figaro
150 notes
·
View notes
Text

#mortal kombat#sub zero#bi han#shang tsung#don't mind me#i just discovered that my fav online site to make gifs has new options and needed to test it of course#on bi han and shang tsung#because shang tsung's little smirk was too cute to not use xd
30 notes
·
View notes
Text
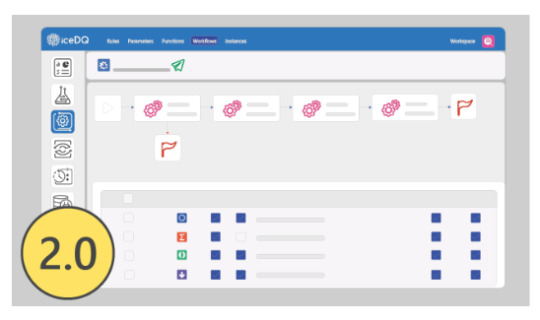
Strengthen Your Data Quality Framework with iceDQ v2.0
Building a strong foundation for data quality is vital to making strategic decisions. With the iceDQ v2.0 User Training, you'll gain the technical knowledge and strategic mindset to design, monitor, and optimize a reliable data quality framework.
What You Will Gain:
7 progressive chapters guiding you from basics to advanced features.
Over 30 interactive videos to reinforce concepts visually.
Real-world business examples to bridge the theory-practice gap.
Final certification to demonstrate your expertise.
Practical tools and workflows you can deploy immediately.
This course empowers professionals to handle data complexities, whether in healthcare, finance, retail, or any other domain. You’ll learn to automate validations, set up monitoring dashboards, and ensure compliance with data standards.
Make your organization data-ready. Start the iceDQ v2.0 training now and establish a strong data quality culture.
#data migration testing#data migration testing tools#etl testing tools#bi testing#etl testing tool#data warehouse testing#etl testing#production data monitoring#data reliability engineering#icedq
0 notes
Text
#datagaps#bi testing#application testing#ETL testing#data testing#bi validator#etl validator#dataquality
0 notes
Text
Gawain
from Arthurian Legend


#I think this may just serve as a test of whether people know him from the film or the original legend. or bbc merlin he's quite bi in that#and now time to guess the dozen variant spellings of this dude's name#gawain#gawaine#gwaine#gawane#gawein#arthurian legend#arthuriana#classic literature#the green knight#the green knight 2021#bbc merlin
135 notes
·
View notes
Text
open to: f/m/nb
muse: charlie woo , a 31 year old lawyer
plot: charlie has overworked himself to the point of a fever, and your muse is the one there to help take care of him.
possible connections: significant other, best friend, roommate, co-worker

"if you take care of me any better i just might have to marry you." charlie whispered as his eyes opened, still feverish as he looked up at them. "i don't know what i would do without you."
#indie smut rp#indie gay rp#indie bi rp#indie starter#test muse#could be a soft thread or a smutty one or both#open to mutuals and non mutals alike
22 notes
·
View notes
Text

G - Gay

B - Bi

T - Trans
Hey look I have more sketches for this thing
The first part
#osc#object show community#object shows#inanimate insanity#ii nickel#ii balloon#ii oj#ii paper#ii cheesy#ii yinyang#ii yang#ii knife#ii bomb#ii lifering#ii fan#ii yin#ii candle#ii test tube#ii lightbulb#ii trophy#ii suitcase#ii paintbrush#ii bot#gay#bi#bisexual#trans
87 notes
·
View notes
Text
hiiii ! i really want to get back into writing on here, so please give this a like and i'll check out your opens !
#will likely be replying w/ a test muse unless u lmk specifics <3#indie rp#indie bi rp#indie smut rp
18 notes
·
View notes
Text
If you play schwyzerörgeli music on the train before 9am at full volume you should be shot on sight i think
#besties. i‘m at my limit.#this fucking pfadigruppe is TESTING me#schwyzerörgeli i de berge? voll okay. schwyzerörgeli im zug uf züri? absolutely NOT.#und die säck bliibe bis neuehof i hate it hereeee 😭😭😭😭
15 notes
·
View notes