#php apm
Explore tagged Tumblr posts
Visit Tumblr Blog
Explore Tumblr blogs with no restrictions, modern design and the best experience.
Last Seen Tumblr Blogs


Fun Fact
Tumblr’s reach among the 26-to-35-year-olds in the US is 11%.
Text
Mastering PHP Application Monitoring: Best Practices for 2025
Introduction
PHP powers over 75% of the web today, making it one of the most widely used server-side languages. From WordPress sites to complex Laravel applications, developers rely on PHP to build fast, scalable solutions. But with growing complexity comes the need for real-time visibility and control. This is where application monitoring plays a critical role.
Monitoring isn't just about tracking uptime, it's about understanding how your code behaves in production, identifying slow queries, spotting memory leaks, and proactively fixing issues before users even notice them. In this blog, we’ll explore the best practices for PHP application monitoring and how you can implement them effectively.
12 Best Practices for PHP Application Monitoring
1. Upgrade to PHP 8+
Running on the latest version ensures better performance, error handling, and compatibility with modern tools. PHP 8’s JIT compiler alone can improve execution speed significantly.
2. Follow PSR Coding Standards
Using standards like PSR-3 (logging) and PSR-4 (autoloading) leads to cleaner, more structured code that monitoring tools can process more efficiently.
3. Use Descriptive Functions and Logs
Functions like processData() aren’t helpful when debugging. Instead, use meaningful names like generateMonthlyReport() and ensure log messages are clear and contextual.
4. Leverage Popular Frameworks
Frameworks such as Laravel, Symfony, or CodeIgniter come with built-in structure and middleware support, which integrate smoothly with APM solutions.
5. Manage Dependencies with Composer
Locking versions through Composer ensures consistent environments across staging and production, reducing unexpected errors during deployment.
6. Add Caching Layers
Implement opcode, database, and object caching to reduce server load and accelerate response times.
7. Set Up Smart Alerts
Avoid alert fatigue. Configure alerts for thresholds that truly matter like a sustained increase in response time or sudden spike in 500 errors.
8. Conduct Security Monitoring
Monitor failed login attempts, suspicious user behavior, or error messages that might indicate vulnerabilities.
9. Use CI/CD Tags for Deployments
Tagging releases helps correlate performance changes with specific deployments, making it easier to roll back or debug regressions.
10. Keep Monitoring Agents Updated
Regularly check for updates to ensure compatibility with your PHP version and frameworks.
11. Profile Real User Traffic
Use profiling tools in production to identify bottlenecks during peak usage not just in local or staging environments.
12. Optimize SQL Queries
Poorly indexed or long-running queries can slow down your app. APM tools can pinpoint these with exact timings and stack traces.
Why Choose Atatus for PHP Monitoring?
Atatus is a full-stack APM and error-tracking platform that offers deep insights into PHP applications. Here’s why it stands out:
Real-time performance monitoring for PHP 7.x and 8.x apps
Transaction tracing down to database queries, external calls, and slow functions
Easy integration with Laravel, Symfony, CodeIgniter, and other frameworks
Custom alerting, dashboards, and logs in one unified interface
Error tracking with stack traces and user context to speed up debugging
Atatus helps developers detect issues early, optimize code paths, and ensure smooth performance at scale.
Conclusion
Effective monitoring is key to building fast, stable, and scalable PHP applications. By following these best practices and choosing the right tool like Atatus, you can gain full visibility into your app's performance, reduce downtime, and deliver a seamless user experience.
Whether you're managing a startup project or an enterprise-grade application, observability isn't optional, it's essential. Implementing a strong monitoring strategy today will lead to fewer production issues, faster debugging, and more confident development tomorrow.
Originally published by https://www.atatus.com/
#php monitoring#php monitoring best practices#What is PHP Monitoring#php applications#PHP Application Monitoring#PHP apm#php application performance monitoring tools#php monitoring solution#php application monitoring tools#php application performance#php performance monitoring tool#php monitoring tools#php performance monitor#php monitor#apm for php#php apm monitoring#php monitoring tool#php monitoring software#monitor php application performance#apm php#php application monitoring tool#php application performance mangement#monitoring php performance#php app monitoring#php distributed tracing
0 notes
Text
APM Planning
. Additionally, you’ll help drive the effective use of JLL technology, which includes Project Home Page (PHP), Prolog and Atlas… Apply Now
0 notes
Text
APM Planning
. Additionally, you’ll help drive the effective use of JLL technology, which includes Project Home Page (PHP), Prolog and Atlas… Apply Now
0 notes
Text
Exploring the Power SCADA Market: Trends, Drivers, and Emerging Opportunities in Energy Management - UnivDatos
According to a new report by UnivDatos Market Insights, the Power SCADA Market is expected to reach USD ~3.5 billion by 2032 by growing at a CAGR of ~5.2%. Currently, due to the advancement in technology, companies are always on the lookout for ways to automate and enhance operations as well as industrial procedures. Ever since the discovery of computers and the World Wide Web, machines have slowly started installing computing technologies into their structures. The emergence of these systems in the traditional existing structure can be considered as the start of a new period in the Industrial Revolution. As with most industries, power systems have developed to cater to the needs of investors, consumers, and operators in the last few decades. Enterprise resource planning solutions: the main impact on power systems describes that automation has been a result of the implementation of these solutions. Consequently, power systems started to utilize SCADA systems in the last part of the twentieth century. However, before discussing SCADA systems in detail, its history must be discussed.
Request To Download Sample of This Strategic Report - https://univdatos.com/get-a-free-sample-form-php/?product_id=68085&utm_source=LinkSJ&utm_medium=Snehal&utm_campaign=Snehal&utm_id=snehal
SCADA Systems in Oil and Gas: Driving Innovation and Efficiency in the Digital Age
In the oil and gas industry, supervisory control and data acquisition Scada has emerged as a revolutionary concept that is revolutionizing operations across the value chain. Cutting across the upstream, middle, and downstream, this article provides a detailed analysis of such systems and relates the development and design of SCADA systems to their usage. SCADA systems in upstream invents real-time well monitoring, production optimization, and remote operation which increases the output and efficiency to a greater level. Midstream applications on the other hand aim at optimizing the use of pipelines with features such as maintenance prediction, improved leakage detection, and pipeline flow. Through automated quality assurance, energy consumption, and process control, SCADA systems can revolutionize the climate in refineries profoundly. Of course, some challenges come with system integration, and in the case of SCADA, these include problems encountered in data management, cybersecurity issues, and issues of integration with legacy systems. Besides, looking at new developments capable of enhancing the functionalities of SCADA, this study considers edge computing, digital twins, AI, machine learning integration, and 5G. Using SCADA, the oil and gas industry can be made efficient, safe, and innovative. The ensuing analysis of SCADA implementation lessons and impediments underlines that companies becoming integrated with the new technologies while also overcoming key implementation challenges will be best placed to thrive in the challenging, competitive, and complex energy marketplace of the future. Notably, this adoption has been especially prominent in regions with well-established oil and gas infrastructure such as North America and Europe; these two regions account for over 60% of the SCADA market in the industry.
Several significant themes have characterized the development of SCADA systems in the oil and gas industry:
Enhanced Integration: Modern SCADA systems are integrating with other business systems rapidly more and more, especially with advanced systems like Asset Performance Management (APM) and Enterprise Resource Planning (ERP). They are no longer the standalone solutions. Due to this integration, operations management is now a broader concept, as evidenced by the enhanced decision-making capacities revealed by 78% of the oil and gas industry players.
Better Cybersecurity: With the more advanced integration in computer networks, SCADA systems usher in cyber security concerns. Therefore, industry consumption of cybersecurity solutions related to SCADA systems has trended upward by 35% each year since 2018.
Cloud Adoption: As of 2021, 62% of oil and gas businesses implement cloud integration in their SCADA systems for their businesses up from 27% in 2016. This has suggested an increase in the trend of converting to cloud-based SCADA solutions.
The cumulative impact of these changes has been unprecedented improvements in the operational efficiency levels. Companies with complex SCADA systems, for example, experience roughly a 15 % reduction in unplanned downtime and a 20 % rise in asset usage. Also, the efficient use of the SCADA system has led to a reduction of the maintenance cost by 30% among some operators due to predictive maintenance.
SCADA ARCHITECTURE: THE NERVOUS SYSTEM OF OIL AND GAS OPERATIONS
The nervous system of industrial operations is made up of a sophisticated network of interconnected components that make up modern SCADA systems in the oil and gas industry. Real-time monitoring, control, and optimization across many, frequently geographically scattered assets are made possible by this complex architecture.
· A case study of one of the leading players in the Eagle Ford Shale indicated that an enhanced SCADA system led to a productivity improvement of approximately 22% and a 35% reduction in Well downtime. The predictive analytical functions of the system allowed for preventive maintenance functions that further reduced cases of random breakdowns.
· This case study is an ideal example to understand how complex SCADA systems can transform the upstream operation. The operator implemented an end-to-end SCADA system with production enhancement algorithms accompanied by real-time well monitoring and teleoperation. The ability of the system to integrate data from one or more sources - surface instruments, downhole sensors, and previous production data was critical to the performance of the system.
· The aspect of the system that provided for maintenance based on predictions of when certain components would degrade had a major influence. It was also reported that the technology used the trends in the performance of equipment data to make estimations on possible equipment failures up to two weeks in advance. Therefore, it became possible to minimize production losses as well as to plan interventions by maintenance teams during planned downtime. In return, the unscheduled downtime was reduced from 12% to 4% enhancing overall production tremendously.
Ask for Report Customization - https://univdatos.com/get-a-free-sample-form-php/?product_id=68085&utm_source=LinkSJ&utm_medium=Snehal&utm_campaign=Snehal&utm_id=snehal
Conclusion
By presenting the details, it can be proposed that the SCADA system can be employed on a greater capacity in power systems to obtain higher performance and reliability along with life span. Equipment data monitoring and especially data acquisition can be very convenient and accurate if power systems are commissioned to SCADA. Today, electrical systems are very highly efficient and smart enough to oversee all the correlated activities and actions, and it would have not been possible without the aid of technology. Thus, the power sector needs to see the need and organize itself to meet the new technical changes.
0 notes
Text
AWS Cloud Monitoring and Optimization Ideal Practices
The venture adoption of Amazon Web Services has actually accelerated over last 3 years among big consumers throughout the globe ranging from manufacturing to highly regulated economic solutions. As large enterprise business adopts AWS as a vital cloud system for their IT systems, it's important to established excellent managed cloud methods for a successful cloud adoption.
Provisioning and also Arrangement Monitoring
One of the key facets of using Cloud infrastructure is to provision as well as set up software to make it useful. We suggest adhering to 3 ideal practices for an effective AWS cloud framework provisioning as well as configuration monitoring.
CloudFormation Templates
You can benefit from AWS CloudFormation service for provisioning your cloud facilities with one click. You can develop base cloud development templates to prepare your AWS accounts for manufacturing, QA and growth objective by configuring proper VPC's and also IAM resources. This will certainly guarantee that every brand-new AWS cloud account will be sterilized based on your enterprise process as well as compliance demands for use.
Managed Settings
You can utilize took care of setting services like AWS BeanStalk and also OpsWorks rather than producing software program configuration for your application using various innovation piles like.NET, JAVA, Python, PHP and so on. This will certainly decrease the DevOps as well as setup management work for your IT groups.

Modern Setup Management
AWS has great assistance for COOK if you are trying to find modern configuration administration of software dependences and setups. You can likewise check out utilizing Ansible for the lightweight arrangement administration at rate and range without expenses.
Develop and also Continual Implementations
Cloud systems bring dexterity via rapid and also on-demand provisioning. Nevertheless, the genuine agility can be knowing when you can take your applications and software adjustments much faster to end users. The adhering to AWS Cloud solutions assist you build and also launch software faster than you could do with standard IT.
Build as well as Test Code Faster
By taking advantage of AWS CodeBuild solution, you can assemble source codes, run test collections as well as prepare software for launch much faster than ever before without bothering with handling the develop pipes and examination automation facilities. This can help you reduce release times dramatically without stressing over the required framework to construct as well as evaluate hundreds of different applications in the venture landscape.
Automate Software Program Release Workflows
AWS CodePipeline solution brings constant assimilation as well as shipment as a service so business can build, test as well as deploy software program applications whenever when there is an adjustment or new code dedicate. This will certainly allow you to rapidly test and supply new attributes and also modules secure by preparing your software application for different atmospheres like PROD, QA and also DEV and so on.
Automate Application Release Release
You can take a look at standard devices like Jenkins or Go.CD or utilize AWS CodeDeploy for automating the software application launches into various settings in a foreseeable means once the software launch packages prepare. This will minimize the manual release process, carry out no downtime deployments as well as can aid you release across numerous web servers in an issue of mins. AWS CodeDeploy collaborates with CodePipeline for implementation automation.
DevOps Automation and also Cloud Procedures Management
As a big business, you will not succeed in cloud journey unless DevOps society as well as automation are key priorities for your teams. The only means to properly manage your business cloud framework will certainly be by allowing your groups to make use of AWS SDK's for your automation. This will certainly surpass provisioning, setup, build and release life cycle to day-to-day operations administration for tracking, security as well as cloud management.
Modern IT Monitoring
Take advantage of contemporary software applications like Datadog for monitoring, New Antique for APM as well as Sumo Reasoning for log management throughout your applications running in cloud framework. You can stream cloud occasions from CloudTrail right into your log monitoring system for centralised presence into every change in your cloud infrastructure.
Trustworthy Security Administration
Taking care of application as well as setup protection is customer obligation in AWS cloud. You can take advantage of tools like TrendMicro, CloudPassage for your server as well as network degree security while making the most of software program from AWS industry for WAF or DDoS protection.
1 note
·
View note
Text
From React to MongoDB: Full Stack Optimization Strategies
Full stack optimization is crucial for ensuring that your software runs smoothly and performs well under heavy load. One of the most important aspects of full stack optimization is identifying and addressing performance bottlenecks. Profiling tools and performance monitoring can help you pinpoint the areas of your application that need the most attention, whether it be slow database queries, unoptimized front-end code, or inefficient back-end algorithms. By focusing on these problem areas, you can make targeted improvements that will have a significant impact on overall performance. In this blog post, we'll take a look at some of the best tools and techniques for identifying and addressing performance bottlenecks in full stack applications, with a focus on the most effective strategies for improving the performance of your software.
Profiling Tools for Identifying Performance Bottlenecks
One of the most important steps in optimizing full stack software is identifying performance bottlenecks that are slowing down your application. Profiling tools allow developers to analyze the performance of different components of their software, such as the front-end, back-end, and database, and pinpoint the areas that need improvement.
There are several types of profiling tools available, including:
CPU profilers: These tools measure the time spent executing different parts of your code and can help identify which functions or methods are taking the longest to execute.
Memory profilers: These tools help you understand how your application is using memory and can identify memory leaks or other issues that are impacting performance.
Performance profilers: These tools measure the performance of your application over time and can help you identify patterns or trends in performance.
Some popular profiling tools for full stack development include:
Chrome DevTools: it's an in-browser tool available in Google Chrome that allows developers to profile front-end performance.
Blackfire: it's a performance monitoring and profiling tool for PHP applications.
Xdebug: it's a PHP extension that provides debugging and profiling capabilities.
Visual Studio Profiler: it's a performance profiling tool for .NET and C++ applications.
By using these tools, developers can get detailed information about how their application is performing and can use this information to make targeted improvements that will have a significant impact on overall performance.
It's important to note that Profiling should be done in a development environment and not in production as it can cause a slowdown in the system. Also, it's recommended to profile your application in different scenarios such as high load, low load and normal load.
For custom software development services Click here .
Performance Monitoring Techniques for Full Stack Application
Performance monitoring is another key technique for optimizing full stack software. Unlike profiling which is used to identify specific performance bottlenecks, performance monitoring is used to track the overall performance of your application over time. This allows developers to identify patterns or trends in performance and make adjustments as necessary.
There are several types of performance monitoring tools available, including:
Application performance management (APM) tools: These tools provide a detailed view of the performance of your application, including metrics such as response time, error rate, and throughput.
Log monitoring tools: These tools allow you to collect and analyze log data from your application, which can be used to identify performance issues or errors.
Server monitoring tools: These tools provide information about the performance of your servers, including metrics such as CPU usage, memory usage, and disk usage.
Some popular performance monitoring tools for full stack development include:
New Relic: it's a cloud-based APM tool that provides detailed performance metrics for your application.
Loggly: it's a cloud-based log monitoring tool that allows you to collect and analyze log data from your application.
Nagios: it's an open-source server monitoring tool that allows you to monitor the performance of your servers and infrastructure.
By using performance monitoring tools, developers can track the performance of their application over time, identify patterns or trends in performance, and make adjustments as necessary to improve performance. These tools also provide detailed information about the performance of your application, which can be used to diagnose and troubleshoot performance issues.
Targeting Problem Areas: Optimizing the Most Critical Components of Your Full Stack
Once you've identified performance bottlenecks and trends in performance using profiling and monitoring tools, the next step is to focus on optimizing the most critical components of your full stack. This means targeting the areas of your application that are having the biggest impact on performance and addressing them first.
For example, if your profiling tool shows that a particular database query is taking a long time to execute, you should focus on optimizing that query first. Similarly, if your monitoring tool shows that your front-end is slow to load, you should focus on optimizing the front-end code to improve the load time.
To target problem areas, you can use several techniques such as:
Reducing the complexity of your code: By simplifying your code, you can make it easier to understand, maintain and optimize.
Caching: Caching can help reduce the load on your back-end by storing frequently used data in memory.
Database optimization: This can include indexing, normalization, and query optimization to improve the performance of your database queries.
Scaling: Scaling can help improve performance by adding more resources to your application, such as additional servers or more powerful hardware.
It's important to remember that optimization is an iterative process, and you may need to repeat the process of profiling, monitoring, and targeting problem areas multiple times to fully optimize your full stack application.
By focusing on the most critical components of your full stack, you can make targeted improvements that will have the biggest impact on overall performance. This will help you improve the performance of your application and make it more responsive and scalable.
For ecommerce software development company Click here .
Using Profiling and Monitoring to Improve Full Stack Performance
Profiling and monitoring are two key techniques for optimizing full stack software. While profiling is used to identify specific performance bottlenecks, monitoring is used to track the overall performance of your application over time. Both techniques can be used together to improve the performance of your full stack application.
By using profiling tools to identify performance bottlenecks, developers can make targeted improvements to specific parts of their application. For example, if a particular database query is taking a long time to execute, developers can use profiling tools to identify the cause of the problem and make optimizations to improve performance.
Performance monitoring, on the other hand, allows developers to track the overall performance of their application over time and identify patterns or trends in performance. By monitoring metrics such as response time, error rate, and throughput, developers can identify areas of the application that need improvement and make adjustments as necessary.
Combining these two techniques can provide a comprehensive view of your application's performance, which can help developers make more informed decisions about how to optimize their application.
For example, Profiling can help you identify the problem areas and monitoring will help you track how these changes are impacting the overall performance of the application. By doing so, developers can make adjustments to their optimization strategy as needed and track the progress of their optimization efforts over time.
It's important to note that profiling and monitoring should be done regularly in the development environment and not in production as it can cause a slowdown in the system. Also, it's recommended to profile your application in different scenarios such as high load, low load and normal load.
Optimizing Full Stack Applications with Profiling and Monitoring: A Practical Guide
Optimizing full stack applications can be a complex and time-consuming process, but by using profiling and monitoring techniques, developers can make it more manageable and efficient.
One of the key steps in optimizing a full stack application is identifying performance bottlenecks and problem areas. Profiling tools can be used to analyze the performance of different components of the application, such as the front-end, back-end, and database, and pinpoint the areas that need improvement. Once the problem areas are identified, developers can focus on optimizing them by using techniques such as reducing the complexity of the code, caching, database optimization, and scaling.
Performance monitoring can also play an important role in optimizing full stack applications. By monitoring the performance of the application over time, developers can identify patterns or trends in performance and make adjustments as necessary. This can include modifying the code, adding more resources, or making other changes to improve performance.
Combining profiling and monitoring can provide a comprehensive view of the application's performance, which can help developers make more informed decisions about how to optimize their application.
It's important to note that optimization is an iterative process, and you may need to repeat the process of profiling, monitoring, and targeting problem areas multiple times to fully optimize your full stack application.
In conclusion, optimizing full stack software is crucial for ensuring that your application runs smoothly and performs well under heavy load. Profiling and monitoring techniques are two key tools that developers can use to identify performance bottlenecks and problem areas, track overall performance, and make targeted improvements to improve performance. By focusing on the most critical components of your full stack, you can make targeted improvements that will have the biggest impact on overall performance.
It's important to remember that optimization is an iterative process, and you may need to repeat the process of profiling, monitoring, and targeting problem areas multiple times to fully optimize your full stack application. Additionally, it's crucial to test your application under load to identify and fix performance issues before they become critical, and to use monitoring and logging tools to diagnose and troubleshoot performance issues.
To take action, Developers should start by identifying the areas of their application that need improvement, and then use profiling and monitoring tools to gather more information about the performance of their application. They can use this information to make targeted improvements that will have the biggest impact on overall performance.
Additionally, developers can also follow best practices, remove unnecessary code, and use efficient algorithms to optimize their code. By following these steps, developers can optimize their full stack software, improve performance, and create a more responsive and scalable application.
I hope you find the information which you have been looking for. For more information or queries regarding any software development services you can contact us.
#business#coding#programming#softwaredevelopment#webdevelopment#softwaredeveloper#it#fullstack#javascript#python#java#technology#tech#react#mongodb
1 note
·
View note
Text
Application Performance Monitoring (APM) can be defined as the process of discovering, tracing, and performing diagnoses on cloud software applications in production. These tools enable better analysis of network topologies with improved metrics and user experiences. Pinpoint is an open-source Application Performance Management(APM) with trusted millions of users around the world. Pinpoint, inspired by Google Dapper is written in Java, PHP, and Python programming languages. This project was started in July 2012 and later released to the public in January 2015. Since then, it has served as the best solution to analyze the structure as well as the interconnection between components across distributed applications. Features of Pinpoint APM Offers Cloud and server Monitoring. Distributed transaction tracing to trace messages across distributed applications Overview of the application topology – traces transactions between all components to identify potentially problematic issues. Lightweight – has a minimal performance impact on the system. Provides code-level visibility to easily identify points of failure and bottlenecks Software as a Service. Offers the ability to add a new functionality without code modifications by using the bytecode instrumentation technique Automatically detection of the application topology that helps understand the configurations of an application Real-time monitoring – observe active threads in real-time. Horizontal scalability to support large-scale server group Transaction code-level visibility – response patterns and request counts. This guide aims to help you deploy Pinpoint APM (Application Performance Management) in Docker Containers. Pinpoint APM Supported Modules Below is a list of modules supported by Pinpoint APM (Application Performance Management): ActiveMQ, RabbitMQ, Kafka, RocketMQ Arcus, Memcached, Redis(Jedis, Lettuce), CASSANDRA, MongoDB, Hbase, Elasticsearch MySQL, Oracle, MSSQL(jtds), CUBRID, POSTGRESQL, MARIA Apache HTTP Client 3.x/4.x, JDK HttpConnector, GoogleHttpClient, OkHttpClient, NingAsyncHttpClient, Akka-http, Apache CXF JDK 7 and above Apache Tomcat 6/7/8/9, Jetty 8/9, JBoss EAP 6/7, Resin 4, Websphere 6/7/8, Vertx 3.3/3.4/3.5, Weblogic 10/11g/12c, Undertow Spring, Spring Boot (Embedded Tomcat, Jetty, Undertow), Spring asynchronous communication Thrift Client, Thrift Service, DUBBO PROVIDER, DUBBO CONSUMER, GRPC iBATIS, MyBatis log4j, Logback, log4j2 DBCP, DBCP2, HIKARICP, DRUID gson, Jackson, Json Lib, Fastjson Deploy Pinpoint APM (Application Performance Management) in Docker Containers Deploying the PInpoint APM docker container can be achieved using the below steps: Step 1 – Install Docker and Docker-Compose on Linux. Pinpoint APM requires a Docker version 18.02.0 and above. The latest available version of Docker can be installed with the aid of the guide below: How To Install Docker CE on Linux Systems Once installed, ensure that the service is started and enabled as below. sudo systemctl start docker && sudo systemctl enable docker Check the status of the service. $ systemctl status docker ● docker.service - Docker Application Container Engine Loaded: loaded (/usr/lib/systemd/system/docker.service; enabled; vendor preset: disabled) Active: active (running) since Wed 2022-01-19 02:51:04 EST; 1min 4s ago Docs: https://docs.docker.com Main PID: 34147 (dockerd) Tasks: 8 Memory: 31.3M CGroup: /system.slice/docker.service └─34147 /usr/bin/dockerd -H fd:// --containerd=/run/containerd/containerd.sock Verify the installed Docker version. $ docker version Client: Docker Engine - Community Version: 20.10.12 API version: 1.41 Go version: go1.16.12 Git commit: e91ed57 Built: Mon Dec 13 11:45:22 2021 OS/Arch: linux/amd64 Context: default Experimental: true
..... Now proceed and install Docker-compose using the dedicated guide below: How To Install Docker Compose on Linux Add your system user to the Docker group to be able to run docker commands without sudo sudo usermod -aG docker $USER newgrp docker Step 2 – Deploy the Pinpoint APM (Application Performance Management) The Pinpoint docker container can be deployed by pulling the official docker image as below. Ensure that git is installed on your system before you proceed. git clone https://github.com/naver/pinpoint-docker.git Once the image has been pulled, navigate into the directory. cd pinpoint-docker Now we will run the Pinpoint container that will have the following containers joined to the same network: The Pinpoint-Web Server Pinpoint-Agent Pinpoint-Collector Pinpoint-QuickStart(a sample application, 1.8.1+) Pinpoint-Mysql(to support certain feature) This may take several minutes to download all necessary images. Pinpoint-Flink(to support certain feature) Pinpoint-Hbase Pinpoint-Zookeeper All these components and their configurations are defined in the docker-compose YAML file that can be viewed below. cat docker-compose.yml Now start the container as below. docker-compose pull docker-compose up -d Sample output: ....... [+] Running 14/14 ⠿ Network pinpoint-docker_pinpoint Created 0.3s ⠿ Volume "pinpoint-docker_mysql_data" Created 0.0s ⠿ Volume "pinpoint-docker_data-volume" Created 0.0s ⠿ Container pinpoint-docker-zoo3-1 Started 3.7s ⠿ Container pinpoint-docker-zoo1-1 Started 3.0s ⠿ Container pinpoint-docker-zoo2-1 Started 3.4s ⠿ Container pinpoint-mysql Sta... 3.8s ⠿ Container pinpoint-flink-jobmanager Started 3.4s ⠿ Container pinpoint-hbase Sta... 4.0s ⠿ Container pinpoint-flink-taskmanager Started 5.4s ⠿ Container pinpoint-collector Started 6.5s ⠿ Container pinpoint-web Start... 5.6s ⠿ Container pinpoint-agent Sta... 7.9s ⠿ Container pinpoint-quickstart Started 9.1s Once the process is complete, check the status of the containers. $ docker ps CONTAINER ID IMAGE COMMAND CREATED STATUS PORTS NAMES cb17fe18e96d pinpointdocker/pinpoint-quickstart "catalina.sh run" 54 seconds ago Up 44 seconds 0.0.0.0:8000->8080/tcp, :::8000->8080/tcp pinpoint-quickstart 732e5d6c2e9b pinpointdocker/pinpoint-agent:2.3.3 "/usr/local/bin/conf…" 54 seconds ago Up 46 seconds pinpoint-agent 4ece1d8294f9 pinpointdocker/pinpoint-web:2.3.3 "sh /pinpoint/script…" 55 seconds ago Up 48 seconds 0.0.0.0:8079->8079/tcp, :::8079->8079/tcp, 0.0.0.0:9997->9997/tcp, :::9997->9997/tcp pinpoint-web 79f3bd0e9638 pinpointdocker/pinpoint-collector:2.3.3 "sh /pinpoint/script…" 55 seconds ago Up 47 seconds 0.0.0.0:9991-9996->9991-9996/tcp, :::9991-9996->9991-9996/tcp, 0.0.0.0:9995-9996->9995-9996/udp,
:::9995-9996->9995-9996/udp pinpoint-collector 4c4b5954a92f pinpointdocker/pinpoint-flink:2.3.3 "/docker-bin/docker-…" 55 seconds ago Up 49 seconds 6123/tcp, 0.0.0.0:6121-6122->6121-6122/tcp, :::6121-6122->6121-6122/tcp, 0.0.0.0:19994->19994/tcp, :::19994->19994/tcp, 8081/tcp pinpoint-flink-taskmanager 86ca75331b14 pinpointdocker/pinpoint-flink:2.3.3 "/docker-bin/docker-…" 55 seconds ago Up 51 seconds 6123/tcp, 0.0.0.0:8081->8081/tcp, :::8081->8081/tcp pinpoint-flink-jobmanager e88a13155ce8 pinpointdocker/pinpoint-hbase:2.3.3 "/bin/sh -c '/usr/lo…" 55 seconds ago Up 50 seconds 0.0.0.0:16010->16010/tcp, :::16010->16010/tcp, 0.0.0.0:16030->16030/tcp, :::16030->16030/tcp, 0.0.0.0:60000->60000/tcp, :::60000->60000/tcp, 0.0.0.0:60020->60020/tcp, :::60020->60020/tcp pinpoint-hbase 4a2b7dc72e95 zookeeper:3.4 "/docker-entrypoint.…" 56 seconds ago Up 52 seconds 2888/tcp, 3888/tcp, 0.0.0.0:49154->2181/tcp, :::49154->2181/tcp pinpoint-docker-zoo2-1 3ae74b297e0f zookeeper:3.4 "/docker-entrypoint.…" 56 seconds ago Up 52 seconds 2888/tcp, 3888/tcp, 0.0.0.0:49155->2181/tcp, :::49155->2181/tcp pinpoint-docker-zoo3-1 06a09c0e7760 zookeeper:3.4 "/docker-entrypoint.…" 56 seconds ago Up 52 seconds 2888/tcp, 3888/tcp, 0.0.0.0:49153->2181/tcp, :::49153->2181/tcp pinpoint-docker-zoo1-1 91464a430c48 pinpointdocker/pinpoint-mysql:2.3.3 "docker-entrypoint.s…" 56 seconds ago Up 52 seconds 0.0.0.0:3306->3306/tcp, :::3306->3306/tcp, 33060/tcp pinpoint-mysql Access the Pinpoint APM (Application Performance Management) Web UI The Pinpoint Web run on the default port 8079 and can be accessed using the URL http://IP_address:8079. You will be granted the below page. Select the desired application to analyze. For this case, we will analyze our deployed Quickapp. Select the application and proceed. Here, click on inspector to view the detailed metrics. Here select the app-in-docker You can also make settings to Pinpoint such as setting user groups, alarms, themes e.t.c. Under administration, you can view agent statistics for your application Manage your applications under the agent management tab To set an alarm, you first need to have a user group created. you also need to create a pinpoint user and add them to the user group as below. With the user group, an alarm for your application can be created, a rule and notification methods to the group members added as shown. Now you will have your alarm configured as below. You can also switch to the dark theme which appears as below. View the Apache Flink Task manager page using the URL http://IP_address:8081. Voila! We have triumphantly deployed Pinpoint APM (Application Performance Management) in Docker Containers. Now you can discover, trace, and perform diagnoses on your applications.
0 notes
Text
Advantages Of Being A Full-Stack Developer
Advantages Of Being A Full-Stack Developer
The field of full-stack web development is ripe with opportunities for anyone with an interest in technology and an understanding of how websites function on the cloud. Website developers with the skills to juggle the many moving parts of today's complex online applications are in high demand across all industries. The term full-stack developers refer to these programmers. Startups and large enterprises alike need full-stack developers because of their flexibility and ability to jump in and repair problems in any part of the technical ecosystem involved in rapidly and affordably creating a website for a profitable product. Since full-stack developers are in such high demand in today's businesses, an increasing number of young adults are choosing to enroll in full stack developer courses. However, before jumping to the benefits that this profession brings, let's have a firm grasp on what that term really means.
What Responsibilities Does A Full-Stack Web Developer Have To Take On?
A full-stack developer is someone who designs and builds both the front and back end of a website, including interactive data-driven apps and portals. To guarantee the proper functioning of the developed website, a full-stack web developer is fluent in many programming languages and uses a wide variety of development tools. In addition, a full-stack web developer can expertly handle crucial components of making web and mobile apps, which are in great demand in the whole online technology industry. Front-end web developers often have proficiency in Javascript, HTML, and CSS, whereas back-end developers know their way around Python, Ruby, and PHP. It's also possible to specialize in either front-end or back-end web development today, giving students more options when selecting a full-stack web development program. Furthermore, a full-stack web developer has up-to-date knowledge of databases like MongoDB, MySQL, Oracle Database, and SQLServer to facilitate web development. With the definition of a full-stack developer in place, we can go on to discuss some of the advantages of working in this field. Let's get started.

The Top Benefits Of Being A Full-Stack Developer
Enhanced Opportunities For Professional Advancement Full-stack web developers that can juggle several responsibilities and cultivate a never-ending curiosity for learning are increasingly sought after by corporations in place of software engineers. In addition, there is a great deal of room for accelerated development as more and more companies adopt this all-encompassing skill set to increase productivity and save costs. Furthermore, professional full-stack web developers claim a multi-dimensional and fast-tracked career advancement across enterprises ranging from globally renowned end-to-end business solutions to startups. Most full-stack web engineers began their careers as either front- or back-end website developers, but they soon advanced in their careers by learning and mastering all aspects of web development. Achieving Project Goals Quickly A full-stack developer's duties span a wide range, including integration, upgrades, back-end and front-end collaboration, and meeting client requirements. For this reason, a full-stack web developer must maintain a high level of familiarity with the APM (Agile Project Management) framework Scrum and its constituent parts. As a full-stack web developer, you have access to powerful technologies that enable you to rapidly advance your professional standing. This not only facilitates the implementation process by decreasing the dependence on other units but also speeds up the development of the website and yields cost savings. Greater Flexibility If you want to study all the facets of building websites, a full-stack development course is the best way to go. You'll be able to continue working with more flexibility across a variety of databases. With this heightened flexibility, you may have more control over the final product of your website design. Becoming a full-stack web developer will help you improve your knowledge of both PHP and CSS, which is useful no matter which language you like to work in. It's Among The Best-Paid Occupations Due to its impact on marketing and business, full-stack web development has become one of the most paid occupations in the world. This malleable method of full-stack development helps businesses stand out and fuels the expansion of revenue streams. In addition, a full-stack developer in the United States may expect an average yearly package of $100,677, the exact amount depends on the developer's experience and expertise. The greater compensation that is given to full-stack web developers is a direct result of the savings that they make for their employers. Their versatility ensures they are always in demand.

Final Words
In conclusion, we can say that knowledge of the back end, front end, and databases are just part of what it takes to be a full-stack web developer. The term full-stack web developer refers to a specialist with expertise in all aspects of web development, including technical know-how, excellent interpersonal skills, and project management chops. Read the full article
0 notes
Text
Why PHP Logging and Observability Are Essential for Modern Web Applications?
PHP logging is not just a debugging tool — it’s a core component of delivering reliable, high-performance applications. Whether you're managing a simple website or a complex enterprise solution, having effective PHP log management ensures that your application remains stable, secure, and easy to maintain.
Without properly managed logs in PHP, developers are often left guessing about the causes of bugs, performance degradation, and unexpected application crashes. That's why investing in the right logger in PHP and implementing a solid PHP observability strategy is crucial for development success.
Why is PHP Logging Important for Your Applications?
Every application, no matter how carefully developed, will encounter issues in production. These could range from simple user errors to major system outages. Without robust PHP logging, diagnosing and fixing these problems becomes incredibly challenging.
Logging in PHP helps track errors, monitor system performance, and trace the flow of code execution. It also assists in understanding user behaviors and identifying security vulnerabilities. By maintaining detailed PHP logs, teams can proactively address small issues before they escalate into larger problems.
However, raw logs alone aren’t enough. Developers also need effective tools like a PHP log viewer and PHP log analyzer to make sense of the information they collect. That's where Atatus comes into play.
Simplify PHP Log Management with Atatus
Atatus offers a modern and powerful PHP log management solution that goes beyond basic logging. It provides a complete platform to collect, monitor, search, and analyze logs in real-time. With Atatus, managing logs in PHP becomes streamlined and highly efficient.
Some key features of Atatus' PHP logging solution include:
Real-time Log Collection: Capture and centralize all your PHP logs across servers and applications.
Advanced PHP Log Viewer: Quickly search and filter logs using an intuitive dashboard.
Intelligent PHP Log Analyzer: Automatically detect patterns, errors, and anomalies to accelerate troubleshooting.
Custom Alerts and Notifications: Stay ahead of issues with instant alerts based on log events.
Using Atatus’ tools, you don’t just collect logs — you transform them into actionable insights. This dramatically reduces the time it takes to diagnose problems, improves team productivity, and enhances your application's overall performance and reliability.
Boost Your PHP Observability
Effective logging is a critical part of achieving full PHP observability. Observability means having deep visibility into the internal state of your application based on the outputs it generates, such as logs, metrics, and traces.
Atatus provides a complete observability solution that extends beyond PHP logging. By combining logs with performance metrics and distributed tracing, Atatus enables developers to fully understand their application's behavior. This allows teams to:
Pinpoint the root cause of issues faster.
Identify slow database queries, API failures, and code-level bottlenecks.
Optimize performance with real-time data insights.
In short, Atatus bridges the gap between logging PHP errors and achieving holistic system observability, helping teams deliver better applications faster.
Why Choose Atatus for PHP Logging?
Choosing the right logger in PHP can make a huge difference in how efficiently you manage and maintain your applications. Atatus stands out because it combines simplicity with powerful features that scale with your needs. Whether you are a startup developer or part of a large enterprise engineering team, Atatus offers the tools necessary for effective PHP log management and PHP observability.
No more manually sifting through endless log files. No more reacting late to production incidents. With Atatus, you get proactive monitoring, smart alerts, and a full picture of your application's health — all in one platform.
Conclusion
PHP applications deserve more than just basic error logs. They need a robust, intelligent logging and observability solution that empowers developers to act quickly and confidently. Atatus offers the perfect blend of PHP logging, analysis, and observability to help your applications thrive.
#phpapm#php logging#php logs#php log management#php observability#logs in php#logging php#logger in php#php log viewer#php log analyzer#php monitoring tool#php application performance monitoring tool#php performing monitoring tool#php apm#php apm tool#monitoring php performance#monitor php performance#monitoring php application performance
0 notes
Text
AppDynamics Training - IDESTRAININGS
What is APP Dynamics? APPDynamics is one of the most popular tools. APM empowers you to screen and deal with your entire application delivery biological system from a versatile application or program customer demand through your system, backend databases and application servers. The AppDynamics APM gives you a single view of your application scenario, allowing you to quickly explore the global perspective of the application you are assigned to, from call diagrams or unique case reports created on personal hosts. APP dynamics Production Architecture: Production architecture involves two key part specialists, as well as having a controller at the application insight stage and application knowledge stage. Operators come into four distinct fields, including end client specialist, application, machine, and database specialists, who report to the controller via HTTP, https, and never withdraw to the operator for security reasons. Operators also screen business conversions, which are the basic unit for APM. The End Client Operator is not necessarily packed with some Java content and it allows you to gain knowledge on how the End Client's perspective on how your application works. How Application Experts Reach Out in the Flavor Assortment that includes Java, .NET, C ++, PHP and Hub JS. The application specialist will screen the business conversion and provide you with in-depth data so that we can screen how the exchanges are running.
#AppDynamics ClassroomTraining, #AppDynamics OnlineTraining, #AppDynamics Trainings, #AppDynamics Trainingn in Hyderabd, #1AppDynamics Training, #1AppDynamics Training, #Best AppDynamics Training, #AppDynamics Training and Certification
#AppDynamics CorporateTraining#AppDynamics OnlineTraining#AppDynamics Trainings#AppDynamics Trainingn in Hyderabd#1AppDynamics Training#Best AppDynamics Training#AppDynamics Training and Certification
0 notes
Text
SAFEGUARD YOUR INTELLECTUAL PROPERTY WITH THESE 05 APPLICATION MONITORING SOFTWARE
After a long time, I was checking the latest applications to use in my work process. Suddenly, some thoughts came into my mind that took the face of a blog that you are reading right now.
For instance, let me know one thing before proceeding into the blog. Have you ever heard the term “monitoring”? What do you feel when someone speaks about tracking something? Is there any negative notion about this? If so, you will get clarified about the term monitoring that is not for one purpose.
In this digital doorway, people use several applications. To make work easy, we have hundreds and thousands of applications downloaded into our system. Especially in corporate premises, employees are allowed to use several applications during their office hours.
But, not all applications are essential to us. Many applications can be malicious to us. It can hack our system causing data leakage and insider threat. So, do we have an instant solution for it? Yes, we do.
WHAT IS APPLICATION MONITORING SOFTWARE?
Application monitoring software is to monitor applications used by the employees during their working hours. In an organization, the employers must check whether the applications downloaded in their stack are running smoothly without affecting user experience.
Here comes another term to be aware of, APM(Application performance management). Heard about it before? If not, let us talk about it.
WHAT IS APM OR APPLICATION PERFORMANCE MONITORING SOFTWARE?
Application performance monitoring software is to monitor and optimize the apps enhancing the user experience. There are many application performance monitoring software available out there in the market.
When you further roll into the blog, you will find a complete list of application performance management tools with their benefits and features to help you discover the best comprehensive tool that focuses on user experience.
Never mind: Never pronounce monitoring of employees negatively. These actions help to keep the confidential data of the organizations safe from hackers. Also, these actions can help employers stop using applications that can be dangerous to the systems.
TOP 05 APPLICATION MONITORING SOFTWARE TOOLS FOR YOU:
Below are the top 05 application monitoring tools with their benefits and key features to help you pick the best one that suits your organization.
1. DOTCOM-MONITOR:
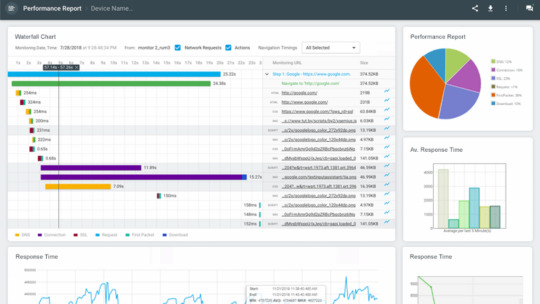
It is an application performance management tool that can record browser actions, navigation, cursor movements, and keystrokes. In addition to this, Dotcom-Monitor offers monitoring platforms like web view, browser view, metrics view, and server view.
KEY FEATURES:
It can monitor over 40 system’s browsers.
Its monitoring network is global.
It monitors behind a firewall.
Provide real-time information.
24*7 support.
2. STACKIFY:
This application monitoring software is to find troubleshooting, bugs, issues in production, etc. It is for optimizing application performance.
It supports common frameworks and discovers all the apps in your device automatically to help you monitor through SMS alerts and emails. With this tool, customers can also create their metrics and monitor the performance.
KEY FEATURES:
It supports PHP, .NET, and JAVA.
It performs deployment tracking to examine the performance of the applications.
Supports server monitoring.
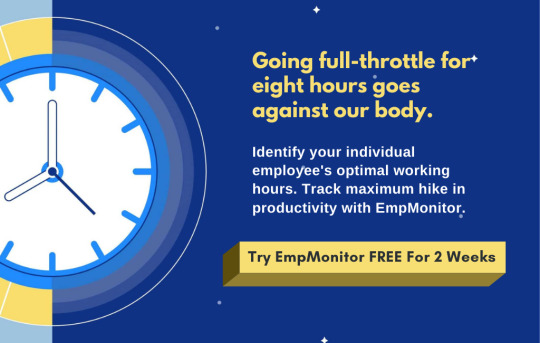
3. EMPMONITOR:
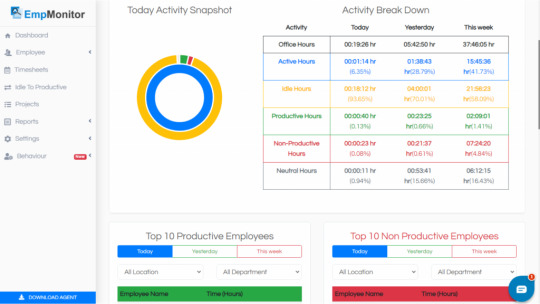
EmpMonitor is an application monitoring software that lets you gain insights into the top 10 applications used in real-time at a glance. It can analyze the apps used by your employees in the past 180 days. Dates can get adjusted accordingly.
It also monitors the browsing history and records every single visited website address. You can track URLs visited by your employees during their working hours. Here, you can view websites that your employees visited in the past 180 days.
With the help of this application monitoring tool, you can analyze if your employees are productive or unproductive.
The best part is, EmpMonitor is an open-source application monitoring software to experience 15 days free trial for five users. It comes with a package of keystroke monitoring, 360 degree productivity measurement, automatic screenshots, track browser history, and many more.
KEY FEATURES:
You can have a detailed report on the company productivity workflows through graphics of EmpMonitor.
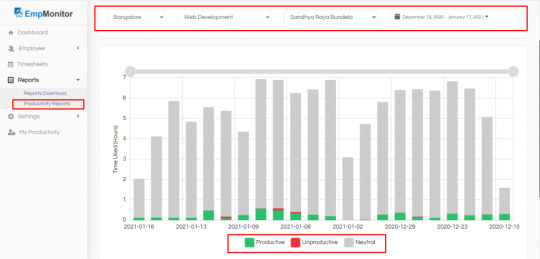
Real-time screenshots are captured automatically and produced in high quality. It is one of the best ways to keep an eye on your employee activities and secure company data.
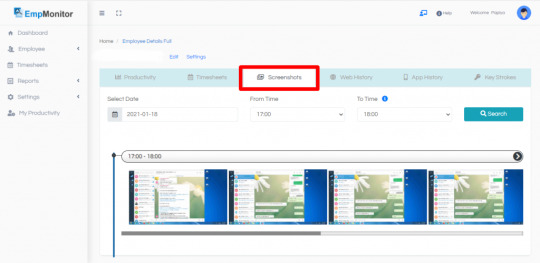
EmpMonitor gives you reports about the employees who are working currently.
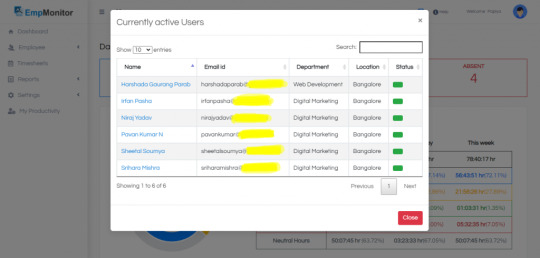
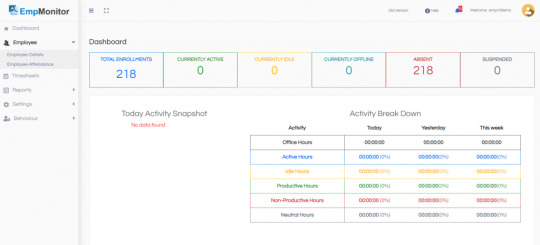
With the help of EmpMonitor, you can monitor and manage your employees from a single dashboard.
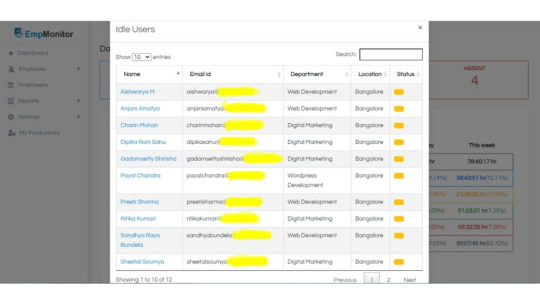
If your employees are not working and sitting idle at their workplace, you can monitor them and take action against them.
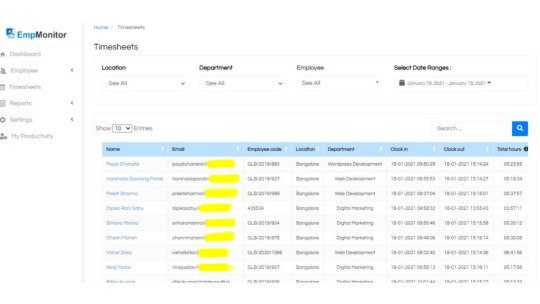
With detailed timesheets, you can track the time taken by the employees to complete a single task.
EmpMonitor supports operating systems: Windows and Linux.
4. NEW RELIC:
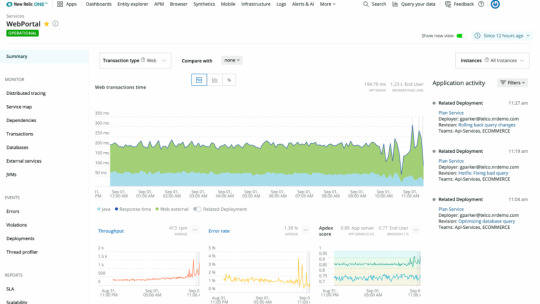
This application monitoring tool is to optimize applications used in the systems. It also monitors the performance of the applications and offers real-user monitoring offers.
KEY FEATURES:
Real user monitoring.
Synthetic monitoring.
Domain level problems.
5. CISCO:
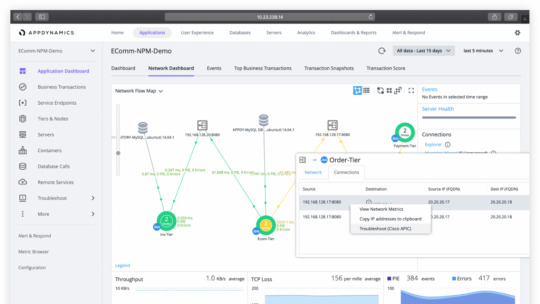
This monitoring tool includes end-user monitoring products. It manages application performance and has customizable dashboards to analyze app topology.
KEY FEATURES:
User visit data.
Transaction snapshots.
Supports java, PHP, .NET, Node.js, etc.
150+ integrations.
Are you confused? No worries. Here are a few tips which you can consider while choosing application monitoring software for your organization.
TIPS FOR CHOOSING APPLICATION MONITORING TOOLS:

Tip-1. It should have programming language support.
Tip-2. It should have cloud-based services.
Tip-3. Understandable features and easy to use.
Tip-4. It should provide real-time reports and analytics.
Tip-5. It should not include security issues.
Tip-6. Are you in search of low-cost or free trials? Pick the one who is offering free trials.
Tip-7. Is it available for 24*7? Do check once before you choose.
Choosing the right tools for your organization can help you expose blind spots in your existing premises. So, find your problems and choose the right solution for your organization with application monitoring tools.
14 Website Monitoring Software Every Company Should Look For In 2021 Top 09 HR Analytics Software & Tools Of All Time 8 Must Have Features For Employee Time Tracking System In 2021
TO WRAP UP:
With the help of application monitoring software, we can identify employee activities regarding few questions like, what type of application frequently used by the employees? Are those applications safe to use? Is there any malicious activity involved?
By monitoring application software, you can save yourself from security issues like data leakage and insider threat, as I have said earlier. From the above list, you can choose the best one for your organization by comparing the benefits and features acquired by all the tools.
I would have recommended you to go for EmpMonitor because I think it can stand out in the crowd of open-source application monitoring software.
Which is your pick up among these? Have you decided yet? Please share your experience with us. I hope you like this blog. If there is anything that I can do for you or anything that you want to add to this blog to make it more valuable, frame your voice in words and reach me through this comment box below. I would love to hear from you!
Originally Published On: EmpMonitor
#Employee Monitoring#Employee Management#Employee Productivity#Employee Monitoring Software#Application Monitor Software
0 notes
Text
Instana unterstützt die App-Produktion mit PHP und Python
Innerhalb des Performance-Monitorings unterstützt der APM-Dienst Instana nun auch das Produktions-Profiling für Apps in den Programmiersprachen Python und PHP. Read more www.heise.de/news/…-... www.digital-dynasty.net/de/teamblogs/…

http://www.digital-dynasty.net/de/teamblogs/instana-unterstutzt-die-app-produktion-mit-php-und-python
0 notes
Text
API Site Reliability Engineer
Role ? API Site Reliability Engineer (Apigee with CI/CD) Location ? Fremont, CA (3 positions) / Charlotte, NC (1 position) Role Overview: The API Site Reliability Engineer is part of the API Gateway team and is responsible to expose API products to our customers through the Apigee platform. They will develop and manage Apigee proxies/products and share them through Apigee Edge and Developer portal. These products will be used by multiple external systems for integrations with our systems. Experience with UNIX/middleware technology as a production support engineer. Skill : Java-Core Java 5.0-Microservice in Java Responsibility : 8+ years of experience. CI/CD tools - Jenkins, uDeploy, Ansible, Artifactory, Maven, etc. Apigee and its components ? Router, Message processor, Zookeeper, Management Server, Qpidd, Cassandra, Postgres and OpenLdap Microservices deployment on Tomcat Servers APM Tools (AppDynamics, Splunk, Wily, etc.) Perl, PHP, and Shell scripting Source Code Control (SVN, Git) General knowledge of Java/J2EE SQL (Oracle) " Reference : API Site Reliability Engineer jobs from Latest listings added - JobsAggregation http://jobsaggregation.com/jobs/technology/api-site-reliability-engineer_i9686
0 notes
Text
API Site Reliability Engineer
Role ? API Site Reliability Engineer (Apigee with CI/CD) Location ? Fremont, CA (3 positions) / Charlotte, NC (1 position) Role Overview: The API Site Reliability Engineer is part of the API Gateway team and is responsible to expose API products to our customers through the Apigee platform. They will develop and manage Apigee proxies/products and share them through Apigee Edge and Developer portal. These products will be used by multiple external systems for integrations with our systems. Experience with UNIX/middleware technology as a production support engineer. Skill : Java-Core Java 5.0-Microservice in Java Responsibility : 8+ years of experience. CI/CD tools - Jenkins, uDeploy, Ansible, Artifactory, Maven, etc. Apigee and its components ? Router, Message processor, Zookeeper, Management Server, Qpidd, Cassandra, Postgres and OpenLdap Microservices deployment on Tomcat Servers APM Tools (AppDynamics, Splunk, Wily, etc.) Perl, PHP, and Shell scripting Source Code Control (SVN, Git) General knowledge of Java/J2EE SQL (Oracle) " Reference : API Site Reliability Engineer jobs Source: http://jobrealtime.com/jobs/technology/api-site-reliability-engineer_i10400
0 notes
Text
API Site Reliability Engineer
Role ? API Site Reliability Engineer (Apigee with CI/CD) Location ? Fremont, CA (3 positions) / Charlotte, NC (1 position) Role Overview: The API Site Reliability Engineer is part of the API Gateway team and is responsible to expose API products to our customers through the Apigee platform. They will develop and manage Apigee proxies/products and share them through Apigee Edge and Developer portal. These products will be used by multiple external systems for integrations with our systems. Experience with UNIX/middleware technology as a production support engineer. Skill : Java-Core Java 5.0-Microservice in Java Responsibility : 8+ years of experience. CI/CD tools - Jenkins, uDeploy, Ansible, Artifactory, Maven, etc. Apigee and its components ? Router, Message processor, Zookeeper, Management Server, Qpidd, Cassandra, Postgres and OpenLdap Microservices deployment on Tomcat Servers APM Tools (AppDynamics, Splunk, Wily, etc.) Perl, PHP, and Shell scripting Source Code Control (SVN, Git) General knowledge of Java/J2EE SQL (Oracle) " Reference : API Site Reliability Engineer jobs from Latest listings added - JobRealTime http://jobrealtime.com/jobs/technology/api-site-reliability-engineer_i10400
0 notes