
original math and physics visualizations (some for Wikipedia)
Don't wanna be here? Send us removal request.
Statistics
We looked inside some of the posts by 1ucasvb and here's what we found interesting.
Average Info
Notes Per Post
10K
Likes Per Post
7K
Reblog Per Post
4K
Reply Per Post
18
Time Between Posts
6 months
Number of Posts By Type
Text
5
Photo
8
Note
3
Video
1
Last Seen Tumblr Blogs


Fun Fact
Women make up for the other 50% of Tumblr’s audience.
Text

Animation I've done for explaining part of my research.
26 notes
·
View notes
Photo

27 notes
·
View notes
Photo

A star is born. One of the prototype openings for the YouTube channel project. I have not given up on it, I just really need to get this academic life sorted out!
35 notes
·
View notes
Text
One of the best TV shows about physics is now on YouTube!
Caltech recently announced the release on YouTube of the excellent educational TV show The Mechanical Universe, which gives an accessible but still formal approach to physics and physics history.
The show pioneered the use of technical 3D animations as a way to explain complex math and physics concepts in an accessible way. The animations were created by none other than computer graphics legend Jim Blinn, and at the time were state of the art.
While the presentation may seen dated by today's standards (it was made in the 80's, after all), the show is still unparalleled in its depth when explaining physics to a general audience.
I highly recommend anyone who enjoys my animations to check it out.
HERE'S THE FULL PLAYLIST OF ALL EPISODES, which cover topics from classical mechanics, electromagnetism, relativity, quantum mechanics, and much more.
151 notes
·
View notes
Text
Vote on which topic you want to see covered next!
I'm planning a few posts in the near future, but I'm wondering which topic interests people more.
The topics I'm considering:
Mirrors of different shapes: I'll explore how rays and waves are reflected by different shapes, and some interesting properties of these shapes. I have more ideas beyond the typical parabolic/elliptical/spherical mirrors, so I'm sure there'll be more than the usual here.
Bees & voting systems: I'll explore alternative voting systems being proposed, but from a less techy & more intuitive and visual perspective. I'll also explain how bees have been using a system for millions of years and trillions of elections, and what we may be able to learn from them.
Snowflakes: I'll explore current research on how snowflakes are formed, what causes their symmetry and, hopefully, have an interactive, physics-based snowflake generator as opposed to the typical geometric ones you find everywhere.
Exponential growth: I'll explore how exponential growth appears in Nature and how our perception of these phenomena are inherently limited and potentially dangerous. I'll not go be going into the typical Malthusian population angle on this.
For all of these I'm hoping to include some interactive simulation or visualization.
If you have a Twitter account, be sure to cast a vote!
#math#physics#science#simulations#mirror#wave#ray#reflection#bee#bees#voting#voting system#exponential growth#snowflake#snowflakes
22 notes
·
View notes
Photo
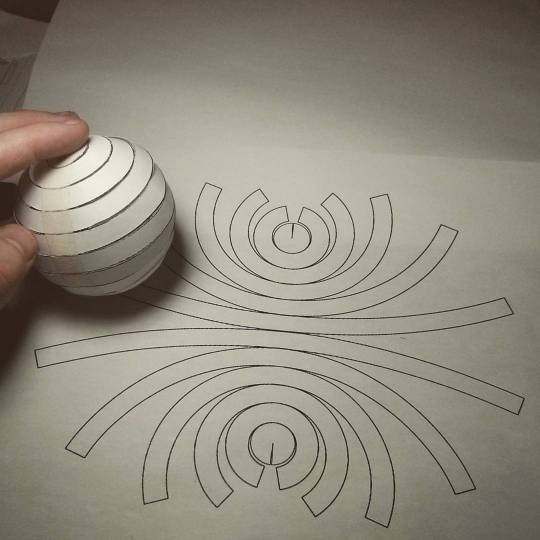
Can you flatten a sphere?
The answer is NO, you can not. This is why all map projections are innacurate and distorted, requiring some form of compromise between how accurate the angles, distances and areas in a globe are represented.
This is all due to Gauss's Theorema Egregium, which dictates that you can only bend surfaces without distortion/stretching if you don't change their Gaussian curvature.
The Gaussian curvature is an intrinsic and important property of a surface. Planes, cylinders and cones all have zero Gaussian curvature, and this is why you can make a tube or a party hat out of a flat piece of paper. A sphere has a positive Gaussian curvature, and a saddle shape has a negative one, so you cannot make those starting out with something flat.
If you like pizza then you are probably intimately familiar with this theorem. That universal trick of bending a pizza slice so it stiffens up is a direct result of the theorem, as the bend forces the other direction to stay flat as to maintain zero Gaussian curvature on the slice. Here's a Numberphile video explaining it in more detail.
However, there are several ways to approximate a sphere as a collection of shapes you can flatten. For instance, you can project the surface of the sphere onto an icosahedron, a solid with 20 equal triangular faces, giving you what it is called the Dymaxion projection.

The Dymaxion map projection.
The problem with this technique is that you still have a sphere approximated by flat shapes, and not curved ones.
One of the earliest proofs of the surface area of the sphere (4πr2) came from the great Greek mathematician Archimedes. He realized that he could approximate the surface of the sphere arbitrarily close by stacks of truncated cones. The animation below shows this construction.
The great thing about cones is that not only they are curved surfaces, they also have zero curvature! This means we can flatten each of those conical strips onto a flat sheet of paper, which will then be a good approximation of a sphere.
So what does this flattened sphere approximated by conical strips look like? Check the image below.
But this is not the only way to distribute the strips. We could also align them by a corner, like this:
All of this is not exactly new, of course. In the limit, what you have is called a American polyconic projection, which does require stretching in order to fill the gaps between the ending of the strips. Gauss's Theorema Egregium demands this.
But I never saw anyone assembling one of these polyconic approximations. I wanted to try it out with paper, and that photo above is the result.
It's really hard to put together and it doesn't hold itself up too well, but it's a nice little reminder that math works after all!
Here's the PDF to print it out, if you want to try it yourself. Send me a picture if you do!
4K notes
·
View notes
Text
“Why do some objects emit a 'pitchless' sound when hit, and others a 'tuned' sound?”
This question was asked today on Reddit's /r/AskScience by /u/silverben10, and I decided to pitch in and give an in-depth answer.
Below is a reproduction of my answer there. I figured my Tumblr followers might enjoy it as well.
In order to understand this better, we gotta talk about the frequency spectrum of a sound.
An important result in mathematics is that any "reasonable" function (exact details of what's "reasonable" don't matter for our case, as I'll explain in a bit) can be decomposed into a sum of a bunch of sines and cosines of different frequencies. This decomposition is called a Fourier transform of the function. Think of the sine and cosine waves as ingredients that you can add up together to make up the other wave. This is a great result because most functions are complicated, but sines and cosines are pretty simple.
Sound is a pressure wave, where pressure changes through time. So we can describe any sound by some pressure amplitude as a function of time, P(t). This is always going to be a "reasonable" function (pressure changes smoothly, doesn't go to infinity, etc), so we can decompose it into sines and cosines using a Fourier transform.
Adding a sine and a cosine of the same frequency together just makes another wavy function that's shifted around in time. That shift is called a phase. We can change the phase by changing how much of sine or how much of cosine we add together.
Here's an animation I did showing how to make a sinusoidal wave of constant amplitude but different phase (in green) by adding together a sine wave (in red) and a cosine wave (in blue), just by changing the amplitude of sine and cosine.
To simplify the math, we usually turn these two into a complex number, which are a compact representation of amplitude (how tall the wave is) and phase (how much it's shifted in time).
Here's a diagram of that. The blue and red lines are the amplitudes of the sine and cosine wave in that previous animation. The yellow angle is the phase.)
So the Fourier transform of our pressure wave, P(t), is going to be another function, Q(f) that gives us a complex number for a given frequency f of a wave.
This is like if someone gave you a cake, and you ran it through a machine that told you all the ingredients that went into making it, how much of each ingredient was used (the amplitude) and when it was added into the mix (the phase).
So now, instead of talking about amplitude of pressure at a time t, we talk about the amplitude (and phase) for a frequency f.
Both are complete descriptions of the same thing, it's just a change of perspective.
Now, when you hit a thing, you create a pressure wave that propagates through the object and bounces around inside of the materials that make it up. That energy goes into making it vibrate at several different frequencies.
The vibration of the surface of the object is what pushes air around and makes a pressure wave in air, which is what we hear as sound. We can use Fourier's trick to find out which frequencies are in this sound generated by the object when we made it vibrate.
To better visualize this, we can create a "spectrogram", which is just a graph that tells us how much of each frequency there is at each moment in time in the sound. This works by taking a "small slice" of the sound, running the Fourier transform on it, getting the amplitude of the complex number returned for each frequency, and squaring it. (The squaring part is important, because it's related to the amount of energy on each frequency.)
Here's a bunch of spectrograms of some sounds I made just for you. The vertical axis is frequency, and the horizontal axis is time.
The first two are the spectrograms for this sound file, which is the sound of a violin, clarinet, bassoon and trombone playing the same note (an F5 if I recall correctly, sorry, I already closed the program).
Linear scale spectrogram of four different instruments playing the same note.
The first graph is a linear scale. You can see how for each instrument, there's a bunch of nice, equally spaced horizontal stripes. The lowest stripe is usually the brightest and longest, meaning it has the most energy in it and takes longer to decay. This is the fundamental frequency of the sound of the instrument: this is the note it is playing. The other stripes are called harmonics, and they are all nicely spaced because they are always integer multiples of that fundamental frequency. (Sometimes, there are also other stripes that are not exactly integer multiples. Those are called overtones, and create an even richer sound.)
Notice how all these lines line up for all four instruments, since they are playing the same note: the fundamental frequency and its harmonics all match.
This is what makes them all "tonal". But the brightness changes between each, and also changes as time moves on (to the right) in different ways (different frequencies dissipate faster or slower for different instruments). It's this unique mix of frequencies and how fast they decay that makes all of them sound different.
Tonal instruments all have this characteristic "stripey" pattern.
Logarithmic scale spectrogram of four different instruments playing the same note.
The second graph is the same graph as before, but now on a logarithmic scale. Here, you can see more easily the frequencies that make up most of the sound. (check the scale on the right).
On the other hand, I also recorded me punching my table, and did the same thing to it. That's the last two graphs.
Linear scale spectrogram for the sound of a table being hit.
You can see that there's no nice structure to the spectrum in that case. No stripes show up in the spectrogram. It's just a mess, with a bunch of frequencies everywhere. (Those vertical lines are probably the different stuff on the table bouncing back on it.)
So there's no easy way to pinpoint a "pitch", because there's no one frequency that stands out in the sound, along with those stripey harmonics that make it sound richer and more interesting. (A single line in the spectrogram would sound like a pure, constant tone, like a tuning fork. Boring!)
And that's why some things don't really have a noticeable "pitch".
However, it's important to note that everything DOES like to vibrate at particular frequencies. The spectrum of the table being hit shows us exactly which frequencies the table "likes" to vibrate at.
But if these frequencies are not sharply defined, then they don't stand out in the spectrum of the sound the object makes, and neither will any of the harmonics stand out in relation to a fundamental frequency. They all just blend into a one big blob in the spectrum.
So the sound is just going to sound pitch-less, because there's no immediately apparent "main frequency" for the sound.
Bonus stuff: But why does our *ear* and *brain* care about any of this frequency stuff?
Well, it turns out, our ears work because they are pretty much doing a Fourier transform of the sound we hear!
The key component of our inner ear is the cochlea, which is a spiral shaped thing full of liquid with a bunch of tiny little hairs inside. The tiny little hairs like to vibrate at specific frequencies too, and when sound comes into the cochlea they vibrate and produce an electric signal.
So the cochlea and its little hairs are acting pretty much like the Fourier transform. This is why frequency components are so important to the way we hear.
#frequency#timbre#spectrogram#acoustics#science#question#fourier transform#signal processing#audio#sound
149 notes
·
View notes
Text
Frequently unanswered questions
Over the past couple of years I received a lot of messages and questions, but since I kinda disappeared from Tumblr at that time (due to work, studies, depression, etc.) I never got around to answering them. Answering some of them seems moot at this point.
I'd like to apologize to everyone I left hanging.
One of the most frequent questions/requests is for an expansion on the easing functions post. I'll work on a follow up for that one soon, and I'll explain the whole thing in more detail.
I promise I'll be around more in here, and I'll try to answer future questions in a more timely fashion.
Thanks for the love and support, and be excellent to each other!
16 notes
·
View notes
Note
Hi! I realise this is anonymous, but I still hope you might answer my question. I am a 24 y.o. medical student from Europe nearing the end of my MD. Incidentally, I have some spare change (due to programming work mostly) and I was considering starting a physics degree after I graduate. In your experience, how difficult is it to start doing high-level stuff this late? I never did anything beyond basic calculus and some linear algebra. Thanks so much! Oh, and loads of awesomeness on here and wiki!
Well, right off the bat, I can tell you I started my physics bachelor at 26, and I haven’t even graduated yet! (An exchange program set me back about a year and a half). So I know the feeling.
But I always kinda knew this is what I wanted to do. I started late because I had to work and save up money to move to a different city to study. I worked as a web developer in the meantime, doing things I didn’t quite enjoy, but it was means to an end.
While I never quite stopped studying or thinking about math and physics during those years, I’ve always done it rather informally. This hobby of mine of making math and physics animations has always been a major drive in my way of studying things on my own.
It’s very different when you have a formal environment that pressures you to learn things at a different pace from your own, and where you are constantly being judged for it.So it won’t be easy, that adaptation. It’s especially frustrating to see your younger peers handling it better than you are, mostly because they came straight from high school so the whole “school mindset” is still in place, and all those skills are still sharp and fresh. It’s also a sad reality that the older you get the worst it is to adapt to certain things.
That’s where most of the difficulty will come from, I believe. That’s how I felt about it. Some people handle that kind of pressure better than others. I’ve always been pretty bad at it, and I never believed I adapted well to it to this day.
But this difficulty is part of the process, and you have to remind yourself, constantly, that you accepted these terms when you embarked in this academic journey you chose. You keep going because you believe you’re going somewhere. Life choices can’t be fueled by sunk cost fallacies. That’s the worst way you could ever betray yourself.
If you truly believe that studying physics at this point in your life is worth of your time, your effort, and your resources, and if you believe that all the stress you’ll face is a necessary amount of discomfort that will be adequately rewarded later on, then by all means, go for it.
Just don’t do it “for the fun of it”. You can learn physics and math as a hobby if you just want to have fun with it. That only takes discipline and access to books.
But keep in mind that, unlike most areas of knowledge, you can’t quite jump into physics or math on a blank slate. Math (and physics) builds on top of itself, so if you are very rusty with algebra and basic physics you will fall behind, and you won’t be able to get much out of any of it.
This doesn’t mean you’re incapable of learning these things. It just means you’re rusty or lack foundations. So if you’re really into this plan, don’t wait until the first day of class to sharpen your basic math and physics skills. Start now. After all, that’s the only real way you can prepare for any of this.Best of luck!
18 notes
·
View notes
Note
Hi! My name is Joe. I'm a soon-to-be Physics freshman at the University of Colorado at Boulder. I admire your animations! I read in your FAQ that you use PHP/GD. I was hoping I could ask what is the "right track" for making my own animations and diagrams like you. I must make a Calculus presentation on the topic of quaternions soon; I would like to make animations for my presentation. I have some knowledge in Python but that's about it. Any help would be much appreciated! Thank you so much!
Oooh, quaternions! Awesome topic to tackle! I did a presentation on them once as well. It’ll be tricky, but wrapping your head around them pays off!I would suggest you try picking up Processing for this. It’s an incredibly easy language to pick up, and a very versatile language/platform to create animations in. It’s especially well suited for interactivity as well (keyboard, mouse, sound, video, you name it!)It also comes with most features you’d want right out of the box, like native 3D and geometric primitives. You should have no problem finding tutorials out there either.The reason I use my PHP/GD library is mostly because I’m already used to it and the workflow I created around it, and the set of features I ended up building on top of it (like tweening and progressive rendering). I’d be using Processing instead, if it wasn’t for the fact it is a bit too focused on real time rendering, which kinda breaks some of my rendering tricks (some of which require a looong time to render).
So yeah, I’d definitely recommend you try Processing!And good luck with your physics course! It’s hard, so work hard for it. It’s very rewarding and totally worth it! Cheers! :)
15 notes
·
View notes
Video
tumblr
In Einstein's General Theory of Relativity, space and time are unified in a single entity called spacetime. This is the "stage" in which the laws of physics operate.
In Einstein's theory, the presence of mass and energy warps spacetime, and it is this curvature that affects objects in the way we perceive as gravity. The basic idea is that while we see objects accelerating towards a mass by the effect of a force, in reality is just the object attempting to follow a straight line in this four-dimensional warped space described by General Relativity.
In other words, things fall because they are following a straight line in spacetime.
In usual illustrations, the bending of space is represented as a flat rubber-sheet with masses pressing down on it. This has always bugged me, as it didn't really represent the nature of 3D space being curved, and it never really addressed the fact that time is also distorted near masses.
This is my first attempt at a better depiction of the effects of General Relativity. Here, we see a 3x3x3 section of an imaginary spatial grid (that extends throughout all of space) being distorted by the presence of a mass. At the intersections of the grid lines there are clocks that show the rate of passage of time at each point in space, relative to a far away observer.
Notice how the clocks near the mass measure time at a slower pace than the clocks further away from the mass.
The distortion of spacetime is real, and can and has been measured experimentally several times. Modern telecommunication satellites and GPS systems all make use of the predictions of General Relativity in order to function.
While bizarre and complex, General Relativity has stood the test of time, and is one of the most well-tested and successful scientific theories ever conceived.
#einstein#general relativity#animation#illustration#physics#gif#video#spacetime#time#space#astrophysics#astronomy#cosmology
4K notes
·
View notes
Photo
Figured I'd add a mass in there.
See also: previous GIF.
2K notes
·
View notes
Photo

Hello, everyone! Yes, I'm alive! Here's a WIP of a thing I did while working on my next animation, explaining Einstein's general theory of relavitiy. I also got a MAJOR project coming up soon. Stay tuned for more information! :)
127 notes
·
View notes
Note
How much time does it take to you to make a simple animation? Which program do you use? Do you do it frame-by-frame or by interpolation? (by the way, this blog is the BEST!)
Takes me anywhere from 5 to 40 hours for an animation, maybe more for complicated stuff.For the programs I use, check my FAQ page.As for the animation, it’s neither frame-by-frame or interpolation, it’s a weird mix of both. All my animations are done entirely on code. I only use visual interfaces for adding text and controlling their animation, because doing this with code is usually rather terrible.Thanks for the support!
13 notes
·
View notes