
Statistics
We looked inside some of the posts by cogpsycho100 and here's what we found interesting.
Average Info
Notes Per Post
72K
Likes Per Post
37K
Reblog Per Post
34K
Reply Per Post
46
Time Between Posts
8 days
Number of Posts By Type
Text
8
Photo
7
Link
2
Last Seen Tumblr Blogs


Fun Fact
Post activity is at the highest at 4:00 pm EDT; notes peak at 10:00 pm EDT.
Text
I am now even more strongly in favor of removing sex and gender markers from identification and legal documents.
I see no reason for the government to collect and keep information about gender identity or assigned sex on an individual basis. The only time that question should be asked is during a census, and answering it should be voluntary.
Remove sex and gender markers from drivers licences, passports, voter registration cards, and birth certificates.
At best, legal gender/sex markers can be inaccurate. At worst? They can be weaponized by the state and used to enable oppression against already vulnerable communities.
Protect trans, nonbinary, gender non-conforming, and gender diverse lives.
#hm. I feel as though the way that data science is going though and with how out of hand adtech learning analytics and stuff are#the most important thing for me as a queer data scientist is to advocate not only for the privacy of marginalized groups#but to make sure that if people are going to be using their data at all#it's for the intention of improving the quality of life for that marginalized group or community.#and I am open to the possibility and probabilty that data science does not yield findings that should#drive policymaking or other areas.#I'm just concerned about the data and discussion already happening around gender. The goal rn must be to complicate#traditional understandings of gender. That means acknowledging the limitations surrounding developmental science's inquiries into gender and#sexuality.#that means that there have to be people devoted to both research and the support of these groups#otherwise we're left with a conversation around gender brought to us by... adtech and commercial organizations that have continued#to tunnel-vision mainstream views on gender into traditional configurations.#and this adtech is ran by capitalistic entities that typically aren't caring about queer people not even to a bare minimum.#what isn't going away is the idea that data can influence policymaking. though in my opinion 'data driven policy' needs to be#the basis for asking questions on 'what data' and what context is such inquiry taking place in.#If people and companies think data is a means to better privacy they will keep asking for it even in the most granular essentialized ways
12K notes
·
View notes
Photo


@Oga_DoctorBlue continuing to post about black Americans and healthcare, positive ways to further the discussion, etc… It’s not just that diversity matters, though that’s one way to phrase the problem and to try to get others to act for the cause. However, we need to get used to thinking of our engineers, doctors, and health care professionals as people who’s work actually involves other people. Workers in these fields are constantly communicating with others and informing policy that closely affects the lives of the people they’re working with. Just because these fields are known allegedly for being more technical and academically rigorous, doesn’t mean that issues of “understanding” and culture are somehow isolated from the workplace. Technicality doesn’t work like that. The work in these fields is heavily involved with and, therefore, should be centered around a wholesome sense of the well-being of other people. The expectation needs to be there that people taking on technical work will also take on issues of communicating with and understanding the people they’re working with on fair terms.
8 notes
·
View notes
Text
Topic Modeling the #STEM hashtag on Twitter pt. 1
The main overhaul of work that I have completed this summer has been in creating implementations of the LDA topic modeling algorithm on the #Stem dataset’s text field. This looks only at the text of the 198000 tweets in my dataset and tries to discover the topics and subject-matter that occur in the tweets.
LDA is a statistical text mining algorithm for determining the abstract topics that occur among a set of texts or documents. Some of the key intuition behind LDA is that - Words have strong semantic info - A group of texts or documents that are all talking about the same topics will use similar phrases and groupings of words to describe each topic. - Latent/abstract topics can be discovered by identifying words and phrases that have a high probability of occurring together within a group of texts. An implementation of the LDA algorithm has to be given at least one parameter: The number_of_topics to look for among the texts. LDA is more formally called a “Bayesian Inference Model.” The algorithm presents a method by which we can calculate the probability of an event based on some common sense assumptions and the outcomes of previous related events. Bayesian Inference Models like LDA may typically implicate - Going through many loops/iterations where a prior probability is updated with observational evidence in order to produce a new and improved posterior probability.
How does LDA use probability?
There’s two more key assumptions or suggestions that the LDA algorithm implicitly makes.
Lda suggests documents are probability distributions of over latent topics Topics are probabilty distributions over words (doesn't work with frequencies but probability distributions) A probability distribution is an equation that links each possible outcome of a random variable iwth its probability of occurring... It's like an array showcasing a set possible outcomes alongside the probability of occurence for each outcome. Another way of translating these two statements is that LDA assumes that documents in a corpus are each just mixtures of proportions of words belonging to each topic in the model. It also assumes (or, it has to force it such that) topics themselves can be represented as a grouping of words. Whether or not these words all belong neatly to a widely agreed upon category is completely subjective. Still, there are metrics and tools that can be taken to ensure that the quality of LDA results are good.
Coherence score is a comparative metric for representing how coherent a set of words is with one aggregated number value. The higher the coherence score, the better. The coherence metric uses the top n number of words (top_n_words) that LDA uses to represent each topic and computes the average pairwise similarity for each term in each topic. It considers all the ways in which words from the same topic can be paired, references their probability of occurring among the texts, and evaluates how much each topic semantically supports each word pairing with respect to its probability. The actual framework for calculating this metric is known as a four-step process called the Topic Model Coherence Pipeline, popularized by Roder (2015). More intuition on the Topic Model Coherence Pipeline is available in this article from Rare Technologies explaining topic coherence.
Perplexity is a comparative metric for how well the theorized probability distribution by an LDA model compares to the actual distribution of words among texts. Multiple LDA models are typically created during text modeling with varying numbers of topics to find the LDA model with the lowest perplexity.
I created 10 lda models with varied options on text preprocessing. All terms were converted into lowercase and lemmatized to noun form, with stopwords removed and punctuation removed. I created these initial 10 models to see what the lda output would look like, and I added some additional terms as stopwords such as ‘th’ and ‘amp’ (short for ampersand character). I also added the Spanish stopword list as another preprocessing filter given that some topics were coming out exclusively in Spanish.
From here, I created 10 “no_filtering” models and 10 “all_filtering” lda models. These models varied in number of topics, with the first model having 10 topics, the final model having 40, and every other model increasing by a multiple of 5 topics. In theory, filtering overly used words as well as words that only occur once among the texts out from the lda topic model helps, further narrowing the text to just its most important parts for improving metric scores. So I was expecting this to make all of the models that had their text filtered to have better metric scores...
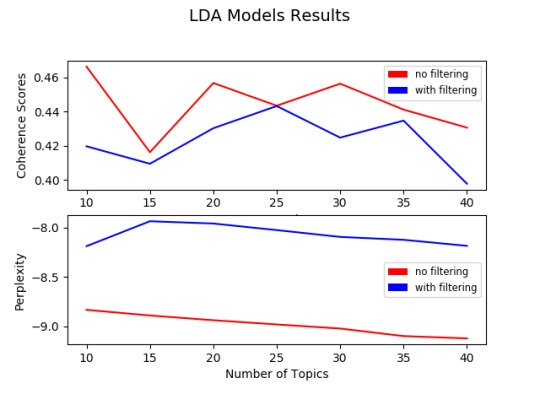
In the case of this twitter data however, this wasn’t the case. From this visualization of the 20 topic models, there isn’t a highly convincing area for a minimum or maximum. From reviewing the topic model results, I found that the no_filtering models, regardless of their perplexity or coherence, were less easily human-inferrable. In comparison, the “with filtering” models produced topics with keywords that made the topic better for human-inferrability.
Below are the top 30 terms identified by one of the best performing LDA Models. This LDA model used “all_filtering” with 35 topics to search for.

The above listing captures several different hashtags and keywords relating to educational spaces. With terms like “school,” “education” “teacher” “student,” it doesn’t feel like STEM leaves the classroom on twitter. People discuss STEM fields primarily from lenses of student life and education. hashtags such as #pbl, which stands for project-based learning, represent a call within this hashtag for innovative teaching strategies that inspire and engage students. Additional hashtags like #elearning reveal the potential alternative routes for traditional education that people use.
An additional tool used for help was the pyLDAvis package. This tool primarily helped with visualizing the topic models and comparing their topics. pyLDAvis condenses each topic model onto a 2d (x, y) coordinate. It uses the Jensen-Shannon divergence metric to calculate the difference among the topics (which, lda represents using probability distributions of keywords). pyLDAvis also helps you check to see which keywords are more likely to come up in other topics.
Below is output from the pyLDAvis for the “all filtering number_of_topics=35″ model previously referenced.

The term “#STEAM” is currently selected and bolded from Topic 4, which I titled “Engaging students with STEM using programming and robotics.” STEAM as a term that is gaining more common use and it is important for interdisciplinary applications of STEM such robotics and potentially programming. STEAM is important for emphasizing to students that STEM fields draw upon skills such as creativity and can overall be “fun” for youth.
In full, below are the two of the best performing LDA models as I observed in the visual above. The models are displayed in a table containing the topic number for each row, top keywords for the topic, as well as the manually inferred topics that I’ve created from looking at these topic models. It is suggested that the #STEM dataset consists of these topics for discussion, and that these keywords often appear together or in similar tweets.
Model: “All filtering t35″ Number_of_topics = 35 Perplexity: -8.12197670032475 Coherence Score: 0.43467503177842953


Model: “No Filter t20″ Number_of_topics = 20 Perplexity: -8.937124709552606 Coherence Score: 0.45663240775234504


0 notes
Text
I heard an ad on the radio that said something like "make the world better by tweeting with the hashtag (something related to Wells Fargo." I should probably make a post about that... and commodity capitalism... and also banking discrimination.
0 notes
Text
Week 5: Literature Review Draft and Updating
My decision to work with the #STEM data set imported from twitter from this past March to June [due to data science at George Mason, Dr. Johri & Sheridan, and colleague Karbasian H.] began when I read Chen et al. 2014’s paper, “Mining Social Media Data for Understanding Students Learning Experiences.” [link]. Chen wrote a paper that talked about data mining student for student experiences. Her paper involved analysis of over 19000 tweets under the hashtag #EngineeringProblems made by students at Purdue University In her paper, she urged for a combined qualitative and quantitative approach to understanding large scale data. Chen et al. (2014) states (p.245, explaining inductive/qualitative analysis)
Because social media content like tweets contain a large amount of informal language, sarcasm, acronyms, and misspellings, meaning is often ambiguous and subject to human interpretation. Rost et al. [2] argue that in large-scale social media data analysis, faulty assumptions are likely to arise if automatic algorithms are used without taking a qualitative look at the data. We concur with this argument, as we found no appropriate unsupervised algorithms could reveal indepth meanings in our data. For example, Latent Dirichlet Allocation (LDA) is a popular topic modeling algorithm that can detect general topics from very large scale data [40], [41]. LDA has only produced meaningless word groups from our data with a lot of overlapping words across different topics. There were no pre-defined categories of the data, so we needed to explore what students were saying in the tweets. Thus, we first conducted an inductive content analysis on the #engineeringProblems data set. Inductive content analysis is one popular qualitative research method for manually analyzing text content. Three researchers collaborated on the content analysis process.
Chen et al. 2014 voices a critique of the use of topic modeling techniques like LDA and Bag-Of-Words in text mining for social media data. In light of this critique, Chen et al. 2014 approached their data set of more than 19000 tweets under the hashtag #EngineeringProblems first using a personal qualitative “inductive analysis.” Prior to implementing any unsupervised programming, they instead had researchers work together to create categories or topics that they saw in tweets. The researchers read 2000 tweets initially to form these categories, but several rereadings and recodings took place. In sum, their paper resulted in feedback on student experiences within engineering. Chen et al (2014)’s efforts resulted in a Naive Multi-Label Classifier that could, given a tweet text, classify it accordingly to the human-planned inductive analysis categories. This way, their report focused on relationships among categories and frequencies of terms, as well as how students voiced their academic experience. My decision to work with the #STEM dataset came from extending Chen et al (2014)’s work to a question of “what can be learned about academic, professional, and learning experiences from the #STEM hashtag, a topic about the engineering discipline?” While I would be interested to find discussion of student wellness in this dataset, I need to learn what terms people actually use in this hashtag and what they talk about. #STEM is an extremely public hashtag that holds a great amount of representation engineering both educationally and as a career profession.
My paper will report upon the accuracy of a combined qualitative and topic model clustering techniques as applied to larger set of social media that captures STEM as a discipline, in scope as a profession, interest, and academically. One of the main objectives of my project is to create a model that can elaborately work with a large scale dataset of tweets made under a discipline, like the #STEM hashtag. I will be providing mostly descriptive information about what is discussed and participation (retweeting, favoriting, replying, response to real world events).
A similar inductive analysis will take place, however… At the moment, I’m still in preliminary stages of “what do people talk about in the #STEM hashtag?” It’s a rigorous undertaking to plan an elaborate approach for coding and categorizing such large scale data. My dataset is of 198000 tweets. While I am considering Chen et al (2014)’s caution towards unsupervised techniques that lack human interpretation, my dataset is muh larger. For my large data set containing data on experiences relating holistically to educating, and for other large data sets based on high level questions collected over long spans of time or with large sums of money for reliable feedback, there are many places to start with qualitative analysis. Ultimately, I haven’t found evidence so far the student wellness is regularly discussed within the #STEM hashtag. The basic scripts and visualizations I’ve created so far have gathered basic spatial and temporal figures for evidence. I have two geographical plots and one time series plot, each containing 12000 data points/tweets. The geographic plot is not fully accurate and show some of the challenges of geographic disambiguation. It is made using code to read twitter json files, find the part where a user manually types their profile, then searching for the corresponding geographical coordinates on google maps api.

Figure 1: Geocoding plot of each of the 12000+ randomly selected tweets among the #STEM hashtag.
This figure was created with python and matplotlib
Code (Windows 10 Python 2,7 Anaconda distribution): (see end of the post, Appendix A)

Figure 2: Slightly more visuallly appealing portrayal of geographical analysis

Time series plot, spans from March 13th to June 5th
I made one of my research questions almost immediately after seeing the time series plot, “why did activity increase in late may/June?” I predict that it’s due to graduations for prep schools, higher education institutions, and so forth. Perhaps the whole month of June has vastly increased activity, but data collection ended on June 5th.
All steps of the research process should be devoted towards exploratory but strategic actions towards social welfare. So I’m using these preliminary visualizations as well as my topic model to really learn what people talk about within this hashtag, before narrowing my focus towards issues of wellness (if that is even a viable focus within this hashtag at all) IA more strategically planned analysis could be carried out within the #STEM hashtag and the many co-occurring hashtags it’s connected to if I use a combined qualitative and unsupervised topic model approach to see commonly used keywords in the dataset. The demand from big data is to try to use data and learning analytics to generate meaningful bodies of information from social media, a space where self expression and corporate/managerial processes intertwine. Social media contexts collapse micro and macro level processes in terms of context (Hogan 2016, The Presentation of Self in the Age of Social Media... [ [link]). . It is inevitable that researchers will seek large scale analysis of data sets for educational data from social media and MOOCs because this is what is currently accessible. I actually hope to perform a combination of qualitative stes and topic modeling. I’ve moved towards topic modeling because I feel that best speaks to the following question:
To perform topic modeling, I actually am stepping back and trying to implement an improved LDA algorithm for understanding context and I’m looking into other methods. However, LDA because the output of a model implementing this algorithm is a set of text documents and a topic assignment for each document, as well as the list words used to comprise each topic. I just need to make sure that the list of words generated by LDA among each topic make human-sense, not just unsupervised machine clustering sense. There are at least efforts I an undertake, including
Omitting low frequency words from the LDA corpus/text data
Batch wise LDA (Bansal, S. 2016, Beginner’s guide to topic modeling in python, link
Appendix A:
Code Python 2.7, Windows 10, Miniconda/Anaconda dist
Using the Basemap package installed for matplotlib and geocoding (NO INDENTATION):
def plot_small_percent_of_data(small=False, save=False):
print "Plotting 12000+ geographical coordinates attained via the google maps api for tweets with the #STEM"
if small == False:
all_records = pd.read_pickle(PATH_TO_DATAFRAME_DIR + "clean_geographic_dataframe")
print "HEADER LIST :", list(all_records.columns.values)
if small == True:
all_records = pd.read_csv("csv_dir/small_api_loc_with_coordinates.csv")
x_cords = list(all_records['longtitude'].values)
y_cords = list(all_records['latitude'].values)
# bug with basemap where the latlon keyword for .scatter(latlon=True) where it will only plot coordinates
# when they are sorted in order of smallest longitutde to largest
x, y = list(zip(*sorted(zip(x_cords, y_cords), key=lambda it: it[0]))) # sort coordinates
pairs = zip(x, y) # UNUSED VARIABLE
If verbose == True:
print x_cords
print y_cords
plt.figure(figsize=(12, 6))
map = Basemap(projection='robin', lon_0=180)
mscattered_plot = = map.scatter(x, y, latlon=True, marker='.', color='g', s=24, zorder=10)
map.drawparallels(np.arange(-90,90,30),labels=[1,0,0,0])
map.drawmeridians(np.arange(map.lonmin,map.lonmax+30,60),labels=[0,0,0,1])
map.fillcontinents(color='coral',lake_color='aqua')
map.drawcountries()
plt.title('Small Amount of Data Plot')
plt.show()
if verbose == True:
print(all_records['manual_location'])
print "PAIRS"
print pairs
#social media#data analytics#data#data analysis#big data#twitter#STEM#engineering#education#computer sience#computer programming#reu#research
0 notes
Link
The following link contains an algorithmic translation of the socratic method. The socratic method is a form of question and answering. The algorithm provided in this article by Aytekin (2017) would work with the following pseudocode, derived from this youtube video
step 1 : get a definition of concept step 2 : question that brings up exception step 3 : get a new definition of concept repeat until steps 1,2 and 3 : there is no undefined/unclear concepts or you get essence of argument or you learn what you havent known before.
So if that’s the case... to annotate each step. Steps 1 2 and 3 are all a condensed loop. You repeat those steps over and over to think about something until you get the three outcomes listed in the remainder of the algorithm. Let’s just annotate this cuz maybe some day people could come back to it. This post related to concept formation and Socratic method. If someone sought to create a model or program based off of the socratic method and human found ways of concept formation to apply them, this would kinda give my interpretation of each step based on how I predominantly use object oriented programming languages like Python also artificial intelligence and data analytics. This is probably pretty introductory info. But it’s also a iittle niche and when I write this, as I reference authors for their ideas and it might seem intimidating to plunge into and read. I’m taking that into account.
Step 1: get a definition of a concept. Aytekin states that we get an “inital” definition of a concept. A question that follows is, how do we construct an initial defintion? Where does that come form? What resources does it draw upon in terms of thinking and brain activity? My guess is that the “initial definition” of any concept is put together by an array of initial properties. All existing concepts and knowledge Properties, as in, a list of definitions or true statements about an entity that help convey their meaning. There’s perhaps some computation done on these initial properties so that you end up thinking more precisely about what properties and formulate the most relevant. concept. Note that all existing concepts and properties and knowledge exist in memory.
Step 2 : get a question that brings up an exception
This introduces a new/special object called a “question.” The question raises an exception. It’s probable that both the question and the exception have a clear relation to the initial definition created in step 1 of the concept. Perhaps they’re inherited objects that share all the same properties and a different ones that properly articulate the question and the exception to the initial definiition. Intervention is then required.
Step 3 : get a new definition of a ooncept
The new definition of the concept is similar to the initial definition... it probably just gets stored in the same place as the initial definition. If there are additional proerties, or if relationships and connections between properties change, then they have to also be recorded in this new definition variable. And it gets stored in memory. Perhaps new oonnections that weren’t previously in memory have to be formed.
Then this comes out to one of the three out comes.
There is no undefined/unclear concepts
So this assumes that a person is building an array of concept objects or definitions and all of them have been classified as “unclear” or “undefined” or unresolved. They’re concepts that you can’ quite all accept as acceptable and true because they don’t make sense when you put them together; puzzle pieces that appear to not to fit together. You’re building up these items.
Or you get the essence of the argument & Or you learn what you have before are kind similar to each other cuz neither directly involve a low level object-oriented explanation like “simple array of concept objects.” They instead involve a higher level explanation of outcomes.
#toedit#socratic method#cognitive psychology#digital humanities#computer programming#computer science
1 note
·
View note


Photo
Openly sharing this to make my job seem cooler than it actually is

SP. 113 - Ghost in the Shell (1995)
Coding.
7K notes
·
View notes
Text
Byron - Joint PI 2018 reflection post
I definitely recommend checking the previous post I made about poverty prior to reading this! I decided to separate both posts because I feel like we can only handle so many walls of text at one time.
At the 2018 Joint PI Meeting hosted by the National Science Foundation, I talked with Dr. Rendall about his project on investigating the poverty statistics on black and hispanic/Latinx children. Dr. Rendall’s dataset included records from the 2005-2011 American Community Surveys, which provided information about dating partner preferences among Americans and key info on white non-hispanic new mothers, black new mothers, and hispanic new mothers. His project is an attempt to answer the question of why black and hispanic children are disproportionately born into poverty. In trying to measure poverty and quantify it for this experiment, Dr. Rendall uses the characteristics of the mother, their preferences, in addition to to the characteristics and resources of other key partners in the mother’s life (i.e. family, spouse, close friends that provide financial support). The focus on relationship pairing and support comes from the fact that racial minority groups like black women tend to have the lowest partner prospects and preference by others. Familism is a commonly adapted strategy especially for single mothers to garner support.
“This model allows us to analyze the difference between Black and Hispanic women’s versus non-Hispanic White women’s poverty risk at the time of giving birth, as being determined (1) by own resources, specifically the human capital represented by own educational attainment, and (2) by the resources the woman draws on through a partner’s human capital or, in the case she is not married or cohabiting, of others in the household in which she is a member. “
This experiment was ran through counterfactual simulations guided by a regression-decomposition. Now, this is the part of Dr. Rendall’s paper where my own mathematical background falls flat. But to my knowledge, the simulations created by Dr. Randall substituted the distribution of white characteristics such as educational attainment, relationship preferences (as indicated by responses of the survey about love interest preferences), and relationship availability (as indicated by who responded as single or in a relationship. The regression decomposition performed here is supposed to provide a more robust analysis of how each individual resources (personal characteristics) interact with external resources (partner’s educational level, preferences, etc…). Key findings reporting that for new mothers their partner’s level of education can may have a greater chance at helping them avoid poverty in years where the mother hasn’t given birth. Key findings also found that black and hispanic women may have lower levels of educational attainment when they marry in comparison to their white counterparts. Regarding the counterfactual simulations and substitution, when the distribution of educational resources among white populations is applied to black and hispanic populations, reductions of 8% and 4% respectively in the poverty of new mothers is observed. The authors note that a more greater component of disparity among the races if the difficulty that black and latinx mothers have in translating certain characteristics into successful poverty avoidance. Dr. Rendall offers that some may call this “the discrimination factor” of the work.
The conversation i had with Dr. Rendall at the PI conference was brief, but I expressed my own surprise at the contents of his project. Even in working at digitally advanced educational institutions like the Science Leadership Academy of Philadelphia, I just hadn’t heard of policymakers considering “simulating poverty” or other city-wide phenomena. Dr. Rendall expressed that at the end of the day, policy requires numbers and “evidence.” Although counterfactual simulations are always subject to the bias of the people who design them as well as the data that is chosen, the method provides systematically accumulated evidence. Considering that even the best of introspection is partial to one’s experience and identity, these methods are important for providing reproducible and generalizable evidence that others may confide in. The simulations that Dr. Rendall has created also seem to statistically complicate our understanding of poverty, so that we think specifically about cohabitation and relationship preferences. Relationships take things to a very personal level, so something that I admire about this work is the ability for it to provide a quantitative explanation of people’s experiences that is still dynamic and committed to conveying information about people’s interactions.
From reviewing and learning about this experiment as well as other counterfactual simulations, the one question that is left lingering on my mind is just… What can these simulations tell us that marginalized black and hispanic people cannot tell us themselves? While I support these experiments as rigorous systematic methods to acquire more knowledge about a notable human phenomena, I know that the need for a “quantitative answer” suggests that people generally don’t trust the marginalized to be accurate reporters of their own experience. We look towards the “quantitative answer” to better qualify the narratives and ideas expressed by youth. It also wasn’t necessarily the counterfactual simulations that felt the most convincing and eye-catching for me.
I still have further questions about the actual method of regression-decomposition. I also am curious about how in the creation of these simulations, how exactly did the researchers take into account feedback and commentary from black and hispanic new mothers themselves. I’ve sent an email out to Dr. Rendall asking for more about these questions, and will update as soon as I get a response!
#data mining#data science#digital humanities#counterfactual simulations#mathematics#stem#theory#experimental evidence
1 note
·
View note
Text
Some thoughts about poverty in research
The problem in most psychological research about poverty and development is the characterization of poverty as a static and unchanging factor of people’s lives. There’s difficulty in assessing how people marginalized by class identities live and interact within impoverished communities, and how individuals continue to seek survival and safe communities in these spaces. Niobe Way (#TODO: YEAR) points out that sometimes investigations into poverty from the scholarly end up being self-fulfilling. Way criticizes the immediate focus on high risk statistics, behavior that marginalized groups are constantly posed as more likely to encountering in their experience. Way’s criticism is not because high risk statistics themselves don’t propose a problem for communities facing poverty. The lack of social capital, coalitions, and resources that some communities face are urgent enough problems that require their own discussion. What Way worries about, however, is the information regarding people’s “everyday courage.” Not every adolescent youth in particular is engaging in high risk behavior or even seeking high risk behavior. However, Way states that a literature review would only describe the worldview of marginalized people through grim and depressing statistics, which might be quantitatively accurate, but aren’t qualitatively truthful to how that youth processes their own experiences. For example, student growing up in a community with high rates of violence might know that they know that they need to be careful and may speak about their discomfort towards that violence. But perhaps this violence isn’t known as “disproportionate violence,” but just “a need to be careful because it’s not always safe”-- this processing of experience avoids the academic world’s deployment of jargon and bleak statistics to frame the lives of marginalized people. The academic perspective is at a distance, given that much is written by people who more often than not come from upper class to middle class backgrounds. These individuals are much more likely to become teachers relative to racial minorities. So my background knowledge on poverty through the social sciences is that often, our framing of poverty is not complex enough to describe how an individual interacts with structures of poverty and marginalization throughout their whole life span.
Recommended book:
Way, N. Everyday Courage: The Lives and Stories of Everyday Teenagers, New York, NY, NYU Press, I would look for readings on ecological psychology theory, which offer that development takes place within the context of several nested topographical systems pertaining to various settings. Look for short chapters made by Urie Brofenbrenner
2 notes
·
View notes
Link
People working for Amazon have written to the company’s CEO, Jeff Bezos, to protest the sale of facial recognition tools and other technology to police departments and government agencies.
The workers cite the use of Amazon technology by the US Department of Homeland Security and the Immigration and Customs Enforcement (ICE) agency, which have been criticised for enforcing Donald Trump’s “zero tolerance” policy, which has seen parents separated from their childrenat the US border.
“As ethically concerned Amazonians, we demand a choice in what we build, and a say in how it is used,” the letter states. “We learn from history, and we understand how IBM’s systems were employed in the 1940s to help Hitler.
"IBM did not take responsibility then, and by the time their role was understood, it was too late.
"We will not let that happen again. The time to act is now.”
Holocaust experts claim IBM’s German subsidiary directly supplied the Nazis with technology which assisted the operation of concentration camps at Auschwitz and Treblinka.
In their letter to Mr Bezos, the Amazon workers said they would “refuse to build the platform” which powers ICE, or any technology used to violate human rights.
Listing three demands, the workers called on the CEO to stop selling the technology to law enforcement, stop providing infrastructure to partners which enable ICE, and implement stronger transparency measures.
“Our company should not be in the surveillance business; we should not be in the policing business; we should not be in the business of supporting those who monitor and oppress marginalized populations,” the letter concludes.
42K notes
·
View notes
Text
I got 99 tabs but I generally know where things are

Via https://twitter.com/lulu_cheng/status/964947708275343361
1K notes
·
View notes

Photo

Hello World 2.0
0 notes
Photo

The github logo except it’s actually Morgana from Persona 5
1 note
·
View note
Text
How I choose to define research
Research is an attempt to “translate” an experience, or to help others understand the experiences of other entities. I use the term “experience” broadly, to refer to both the relationships between entities, how the interact with one another, as well as information characterizing an entity. All experiences are grounded in a particular perspective crafted by the entities involved/witnessing it. Research, however, entails a commitment to rigor and systematic actions/planning to ensure that reports of others’ experiences can be understood truthfully and accurately. Rigor also plays an additional role of allowing scholars to remain in conversation with one another, identifying methodologies that are widely successful and methodologies that are not. While “truthfulness” and “accuracy,” are end goals for most research, the scope of research is limited to what trends, identities, common beliefs, and methodologies are present among the academic world. Researchers cannot just do research for the sake of it. Amid all of the effort and hard work, there still remains a question of “will I get funding/recognition for my research proposal?” Publications are often written with formal Standard English and with great technicality, making work inaccessible to people who do not have some level of background knowledge or academic prestige. Due to these barriers, I feel as though one of the most important tasks for researchers is to acknowledge their work as one single attempt at making others develop a similar understanding of an experience.
I had my first introduction to research through qualitative reports from scholarly educational journals. Educational research is more specific to discussing learning experiences throughout one’s lifespan. It is encouraged to recognize especially among research in social sciences that any individual research report represents one partial and unique inquiry. “Partial,” in that the decision-making used during research is often connected to, originates, and influenced by the context, and positionality that the researcher operates within. Many educational researchers are very direct about the fact that their research doesn’t come from a purely objective “all-seeing” eye. Introspection and subjectivity are seen as both precursors for bias, but also as meaningful influences on reporting and data collected. Qualitative educational research showcases a constant weariness of the personal biases of the author in producing their work.
It took a longer amount of time for me to begin reading psychology and computer science research papers. In these more technical fields, research is characterized as objective, scientific, and rationalistic. Furthermore because the subject matter of computer science and psychology may not implicate issues of identity and difference, researchers in these fields do not make the same reflections on positionality found in educational research; it’s far less common and not always necessary. However, there is a constant discussion on theory, testing hypotheses, shortcomings of a given study, and ideas for future work.
All introspection and discussion has to go through a partial and subjective filter, regardless of technicality. Research remains as a powerful social constructor and fund of knowledge for our experiences. We usually trust and look towards research as a source for understanding. Given the prestigious positioning of the scholarly world and its biases, however, I feel it’s important to acknowledge a publication as only one single attempt to guide others’ understanding.
1 note
·
View note