#BI dashboard software
Explore tagged Tumblr posts
Visit Tumblr Blog
Explore Tumblr blogs with no restrictions, modern design and the best experience.
Last Seen Tumblr Blogs


Fun Fact
In 2020, 44% of users from Denmark used Tumblr daily.
Text
Don’t Implement a BI Dashboard Tool Without Understanding These Key Performance Metrics
With 74% of companies planning to increase their investment in data analytics, the urgency to adopt BI dashboard tools is more pronounced than ever. Yet, success hinges not on the speed of adoption but on the precision with which these tools are utilized.

Our goal is to ensure that your BI tool isn’t just another software subscription, but a transformative force within your organization. Let’s delve into the metrics that matter — the ones that will define the success of your BI initiatives and, ultimately, your business’s competitive edge in the marketplace.
Critical Metrics for Evaluating BI Dashboard Tools Before Implementation
Implementing a BI dashboard tool involves more than just setting it up; it requires an understanding of the specific metrics that can determine its success or failure. This deeper dive into the critical metrics incorporates advanced technicalities and BI-specific information to ensure that your BI dashboard software not only functions efficiently but also aligns perfectly with your strategic objectives.
1. User Engagement Metrics
Understanding user engagement with your BI dashboard tool is very important. Metrics such as active users, session duration, and frequency of use provide insights into how integral the tool is becoming in the daily workflow of your team. For instance, a high number of active users and extended session durations typically indicate that the dashboard is delivering value, prompting users to rely on it regularly. These metrics help you gauge the dashboard’s usability and intuitiveness — key factors in sustained adoption.
To gauge the effectiveness of your BI dashboard tool, detailed user engagement metrics need to be considered:
Active Users: This metric tracks the number of distinct users who interact with the dashboard within a given timeframe. High activity levels are indicative of a tool that’s considered essential by its users.
Session Duration: Measures the average time users spend on the dashboard per session. Longer durations often imply that users find the dashboard useful for their analytical needs.
User Interaction Events: Advanced tracking of interactions, such as a number of reports generated, filters used, or custom views saved, can indicate how deeply users are engaging with the tool.
These metrics help identify not only the usability of the BI dashboard but also its integration into regular decision-making processes.
2. Data Quality Metrics
The adage ‘garbage in, garbage out’ holds particularly true for any BI dashboard software. Data quality metrics are crucial as they directly influence the reliability of the insights generated. Key metrics include:
Accuracy: Are the data points correct and reflective of reality?
Completeness: Does the data fully capture the required information without gaps?
Timeliness: Is the data updated frequently enough to support real-time decision-making?
Regular audits and feedback loops can help maintain high data quality, ensuring that your BI dashboard solutions are based on the most reliable and up-to-date information.
You can ensure the integrity of your BI systems, where decision-making depends on the integrity of the data presented, in the following manner:
Accuracy: Implement data validation rules and anomaly detection algorithms to ensure that the data reflects true and verified information.
Completeness: Use completeness checks to verify that all expected data fields are populated and that missing data notifications are configured to alert users when data gaps are detected.
Timeliness: Establish benchmarks for data freshness and set up real-time monitoring to ensure data is updated as frequently as business needs dictate.
3. Performance Efficiency Metrics
The technical performance of your BI dashboard tools can significantly affect user satisfaction and overall productivity. Important metrics to track include:
Load Time: How quickly does the dashboard populate data upon request?
Real-Time Processing: Can the tool effectively handle streaming data to deliver up-to-date insights?
These metrics are critical for businesses that rely on timely data to make quick decisions. You can ensure a BI tool’s performance parity in the following ways-
Load Time: Monitor backend performance to ensure data queries and visualizations load within acceptable time frames. Optimization may involve enhancing the data architecture or streamlining the data retrieval processes.
Real-Time Processing: Employ streaming data technologies and in-memory analytics to facilitate real-time data processing, crucial for dynamic and fast-paced business environments.
If a BI tool lags or fails to update promptly, it could lead to missed opportunities or flawed decision-making based on outdated information.
4. Adoption Rate Metrics
Lastly, measuring the adoption rate of your BI dashboard tool provides insight into its overall success across the organization. This metric assesses how quickly and broadly the tool is being used after its introduction. A slow adoption rate could signal issues with user training, dashboard complexity, or a mismatch between the tool’s capabilities and the users’ needs. Strategies to enhance adoption include comprehensive training sessions, regular updates based on user feedback, and executive endorsement to encourage utilization across all levels of the company.
Understanding the adoption rate involves several layers of analysis:
Initial Uptake: Measure how many users start using the tool within the first weeks of launch. Low uptake might indicate the need for more user training or adjustments to the dashboard’s interface.
Continued Usage: Track how usage trends develop over time. Are users continually engaging with the tool, or do they drop off after the initial phase?
Departmental Penetration: Analyze adoption across different departments to identify which teams are leveraging the BI tool most effectively and which may require additional support.
These metrics not only assess how quickly and extensively the BI dashboard tool is adopted but also highlight areas where further intervention may be required to increase its effectiveness across the organization.
Conclusion
As we’ve detailed, the careful evaluation of key performance metrics before deploying a BI dashboard tool is not just a step — it’s a strategic necessity. These metrics provide a compass that guides your BI initiative, ensuring it not only launches successfully but continues to deliver value long into the future. They empower your organization to leverage data with confidence, making informed decisions that propel your business forward.
At Grow, we understand the importance of this foundational step and support our clients through every stage of their BI journey. We encourage you to explore how our BI dashboard solutions can transform your data into actionable insights with precision and ease. Experience the full capability of our platform with a 14-day free trial and see how other businesses are achieving remarkable success with Grow by checking out Grow Reviews 2024.
Don’t let the potential of your data be hindered by unoptimized tools. Choose a BI solution that grows with you. Explore Grow today and step confidently into a data-driven future.
Original Source: https://bit.ly/3yNDzbZ
0 notes
Text
Designing Eye-Catching Dashboards in Power BI: Best Practices
In today’s data-driven world, turning raw numbers into meaningful visual insights is more important than ever. Power BI has become one of the leading tools for business intelligence and data visualization, enabling users to create powerful, interactive dashboards. But what makes a Power BI dashboard not just functional—but truly eye-catching?
In this article, we'll explore best practices for designing visually appealing and user-friendly dashboards using Power BI. Whether you're just starting with Power BI training or you're a seasoned pro, these tips will help elevate your data presentation skills.

Why Dashboard Design Matters
A well-designed dashboard improves decision-making by highlighting the right data at the right time. It enhances user experience, reduces cognitive load, and ensures that insights are quickly and clearly understood. Bad design, on the other hand, leads to confusion, missed insights, and ultimately poor decisions.
Best Practices for Designing Eye-Catching Dashboards in Power BI
1. Know Your Audience
Before diving into Power BI, identify who will be using the dashboard. Are they executives, analysts, or operations teams? Different users have different data needs. Tailoring the dashboard content and complexity to your audience is key.
2. Keep It Simple and Clean
Less is more. Avoid clutter by only including essential visuals. Use whitespace effectively to create breathing room between elements. A clean design ensures better readability and quicker insights.
3. Use Consistent Colors and Fonts
Maintain a consistent theme throughout your dashboard. Use your brand colors or predefined color palettes. Stick to 1–2 font styles and sizes for uniformity. This enhances professionalism and visual harmony.
4. Choose the Right Visuals
Bar charts, pie charts, line graphs, cards, maps—Power BI offers a range of visuals. Choose the one that best represents your data. Avoid fancy visuals just for aesthetics; ensure they serve a purpose.
5. Leverage Filters and Slicers
Interactive slicers allow users to slice and dice the data based on specific criteria. Filters improve usability and make the dashboard dynamic and personalized.
6. Highlight Key Metrics
Use KPIs and cards to draw attention to critical values. Place these visuals prominently so decision-makers can quickly scan the dashboard and identify performance indicators.
7. Use Tooltips and Drill-Throughs
Tooltips provide additional context without cluttering your visuals. Drill-throughs allow users to click on visuals and view detailed reports—offering both high-level overviews and deep dives.
8. Test on Multiple Devices
Power BI dashboards can be accessed on desktops, tablets, and mobile devices. Always test your design on various screen sizes to ensure responsiveness and usability.
Bonus Tip: Stay Updated with Power BI Training
Power BI is continuously evolving. Staying updated through Power BI training courses will help you explore new features, advanced visuals, and performance tips. Continuous learning is essential to remain competitive in the field of data analytics and business intelligence.
FAQs
Q1: What is Power BI? Power BI is a Microsoft business analytics tool that provides interactive visualizations and business intelligence capabilities with an interface simple enough for end users to create their own reports and dashboards.
Q2: Who can benefit from Power BI training? Anyone from business analysts to data scientists, marketing professionals to finance managers can benefit. Whether you're a beginner or looking to advance your skills, Power BI has something for everyone.
Q3: Is Power BI suitable for small businesses? Absolutely. Power BI offers scalable solutions for small to large businesses with flexible pricing and robust features.
Q4: How long does it take to learn Power BI? With dedicated Power BI training, most users can become proficient within a few weeks, depending on prior experience and commitment.
Q5: Where can I get expert Power BI training? You can visit our website for structured Power BI training programs designed by industry experts. Our curriculum covers everything from the basics to advanced dashboarding techniques.
Conclusion
Designing eye-catching dashboards in Power BI isn't just about aesthetics—it's about delivering the right insights in the most efficient way. By following these best practices, you’ll create dashboards that not only look great but also empower better business decisions.
Ready to master the art of Power BI? 👉 Visit our website for hands-on Power BI training, tips, and expert support!
#powerbi#dataanalytics#BusinessIntelligence#data#DataInsights#python#DataDrivenDecisions#tableau#DataTools#sql#dashboard#DataReporting#onlinelearning#analytics#courses#dynamics#bi#software#nareshit
0 notes
Text
Discover how Lumify360 with integrated Power BI empowers marketers to turn fragmented data into real-time insights, optimize campaigns, improve targeting, and boost ROI with intuitive dashboards, predictive analytics, and advanced reporting tools.
0 notes
Text

The role of business analysis in the corporate finance
Read the full article by clicking here
#bi tool#business intelligence software#bicxo#bisolution#businessintelligence#business intelligence#business solutions#data#businessefficiency#data warehouse#business analytics#finance and business analytics#inventory analytics dashboard#analytics#data analytics
0 notes
Text
Integrating IoT Data Streams into Business Analytics Software for Enhanced Insights
Have you ever wondered how much untapped potential lies within the daily operations of your business? Imagine harnessing every bit of data from every sensor, device, and digital interaction. The Internet of Things (IoT) is not just a buzzword — it’s a revolution in gathering and utilizing data, and it’s happening right now. But how do you transform this vast ocean of data into actionable insights?

In the coming six years, the world is expected to see more than 25 billion IoT devices connecting and streaming data (Source: Finance Online). But here’s the kicker — without the right tools to integrate and analyze this data, it might as well be invisible. That’s where business analytics software comes into play, turning the invisible into the indispensable.
Why Integrate IoT Data with Business Analytics Software? Think about the last time you made a crucial business decision. Was it based on a hunch, or was it informed by data? Integrating IoT data into your business analytics dashboard doesn’t just add volume to your data — it transforms your approach from reactive to proactive, from guesswork to precision.
Are You Ready to Dive Deep into Data-Driven Decision Making?
Join us as we explore how the seamless integration of IoT data streams into business analytics software can enhance your insights and propel your business forward. Whether you’re a data analyst crunching numbers, a business leader strategizing for the next quarter, or a BI professional looking to elevate your analytics game, this journey is for you. Let’s unlock the full potential of your IoT investments and turn data into your most valuable asset.
Key Technologies Facilitating IoT Data Integration
APIs (Application Programming Interfaces): APIs are the linchpins in the integration of IoT data with business analytics software. They facilitate seamless communication between disparate systems and devices without manual intervention. By using APIs, businesses can ensure that data collected from various IoT devices is systematically ingested into business analytics platforms. This not only streamlines workflows but also enhances data reliability and timeliness, which are crucial for effective BI analytics.
Middleware Solutions: Middleware acts as the critical intermediary that helps translate and route data from IoT devices to analytical software. This technology standardizes data formats, protocols, and communications, making it easier for business analytics tools to process and analyze data from varied sources. Middleware solutions can handle large volumes of data, thereby supporting the scalability requirements of extensive IoT frameworks. They also play a crucial role in data transformation, ensuring that the incoming IoT data is in the optimal format for analysis, which reinforces the importance of business analytics in decision-making processes.
The Role of Cloud Computing in IoT Data Management
Scalability and Flexibility: Cloud computing provides the scalability needed to manage the vast amounts of data generated by IoT devices. As IoT deployments grow, cloud platforms can dynamically adjust resources to handle increased data loads without compromising performance. This elasticity is vital for businesses that experience variable data inflow, ensuring that their business analytics dashboard remains robust and responsive.
Data Integration and Accessibility: Cloud platforms offer centralized repositories where IoT data can be aggregated, processed, and stored. This centralization ensures that data from multiple sources is available for comprehensive analysis on a unified business analytics dashboard. Furthermore, cloud computing enables real-time data access and analysis, which is paramount for industries requiring instantaneous insights to make critical decisions.
The Impact of Edge Computing on IoT Integration
Real-time Data Processing: Edge computing allows data processing to occur directly at or near the source of data generation (i.e., IoT devices). This proximity minimizes latency, facilitating faster decision-making which is integrated into BI analytics tools. Real-time processing is essential for scenarios where even a slight delay can result in significant operational disruptions or missed opportunities.
Bandwidth Optimization: By processing data locally, edge computing reduces the amount of data that needs to be sent to central servers or cloud systems. This not only conserves bandwidth but also reduces transmission costs and alleviates network congestion. For businesses, this means enhanced efficiency and reduced operational costs, highlighting the importance of business analytics in optimizing resource allocation.
Step-by-Step Guide to Integration
Step 1: Evaluate Your Current Infrastructure
Begin by assessing your existing IT infrastructure to determine if it can handle the scale and complexity of IoT data. This involves evaluating your network capabilities, data storage solutions, and computing power.
You should also pinpoint the various IoT devices and sensors within your organization. Understand the type of data each device generates and its relevance to your business analytics objectives.
Infrastructure Optimization: Beyond just assessing, consider ways to optimize your existing infrastructure. Implement edge computing solutions to process data locally on IoT devices, reducing latency and bandwidth usage. This preparation enhances your infrastructure’s ability to handle real-time data, crucial for dynamic BI analytics environments.
Integration Capacity Planning: Use predictive analytics to forecast future infrastructure needs based on expected growth in IoT data. This proactive approach ensures scalability and responsiveness, keeping your systems agile and efficient.
Step 2: Set Clear Integration Goals
Clarify what you aim to achieve with your IoT integration. Whether it’s improving operational efficiency, enhancing customer experiences, or boosting predictive maintenance, setting clear goals will dictate the integration process.
SMART Goals: Specify your integration goals using the SMART criteria — Specific, Measurable, Achievable, Relevant, and Time-bound. This precision helps in tracking progress and justifying ROI to stakeholders.
Feedback Loop Creation: Establish continuous feedback loops with end-users and technical teams to refine these goals based on real-world usage and challenges. This adaptive strategy keeps your projects aligned with business needs and technological advancements.
This alignment is also crucial so that you can justify investments and measure the impact of your IoT initiatives on your business analytics dashboard.
Step 3: Choose the Right Business Analytics Software
Select a business analytics software that can seamlessly integrate with IoT data streams. The software should be capable of handling large volumes of data in real-time and have robust data processing capabilities.
Feature-Specific Evaluation: Dive deeper into specific features that support IoT integrations, such as real-time data analytics, machine learning capabilities for predictive analytics, and customizable APIs for unique business needs.
Vendor Collaboration: Engage with software vendors to discuss potential customizations and support services. Establishing a strong vendor relationship can lead to tailored solutions that fit precisely with your organizational needs, enhancing the importance of business analytics.
Customization and Scalability: Opt for software that offers customization to meet your specific business needs and can scale as your IoT deployment grows. The importance of business analytics software lies in its ability to adapt and evolve with your business demands.
Step 4: Develop a Data Integration Plan
Map out how data flows from IoT devices to your analytics system. This includes identifying data endpoints, storage solutions, and any intermediary services like APIs or middleware.
Advanced Data Routing: Implement sophisticated data routing protocols that intelligently direct IoT data streams to appropriate analytics tools based on data type, source, and intended use. This ensures efficient data handling and quicker insights.
Compliance and Security Frameworks: Develop comprehensive security frameworks that comply with international data protection regulations like GDPR for European data and CCPA for Californian data. This will safeguard your data flows and build trust with your stakeholders.
In short, developing a data governance model that defines who has access to the data, how it is used, and how it is protected is more than important, as it is crucial for maintaining data integrity and security.
Step 5: Implement Data Processing Mechanisms
Given the real-time nature of IoT data, implement processing mechanisms that can analyze data as it comes in. This is essential for applications that require immediate insights, such as fault detection in manufacturing processes.
Data Enrichment: Enhance the value of your IoT data by integrating it with other business data sources. This can provide a more comprehensive view of your business analytics dashboard, deepening the insights into your operations.
Hybrid Processing Models: Consider a hybrid approach that combines batch processing for historical data analysis with real-time processing for immediate insights. This dual approach maximizes the utility of your data across different business scenarios.
Enhanced Data Enrichment Techniques: Utilize advanced AI models to enrich IoT data with predictive insights and anomaly detection. This can transform raw data into strategic information, making your business analytics dashboard a powerhouse of decision-making support.
Step 6: Visualization and Utilization
Integrate IoT data into your business analytics dashboard and customize your dashboard to display key metrics that are aligned with your integration goals. It is important to conduct training sessions for your team to ensure they understand how to use the new tools and data effectively. Adoption is critical to realizing the full potential of your BI analytics enhancements.
Interactive Dashboards: Design interactive dashboards that allow users to drill down into specific IoT data points. Enable customized views based on user roles and preferences, making the dashboard more relevant and actionable for different stakeholders.
Decision Automation: Integrate automation tools that initiate actions based on specific dashboard insights, such as adjusting supply chain parameters in real-time or alerting maintenance teams about potential equipment failures. This automation enhances the impact of your BI analytics by translating insights into immediate actions.
Step 7: Continuously Monitor and Optimize
Regularly monitor the performance of your IoT integration to ensure it meets your set objectives. This includes tracking the speed, accuracy, and reliability of your data insights.
AI-Driven Optimization: Employ AI algorithms to continually analyze the integration’s performance and suggest optimizations. This can identify unforeseen inefficiencies and opportunities for enhancement in real-time.
Sustainability Practices: Monitor the environmental impact of your IoT integrations and aim for sustainable practices, such as reducing data transmission distances and optimizing data storage solutions. This not only supports corporate social responsibility but also improves system efficiency.
Know that IoT and business analytics are dynamic fields, therefore, you ought to continuously seek ways to improve data integration and analysis based on feedback and new technologies.
Conclusion
Elevating Insights, Empowering Decisions
As we conclude our journey through the integration of IoT data into business analytics software, it’s evident that this technology is not just about collecting vast amounts of data — it’s about transforming that data into actionable insights that drive smarter, faster business decisions. This transformative power helps businesses not only stay competitive but also become leaders in their fields.
Grow’s advanced analytics platform exemplifies how seamlessly IoT data can be integrated, analyzed, and turned into strategic assets. By harnessing the capabilities of Grow, companies gain the clarity and precision needed to navigate complex markets and innovate continuously.Take Action and Transform Your Data Strategy
Why wait to tap into the full potential of your IoT data? Start with Grow’s 14-day free trial and experience how intuitive and impactful a well-integrated business analytics dashboard can be. See for yourself why countless businesses have shared positive feedback on “Grow.com Reviews & Product Details G2,” praising the depth and usability of insights provided by Grow.
This is your opportunity to step ahead and make data your most trusted ally in decision-making. With Grow, bridge the gap between data collection and business intelligence, and turn your IoT data streams into a fountain of actionable insights.
Discover the power of enhanced insights with Grow — where your data becomes your strategic advantage. Start your free trial today and join the revolution in business analytics.
Original Source: https://bit.ly/3ABp3nY
#business analytics software#BI analytics#importance of business analytics#business analytics dashboard
0 notes
Text
Best Power Bi Course at Naresh IT
Unleash the Power of Data with Naresh IT's Power BI Course
In today's data-driven world, the ability to transform raw data into actionable insights is critical. This is where Power BI comes in. By mastering this powerful business intelligence (BI) tool, you can create compelling visualizations, generate informative reports, and gain a deeper understanding of your business.
Naresh IT offers a comprehensive Power BI course designed to equip you with the skills you need to become a data rockstar. Here's what you can expect:
Dive Deep into Power BI:
Go beyond the basics: The course starts with a solid foundation in BI concepts and the role Power BI plays in transforming data.
Unlock the ecosystem: Learn about the entire Power BI landscape, including Power BI Desktop, Power BI Service, and Power BI Mobile.
Become a data wrangling pro: Master data loading, transformation, and manipulation techniques to prepare your data for analysis.
Craft Compelling Visualizations:
Tell a story with data: Learn how to create impactful charts, graphs, and other visuals that effectively communicate insights.
Go beyond the defaults: Explore customization options to tailor your visuals to your specific needs and brand identity.
Engage your audience: Discover best practices for designing clear and concise dashboards that resonate with viewers.
Empower Data Exploration:
Unleash the power of DAX: Learn Data Analysis Expressions (DAX) to write custom formulas and calculations for deeper data exploration.
Ask questions, get answers: Harness the power of Power BI Q&A to gain insights through natural language queries.
Share your findings: Learn how to effectively share reports and dashboards with colleagues and stakeholders.
Real-World Ready:
Project-based learning: Solidify your learnings through real-world project simulations that mimic practical scenarios.
Expert guidance: Benefit from the knowledge and experience of Naresh IT's industry-expert instructors.
Flexible learning options: Choose between live online classes with or without recorded sessions to fit your schedule and learning style.
Investing in Your Future:
A Power BI course at Naresh IT is an investment in your future. This versatile skillset can open doors to exciting career opportunities in data analysis, business intelligence, and other data-driven fields.
Ready to take the plunge? Visit the Naresh IT website to learn more about their Power BI course and transform your data into a powerful asset.
#powerbi#microsoft#businessintelligence#excel#dataanalytics#datascience#data#tableau#datavisualization#sql#dashboard#office#analytics#python#business#dynamics#bi#software#bigdata#digitaltransformation#azure#dataanalysis#powerapps#machinelearning#technology#microsoftpowerbi#cloud#businessanalytics
1 note
·
View note
Text
Empower Your Decisions with Custom BI Software

Enhance decision-making with Custom BI Software tailored to your business needs. This personalized solution transforms raw data into actionable insights, providing a competitive edge. Elevate your analytics game, making informed choices effortlessly. Embrace the power of Custom BI Software, empowering your business for strategic success. Level up your data-driven decisions today!
1 note
·
View note
Text
Mastering Efficiency: Retail Inventory Management Solutions
Business intelligence (BI) in the retail industry delivers comprehensive data on contact between customers and eCommerce stores. This data can allow merchants to make better business decisions. It can also assist brick-and-mortar stores in understanding client behavior, making merchandise adjustments, and altering prices accordingly. Business intelligence helps merchants be prepared for pricing, stock availability, trends, shipping, and more.

Optimize your retail operations with precision. Explore our advanced inventory management solutions for seamless efficiency and improved profitability.
#Benefits of BI in Retail#Best BI software for Retail Industry#BI for retail industry#BI in Retail Industry#BI solutions for retail#Business analytics in retail industry#Business Intelligence in Retail Industry#Business Intelligence Tools for Retail#Customer Behavior Analysis#Retail Inventory Management#Omnichannel Retail Analytics#Predictive Analytics for Retail#Retail Analytics Solutions#Retail Business Intelligence#Retail Competitive Intelligence#Retail Data Analysis#Retail Dashboard Solutions#Retail Intelligence Software#Retail Performance Metrics#Retail Sales Forecasting#Retail Marketing Analytics#Supply Chain Analytics for Retail
1 note
·
View note
Text
Exploring the benefits of Power BI software: Everything you need to know
Power BI is a business analytics service by Microsoft. It provides interactive visualizations and business intelligence capabilities with an interface simple enough for end users to create their own reports and dashboards.
Here are some key benefits of using Power BI:
Data Visualization: It allows users to create compelling, interactive, and visually appealing reports and dashboards. It supports a variety of data visualizations, including charts, graphs, maps, and tables, making it easier to interpret and analyze data.
Ease of Use: It has a user-friendly interface that allows both technical and non-technical users to create reports and dashboards. The drag-and-drop functionality simplifies the process of building visualizations, making it accessible to a broader audience.
Data Connectivity: It can connect to a wide range of data sources, including Excel spreadsheets, cloud-based and on-premises data sources, databases, and online services. This flexibility allows users to consolidate and analyze data from various sources in one central location.
Real-Time Analytics: It can be configured to work with real-time data streams, enabling users to monitor and analyze data as it is generated. This is particularly useful for businesses that require up-to-the-minute insights to make informed decisions.
Integration with Microsoft Products: It integrates seamlessly with other Microsoft products and services, such as Excel, Azure, and SQL Server. This integration enhances collaboration and streamlines workflows for organizations already using Microsoft's ecosystem.
Mobile Access: It offers mobile apps for iOS and Android devices, allowing users to access reports and dashboards on the go. This ensures that decision-makers have access to critical business insights regardless of their location.
Natural Language Processing (Q&A): Power BI incorporates natural language processing capabilities, enabling users to ask questions about their data in plain language. The system then generates visualizations based on the query, making data exploration more intuitive.
Security and Governance: It provides robust security features, allowing administrators to control access to reports and dashboards. It also supports row-level security, ensuring that users only see the data relevant to their roles.
Scalability: It can scale to meet the needs of both small businesses and large enterprises. It can handle large volumes of data and accommodate increased user loads as organizations grow.
Cost-Effective: It offers various pricing plans, including a free version with limited features. This makes it accessible to small businesses and individuals while providing the option to scale up as needed.
Get acquainted with Power BI in our blog.
#company development software#development company software#software company#power bi#power bi services#power bi dashboard#power bi tool#microsoft bi#software businesses#nitorinfotech
0 notes
Text
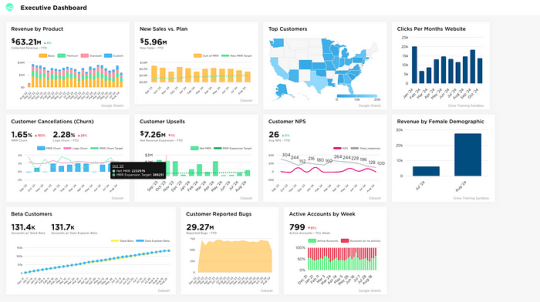
How to use a Power Bi Dashboard and make data visualization easy
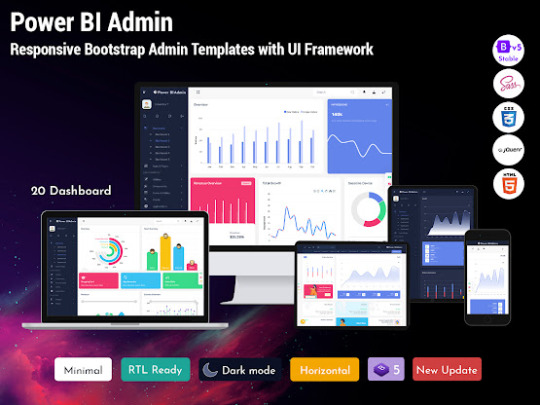
What is Power Bi Dashboard ?
In today's data-driven world, businesses are constantly seeking effective ways to analyze and interpret vast amounts of information. Dashboard Software have emerged as powerful tools that simplify the process of data visualization, allowing users to gain valuable insights at a glance. In this article, we will explore the significance of dashboard templates, their benefits, and how they empower businesses to make informed decisions with ease and efficiency.
Harnessing the Power of Visual Data
The human brain processes visual information more quickly and efficiently than text or numbers alone. Dashboard Software leverage this power by transforming complex data sets into visually appealing and easy-to-understand visualizations. With charts, graphs, and interactive elements, these templates enable users to quickly grasp patterns, trends, and correlations, leading to more informed decision-making and actionable insights.

Read More : Power Bi Dashboard
Like Us


#Power BI WebApp Template#Power BI Software#Power BI Software Dashboard#Power BI Admin Panel#Power BI Admin Ui Framework#Power BI Web Application Kit#Power BI Ui Kit#Power BI Software Ui Framework#Power BI Software Admin Panel#Power Bi Bootstrap UI Kit
0 notes
Text
Is This Integration Issue with Your BI Tools Costing You Efficiency?
The integration of Business Intelligence software tools involves the process of combining these tools from various sources to create a unified solution that allows for seamless data analysis and decision-making. At its core, BI dashboard software integration aims to consolidate data from disparate systems, ensuring that information is accessible and usable across all levels of an organization.
Common Goals of Integrating BI software tools in Business Environments
1. Streamlined Data Processes:
Efficiency: Integration of BI software tools reduces redundancy by ensuring that all data sources are aligned and communicating effectively, which, in turn, speeds up data processing and reduces errors.
Accuracy: A well-integrated BI tool for businesses ensures that data across the enterprise is consistent and reliable, which is critical for accurate reporting and analysis.
2. Real-Time Analytics:
Immediate Insights: One of the primary advantages of integrated BI dashboard software is its ability to provide immediate insights. Businesses can monitor operations in real-time, identify trends as they happen, and make informed decisions quickly.
Predictive Capabilities: Advanced BI software tools can analyze trends over time, predict future scenarios, and help businesses prepare proactive strategies rather than reactive measures.
3. Enhanced User Experience:
Accessibility: Integrated Business Intelligence software tools ensure that employees across different departments can access the data they need in a format that is understandable and actionable.
Empowerment: By democratizing data access, BI tool integration empowers employees at all levels to make informed decisions that align with business objectives.
4. Cost Effectiveness:
Resource Allocation: By automating data processes through integration, companies can allocate human resources to more strategic tasks, thus maximizing talent utilization and reducing costs.
Technology Investment: Effective integration maximizes the ROI of existing technological investments by enhancing the utility and reach of each BI tool within the business framework.
Identifying Key Integration Issues in BI Tools
1. Data Silos: Compromising Decision-Making and Accessibility
In the realm of business intelligence, data silos represent a formidable barrier to the seamless flow of information, significantly affecting decision-making and accessibility. As organizations grow and their data sources proliferate, these silos often emerge unintentionally, resulting from department-specific Business Intelligence software tools or historical data management practices. Understanding how these silos impact BI tool integration is crucial for businesses aiming to leverage their full analytical power.
Data silos occur when information is isolated within one department or team and is inaccessible to other parts of the organization. This segregation can result from using department-specific BI software tools, varying data capture methodologies, or incompatible data storage solutions. The isolation of data not only cripples the organization’s ability to make holistic, informed decisions but also complicates efforts to integrate various BI systems effectively.
When data remains confined in silos, even the most advanced BI dashboard software can fail to deliver its full potential. These silos create gaps in the data landscape, leading to incomplete analytics and insights that are skewed or biased toward the data that is accessible. For BI software tools to function optimally, they require a comprehensive dataset that reflects all facets of the business operations.
Implementing a unified BI platform that can integrate data from various sources, departments, and external entities. This integration ensures that all stakeholders have access to the same, updated data, facilitating consistent and informed decision-making.
2. Incompatibility Between Tools: Navigating Vendor and Format Challenges
Vendor lock-in and proprietary formats are common in the world of BI dashboard software tools, where different providers often develop their software to work optimally within their own ecosystems. This can lead to significant challenges when businesses attempt to integrate these tools with other BI systems or data sources, affecting the overall utility and efficiency of their BI infrastructure.
Vendor-Specific Challenges: Each BI tool for businesses might come with unique APIs, data formats, or user interfaces, which can complicate integration efforts when attempting to create a cohesive BI environment.
Format-Specific Challenges: Data formats vary widely among Business Intelligence software tools, and without proper standardization, the data must be transformed or translated before it can be effectively used, adding layers of complexity and potential data integrity issues.
The incompatibility between different BI dashboard software and tools can create several operational challenges:
Increased Complexity: Managing multiple BI software tools that do not integrate well requires additional resources and can lead to complex data workflows that are prone to errors.
Delayed Insights: When tools cannot communicate seamlessly, there is a delay in data processing and analytics, which can slow down decision-making processes.
Higher Costs: Additional costs may incur for custom integration solutions or third-party services to bridge the compatibility gaps.
Encouraging the use of standard data formats and open APIs can reduce the friction in integrating diverse BI software tools. This approach promotes a more flexible and adaptable BI environment.
Also, implementing middleware can serve as a bridge between different systems, facilitating data exchange and functional interoperability without altering the existing BI tools significantly.
Opting for BI software tools known for their compatibility with other systems or those that adhere to widely accepted standards can mitigate potential integration issues from the outset.
3. Real-Time Data Access: Addressing Synchronization Delays
Synchronization delays occur when there is a lag in the time it takes for data to be collected, processed, and made available for analysis. These delays are often exacerbated by integration issues within disparate BI systems, where data must be consolidated from various sources, often in different formats or from different vendors.
Incompatibilities between different BI software tools can lead to inefficient data synchronization, requiring additional processing to align data across systems. Delays in data synchronization can lead to outdated information being used to make critical business decisions, potentially leading to suboptimal outcomes.
Optimizing data pipelines for efficiency and speed by using advanced data integration technologies such as ETL (Extract, Transform, Load) tools and real-time data streaming services. This ensures that data moves seamlessly and quickly from source to BI dashboard software.
The BI users can also leverage cloud-based BI software tools to facilitate better scalability and real-time data integration. Cloud environments inherently support high-speed data processing and integration across geographically dispersed data sources.
Real-time BI dashboards are instrumental in overcoming synchronization delays. They provide a visual interface that updates continuously as new data flows in, offering up-to-the-minute insights that are crucial for rapid decision-making processes.
4. User Adoption: Simplifying Complexity to Enhance Productivity
Complexity in Business Intelligence software tools can arise from various factors including intricate interfaces, complex data integration processes, or lack of adequate training. Such complexities can deter users from fully engaging with the tool, leading to underutilization and inadequate data leveraging.
Technical Overheads: Many BI software tools require users to navigate complicated setups or understand advanced analytics, which can be daunting for non-technical users.
Integration Challenges: When BI tools are not seamlessly integrated, users may have to perform additional steps to access or interpret data, adding to the perceived complexity.
Simplified user adoption not only boosts productivity but also ensures that investments in BI are fully realized through comprehensive utilization. With more users effectively engaging with BI dashboard software tools, organizations benefit from diverse insights and more comprehensive data analysis.
Higher adoption rates lead to better utilization of BI capabilities, maximizing the return on investment in these technologies.
Employing user-friendly interfaces in BI dashboard software that simplify the user journey and make analytics accessible to all proficiency levels. This includes using intuitive navigation, clear visualizations, and straightforward reporting tools.
You can also implement feedback mechanisms to continually refine the tool based on user experiences. This ensures that the BI software tools evolve to meet user needs, reducing friction and enhancing adoption rates.
Conclusion
As we've unraveled throughout this discussion, the efficiency of your BI dashboard software tools hinges critically on how well they integrate. The journey from data silos to real-time analytics, and from complex tool interfaces to user-friendly dashboards, isn't just about leveraging technology—it's about transforming it into a strategic asset that drives your business forward. Integration issues, if not addressed, can indeed cost your organization not just efficiency but also opportunities for growth and innovation.
At Grow, we understand the complexities and challenges that come with integrating various Business Intelligence software tools. That’s why we've designed our platform with a focus on ease of integration, ensuring that you can connect all your data sources swiftly and start gaining insights in real time. Our solutions are built to empower your team, simplify your processes, and enhance your decision-making capabilities.
We invite you to experience the transformative power of Grow with our 14-day free trial. See for yourself how seamless integration can boost your operational efficiency and help you harness the full potential of your data.
Don't just take our word for it; explore what other users are saying on Grow.com Reviews & Product Details on G2. Discover how businesses like yours have elevated their BI strategies with Grow.
Make the smart choice today. Simplify your BI tool integration with Grow, and turn data-driven insights into actionable results that propel your business to new heights. Start your free trial now and lead your business with confidence and precision.
Original Source: https://bit.ly/3LYEAko
#Business Intelligence software tools#BI dashboard software#BI software tools#BI tool for businesses
0 notes
Text
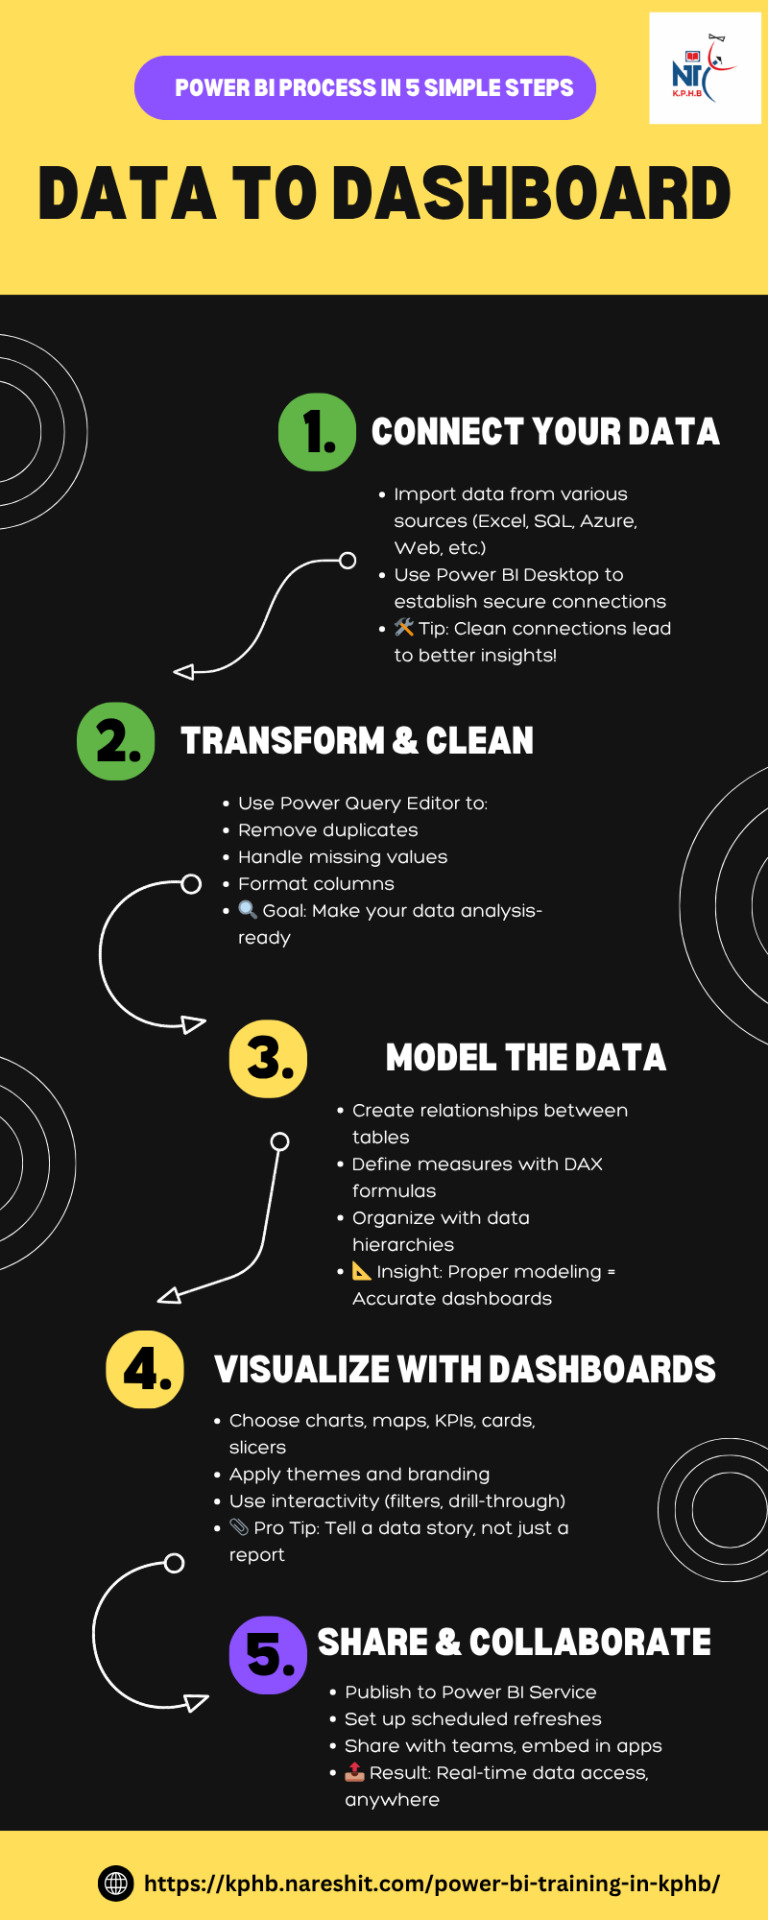
Data to Dashboard: Power BI Process in 5 Simple Steps
#powerbi#dataanalytics#BusinessIntelligence#data#DataInsights#python#DataDrivenDecisions#tableau#DataTools#sql#dashboard#DataReporting#onlinelearning#analytics#courses#dynamics#bi#software#nareshit
0 notes
Text
Data Analysis: Turning Information into Insight
In nowadays’s digital age, statistics has come to be a vital asset for businesses, researchers, governments, and people alike. However, raw facts on its personal holds little value till it's far interpreted and understood. This is wherein records evaluation comes into play. Data analysis is the systematic manner of inspecting, cleansing, remodeling, and modeling facts with the objective of coming across beneficial information, drawing conclusions, and helping selection-making.
What Is Data Analysis In Research

What is Data Analysis?
At its middle, records analysis includes extracting meaningful insights from datasets. These datasets can variety from small and based spreadsheets to large and unstructured facts lakes. The primary aim is to make sense of data to reply questions, resolve issues, or become aware of traits and styles that are not without delay apparent.
Data evaluation is used in truely every enterprise—from healthcare and finance to marketing and education. It enables groups to make proof-based choices, improve operational efficiency, and advantage aggressive advantages.
Types of Data Analysis
There are several kinds of information evaluation, every serving a completely unique purpose:
1. Descriptive Analysis
Descriptive analysis answers the question: “What happened?” It summarizes raw facts into digestible codecs like averages, probabilities, or counts. For instance, a store might analyze last month’s sales to decide which merchandise achieved satisfactory.
2. Diagnostic Analysis
This form of evaluation explores the reasons behind beyond outcomes. It answers: “Why did it occur?” For example, if a agency sees a surprising drop in internet site visitors, diagnostic evaluation can assist pinpoint whether or not it changed into because of a technical problem, adjustments in search engine marketing rating, or competitor movements.
3. Predictive Analysis
Predictive analysis makes use of historical information to forecast destiny consequences. It solutions: “What is probable to occur?” This includes statistical models and system getting to know algorithms to pick out styles and expect destiny trends, such as customer churn or product demand.
4. Prescriptive Analysis
Prescriptive analysis provides recommendations primarily based on facts. It solutions: “What have to we do?” This is the maximum advanced type of analysis and often combines insights from predictive analysis with optimization and simulation techniques to manual selection-making.
The Data Analysis Process
The technique of information analysis commonly follows those steps:
1. Define the Objective
Before diving into statistics, it’s essential to without a doubt recognize the question or trouble at hand. A well-defined goal guides the entire analysis and ensures that efforts are aligned with the preferred outcome.
2. Collect Data
Data can come from numerous sources which includes databases, surveys, sensors, APIs, or social media. It’s important to make certain that the records is relevant, timely, and of sufficient high-quality.
3. Clean and Prepare Data
Raw information is regularly messy—it may comprise missing values, duplicates, inconsistencies, or mistakes. Data cleansing involves addressing these problems. Preparation may include formatting, normalization, or growing new variables.
Four. Analyze the Data
Tools like Excel, SQL, Python, R, or specialized software consisting of Tableau, Power BI, and SAS are typically used.
5. Interpret Results
Analysis isn't pretty much numbers; it’s about meaning. Interpreting effects involves drawing conclusions, explaining findings, and linking insights lower back to the authentic goal.
6. Communicate Findings
Insights have to be communicated effectively to stakeholders. Visualization tools including charts, graphs, dashboards, and reports play a vital position in telling the story behind the statistics.
7. Make Decisions and Take Action
The last aim of statistics analysis is to tell selections. Whether it’s optimizing a advertising marketing campaign, improving customer support, or refining a product, actionable insights flip data into real-global effects.
Tools and Technologies for Data Analysis
A big selection of gear is available for facts analysis, each suited to distinct tasks and talent levels:
Excel: Great for small datasets and short analysis. Offers capabilities, pivot tables, and charts.
Python: Powerful for complicated facts manipulation and modeling. Popular libraries consist of Pandas, NumPy, Matplotlib, and Scikit-learn.
R: A statistical programming language extensively used for statistical analysis and statistics visualization.
SQL: Essential for querying and handling information saved in relational databases.
Tableau & Power BI: User-friendly enterprise intelligence equipment that flip facts into interactive visualizations and dashboards.
Healthcare: Analyzing affected person statistics to enhance treatment plans, predict outbreaks, and control resources.
Finance: Detecting fraud, coping with threat, and guiding investment techniques.
Retail: Personalizing advertising campaigns, managing inventory, and optimizing pricing.
Sports: Enhancing performance through participant records and game analysis.
Public Policy: Informing choices on schooling, transportation, and financial improvement.
Challenges in Data Analysis
Data Quality: Incomplete, old, or incorrect information can lead to deceptive conclusions.
Data Privacy: Handling sensitive records requires strict adherence to privacy guidelines like GDPR.
Skill Gaps: There's a developing demand for skilled information analysts who can interpret complicated facts sets.
Integration: Combining facts from disparate resources may be technically hard.
Bias and Misinterpretation: Poorly designed analysis can introduce bias or lead to wrong assumptions.
The Future of Data Analysis
As facts keeps to grow exponentially, the sector of facts analysis is evolving rapidly. Emerging developments include:
Artificial Intelligence (AI) & Machine Learning: Automating evaluation and producing predictive fashions at scale.
Real-Time Analytics: Enabling decisions based totally on live data streams for faster reaction.
Data Democratization: Making records handy and understandable to everybody in an business enterprise
2 notes
·
View notes
Text
How does data analytics help manufacturers optimize production lines?
Data analytics helps manufacturers optimize production lines by identifying inefficiencies, tracking equipment performance, and forecasting maintenance needs. With a product analytics dashboard, manufacturers can monitor real-time metrics, reduce downtime, and improve overall productivity while minimizing costs. Visit our website to know more my clicking here.
#business solutions#business intelligence#businessintelligence#data#businessefficiency#bisolution#bi tool#bicxo#business intelligence software#data warehouse#product analytics dashboard#manufacturing
0 notes
Text
Discover the Power of Data with Power BI: Revolutionize Your Analytics Strategy!
In the era of data dominance, deciphering valuable insights is paramount for strategic decision-making. Uncover the potential of your data with our latest blog on Microsoft Power BI.
Key Highlights:
- Seamlessly consolidate and analyze your data.
- Gain actionable insights at an unprecedented speed.
- Explore the dynamic world of business intelligence tools.
Table of Contents:
1. Challenges with Data: Overcome scattered views, diverse data sources, and timely data delivery hurdles.
2. What is Microsoft Power BI? Unlock the power of this cloud-based BI tool for quick data visualization and analysis.
3. How Power BI Impacts Your Data Analytics: Time-saving templates, security-focused features, and a user-friendly interface.
4.Take Advantage of Power BI's Features: Regular software updates, Excel integration, real-time analytics, better connectivity, customized dashboards, clear data insights, and an instant Q&A feature.
Ready to Revolutionize Your Business Strategy?
Stay ahead in the data-driven era. Power BI is not just a tool; it's a game-changer. Collaborate with ECF Data, where our Power BI experts are poised to assist your business in maximizing the value of data.
For further insights
Contact Us
https://www.ecfdata.com/how-power-bi-can-revolutionize-data-analytics-strategy/
#power bi service#microsoft power bi#power bi consultant#managed it services#managed service provider#it services in las vegas
2 notes
·
View notes
Link
2 notes
·
View notes