#Bitcoin bull market trends
Text
Bitcoin Price Predictions for 2024 and Beyond: Top 5 Projections
Bitcoin's future price projections for 2024 and beyond have garnered significant attention, with several optimistic forecasts emerging. Matrixport, a cryptocurrency trading firm founded by Jihan Wu, anticipates a year-end Bitcoin price of $45,000. BitQuant, a respected commentator, foresees new all-time highs before the upcoming Bitcoin halving, with a post-halving target of $250,000. Various price models converge on a $130,000 target zone, while some, including Cathie Wood and Arthur Hayes, believe in the eventual possibility of a $1 million Bitcoin price. These predictions are speculative and should be approached with caution. Careful research and consideration are advised for those considering cryptocurrency investments.
#Bitcoin price predictions 2024#Cryptocurrency price forecasts#Bitcoin price targets#Bitcoin future price analysis#BTC price projections#Cryptocurrency market outlook#Bitcoin bull market trends#Bitcoin halving effects#Bitcoin price models#Cryptocurrency investment insights
1 note
·
View note
Text
A surge in altcoins is predicted by a crypto analyst while Bitcoin remains stable
The 2024 crypto bull run signifies a pivotal moment in the crypto realm as altcoins position themselves for a notable performance, challenging the historical dominance of Bitcoin. Insights gleaned from a recent video by The Fomo Factory indicate a discernible shift in the cryptocurrency landscape towards altcoins, suggesting an evolving narrative. While Bitcoin has long been the vanguard in the crypto world, analysts are optimistic about the promising trajectory of the altcoin market in the upcoming year.
Despite Bitcoin's stability maintaining a foothold around the $42,000 mark, recent volatility stemming from ETF-related news necessitates a closer examination. The critical resistance zone, spanning from $40,000 to $43,000, hints at a potential period of sideways movement, prompting analysts to explore various scenarios. These scenarios include the potential for Bitcoin to surge to higher prices upon overcoming resistance or experiencing a dip to $37,000 if support weakens.
The spotlight now shifts decisively to altcoins, with Ethereum's ETFs sparking significant excitement and creating ripples throughout the broader cryptocurrency market. The market capitalization, fluctuating between $1.5 trillion and $1.7 trillion, presents a landscape teeming with challenges and opportunities. Analysts advocate for a strategic departure from Bitcoin towards altcoins, proposing that converting Bitcoin into altcoins, rather than relying on traditional fiat currency, may present more favorable prospects.
Highlighting specific altcoins like AVAX, Beam, IMX, Forge, and Quant, attention is drawn to their unique characteristics and potential. While some have experienced noteworthy gains, others are positioned as secure investment choices, placing emphasis on stability over the allure of extraordinary returns. As the crypto market undergoes further evolution, investors closely track these altcoins and emerging themes, anticipating significant gains in the months ahead. With the potential for altcoins to potentially outshine Bitcoin in 2024, the cryptocurrency community anticipates a year filled with dynamism and excitement.
#cryptocurrency#altcoins#Bitcoin#Ethereum#market trends#innovations#2024 bull run#analysts#volatility#ETFs#Fomo Factory#crypto landscape#paradigm shift#Cryptotale
1 note
·
View note
Text
The best way to make a revenue from the upcoming crypto bull run
In light of recent developments in the cryptocurrency world, there is much to learn about what seems to be the first bear market since 2018.
In the past, bear markets have been extremely difficult for both seasoned and inexperienced investors, with little to no gains being realized. While trying to trade despite the unpredictable nature of recovering from mistakes, many investors experience huge financial losses during bear markets. Learning how to safeguard your investments and have liquidity for the next bull run is essential for a beginner to succeed in the cryptocurrency market. The purpose of this response is to provide well-informed advise on how to avoid typical mistakes in a bear market and crucial actions to take in order to get ready for the continuation of a bull run.
Continue reading in futurancepro.com
#crypto investing#crypto trends#crypto trading#crypto latest news#bitcoin trading#bitcoin#bull market#crypto bull run
0 notes
Text
⭐ Bitcoin on February 18th 2023 🚀✨
The price as I'm writing this is $24,470 per btc.
youtube
Astro 🔮💫
Venus is approaching a conjunction to Bitcoin's moon in Aries starting today, then subsequently Jupiter (On March 2nd). This likely points to a boost in people's investments (especially the jupiter conjunction). The stock market is likely to rally as well. Venus rules money & investments.
Super positive for bitcoin 👍
Cup & Handle Pattern:
- Invalidation vs. Breakout zones: $24,300 ❌ & $24,950 ✅
- Triple Bullish Scenario ♉♉♉
Cup Handle - 4h chart
Bull flag - 1h chart
W-pattern (2x-bottom) - 15m chart
-=-=-=-
1: 💹 Trends
Monthly, we are in a downtrend 📉.
Meaning, we can expect prices less than $17,000 Bitcoin in the next 12 months.
Weekly, we are in an uptrend 📈.
Meaning we can expect prices higher than $25,300 Bitcoin within the next 8 weeks
So long as we close Sunday above $23,900 btc (So far, ✅)
Daily, we are in an uptrend* 📈
IF we close the day above $24,300 BTC. (@ 7pm EST)
However yesterday, we have made lower highs than the 15th, when we retested $25,000. Which is bearish.
4h we are in a seeming downtrend. Marked by a distinct lower high in the chart. Simply one strong candle downwards on this timeframe is confirmation and We are looking horrendous for Bitcoins price over the next 3 days.
Right now, it seems we are in this ambiguous/pivotal energy like yesterday. So it's a time for relative inaction. Volume is eerie and low at the moment. Not much pressure from either the bull or the bears 😐
Hourly, we are in a downtrend 📉
Meaning we can expect prices lower than $24,300 bitcoin within the next day.
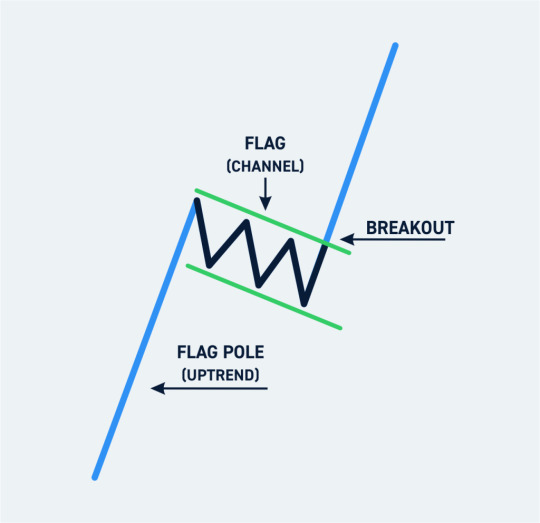
That is just the fact of the matter... Despite that we are forming a sort of distribution pattern known as a bull flag. A sort of last minute attempt to break the down trend. If that is validated, this could lead us powerfully to our next leg up. The measured move would lead us precisely to our next target: $26,250 dollar btc. ⚠️


The bull flag would be confirmed by any intraday closure above the "pole" of the flag: ~ 24,950. Usually by bullish candles with high volume
2: 🔮 Conclusion
I am in a small long position as of the bottom of the bullflag Entered at ~$24,480. I will add more once there is confirmation of a breakout. Placing my stop-loss price at the bottom of the flag (channel).
And taking some profits at $25K!

3: 💰 Current Portfolio
18.5% USDs (+8.65%)
17.15% BTC (-4%)
64.35% Alts (-4.65%)
In Alts [24% is ETH 🔵, 17% is BNB 🟡, Rest is a combination of ADA, LINK, LTC & SHIB]
That's all For now!
2 notes
·
View notes
Text
Trending Cryptocurrency Tokens on Avalanche Chain Today – Hefe, Vee Finance, GoGoPool Protocol: Guest Post by Inside Bitcoins
The crypto market is undoubtedly pivotal in the bull market as market-wide price declines have continued unabated. Bitcoin slowed down today, the fourth decline in […]

View On WordPress
0 notes
Text
Crypto Seasons: A Chart Your Course to Future Fortune
The cryptocurrency market is a dynamic landscape, constantly evolving and experiencing cyclical highs and lows. These cycles, often referred to as “crypto seasons,” can present both lucrative opportunities and significant risks for investors. Here, we’ll delve into these seasons, equipping you with the knowledge to navigate the ever-changing crypto landscape.
Demystifying the Crypto Seasons: A Cyclical Journey

Spring (Accumulation): Following a bear market (a period of sustained price decline), confidence starts to rebuild. Prices begin to rise slowly as early adopters and value investors accumulate assets in anticipation of future growth.
Summer (Bull Run): This is the golden period for many investors. Increased market confidence and positive media coverage fuel a surge in prices. New investors enter the market, further amplifying the upward trend.
Fall (Profit-Taking): As euphoria reaches its peak, some investors start to “take profits,” selling their holdings to lock in gains. This can lead to a period of price stabilization or even a slight correction.
Winter (Bear Market): Inevitably, a correction occurs. Prices fall significantly, leading to fear and uncertainty among investors. This typically lasts for several months and can be a brutal period for unprepared investors.
It’s important to remember that these seasons are not set in stone and can vary in duration and intensity. However, recognizing these trends can help you make informed investment decisions throughout the year.
Top Contenders for the Future: Charting the Crypto Galaxy
While the future of crypto remains uncertain, some projects stand out for their potential to be major players in the years to come. Here are a few of the top contenders, including the ever-evolving Solana:
Bitcoin (BTC): The undisputed king of crypto, Bitcoin remains a dominant force. While its growth might be slower than some newer projects, its established presence and limited supply offer a sense of security for many investors.
Ethereum (ETH): Often referred to as the “smart contract king,” Ethereum provides the foundation for a wide range of decentralized applications (dApps) and the booming DeFi (decentralized finance) ecosystem. Its recent upgrade promises faster speeds and lower fees, making it even more attractive.
Solana (SOL): As discussed, Solana is rapidly becoming a breeding ground for innovation. Its lightning-fast transaction speeds, incredibly low fees, and constant development make it a prime candidate for future growth.
For Solana, In this platform : Solana Token Launcher , Here You can Generate your own tokens in less then three seconds & without extensive programming language, Also you can customize your tokens in this amazing platform , Check out now!!
Cardano (ADA): Focused on scalability and security, Cardano is a rising star. Its unique proof-of-stake consensus mechanism offers a more energy-efficient alternative to Bitcoin’s proof-of-work model.
Polkadot (DOT): Polkadot aims to establish a network of interconnected blockchains, facilitating communication and interoperability between different protocols. This vision of a “blockchain of blockchains” holds significant potential.
Beyond the Top Coins: A Universe of Possibilities
This is not an exhaustive list, and there are countless other exciting projects in the crypto space. Be sure to conduct thorough research on promising projects before making any investment decisions.
Here are some additional factors to consider when evaluating cryptocurrencies:
Project Team: The team behind the project plays a crucial role in its success. Look for a well-established team with a proven track record and a clear roadmap for the future.
Technology: A strong underlying technology is essential for long-term success. Understand the project’s technological innovations and how they address existing challenges in the blockchain space.
Community: A passionate and engaged community can be a powerful driver of growth. Look for projects with active communities and positive sentiment.
Remember, investing in cryptocurrencies is inherently risky. Never invest more than you can afford to lose, and always diversify your portfolio to mitigate risk.
Investing During the Seasons: Strategic Maneuvers
Understanding crypto seasons doesn’t guarantee success, but it can inform your investment strategies. Here are some tips for navigating the different phases:
Be Patient: Cryptocurrency is a long-term game. Don’t chase short-term gains and prioritize building a well-rounded portfolio you can hold for the future.
Dollar-Cost Averaging (DCA): This strategy involves investing a fixed amount of money at regular intervals, regardless of the price. This helps to average out your cost per coin and mitigate the impact of market volatility.
Take Profits: While holding long-term is important, it’s also crucial to take profits occasionally. This allows you to lock in gains and potentially reinvest in other opportunities.
0 notes
Text
Bitcoin, Ethereum Exchange Balances Hit Lowest Level Since 2020

Bitcoin (BTC) and Ethereum (ETH) balances on centralized exchanges have plunged to a four-year low, according to Glassnode data, reflecting investors' increasing preference to hold their assets amid a bullish market sentiment. BTC reserves dipped below 2.3 million coins, valued at approximately $160 billion, while ETH holdings dropped to under 16 million, totaling less than $59 billion. Factors Behind the Decline in Exchange Balances The decrease in Bitcoin and Ethereum exchange reserves has been persistent since mid-2020. Glassnode's data indicates that users have consistently withdrawn assets from exchanges, a trend that continued through various market events, including the 2021 bull run, the 2022 Terra-FTX collapse, and even the approval of spot BTC ETFs. This prolonged reduction highlights a growing long-term bullish
source
0 notes
Text
Bitcoin Price Appears Stuck At $67K
Data from Cointelegraph Markets Pro and TradingView showed BTC price action lacking impetus as it ground away at nearby support.
Four wicks toward $67,000 in recent days established that level’s importance as a line in the sand to maintain for bulls, who nonetheless struggled to muster the strength to revisit overhead resistance.
“After running into range high & market supply $72K, bulls have lacked sustained momentum above $70K,” popular trader Skew wrote in part of his latest market update on X (formerly Twitter).
Skew flagged “waning momentum” based on relative strength index (RSI) signals, suggesting that any further downside needed to bottom at around $65,000.
“Takers sold into the bounce, supply is kinda thin with limit spot bids defending the low ($67K),” he added in subsequent commentary about the most recent BTC price moves.
“It's here if buyers wanna swing price towards $70K.”
0 notes
Text
Cryptocurrency markets are dynamic, and understanding trends is crucial for successful trading. One key concept is the bull market cycle, marked by rising prices after a period of decline. Recognizing this shift can be facilitated by analyzing on-chain indicators, which track blockchain-related activities like transactions and network fees.
Five important on-chain indicators signal the start of a bull market cycle:
Flows Between Spot and Derivative Exchanges: Movement of Bitcoin from spot to derivative exchanges suggests a risk-on approach by investors, indicating early signs of a bull cycle.
MVRV Ratio: This measures the average profit/loss of Bitcoin holders. Currently above 1 (1.07) and nearing its 365-day moving average, the MVRV ratio suggests an impending uptrend.
Net Unrealized Profit/Loss (NUPL): NUPL compares Bitcoin holders' profit margins to their cost basis. Close to its 365-day moving average, it signals increasing demand and a potential uptrend.
Puell Multiple: This index tracks miners' ability to cover costs by selling mined coins. With Bitcoin's price surpassing its 365-day moving average significantly for the first time since November 2020, the Puell Multiple indicates a positive market cycle.
CryptoQuant’s P&L Index: Combining the MVRV ratio, NUPL, and SOPR, this index is nearing a buying signal as it approaches its 365-day moving average.
In conclusion, these on-chain indicators suggest Bitcoin is entering a new bull cycle with rising demand and miner profitability. Analyzing these metrics helps investors anticipate and capitalize on bullish trends.
4o
0 notes
Text
Bitcoin Has More Room Before It’s Full
According to Bitcoin Macro Oscillator Momentum (BMO), BTC price may rise. Despite short-term selling pressure, BTC's upside potential is still great. Bitcoin (BTC) has been stuck in a price consolidation phase (price $607,000) for more than two months, which is painful. Analyst Willie Wu believes that the consolidation is very good for BTC's upside potential. Under the demand of the market, this 2.5-month consolidation is very good for Bitcoin, which means that the price has more room before the top. Waugh's prediction is based on the Bitcoin Macro Oscillator (BMO), which shows that additional upside may occur. The value indicator is a collective momentum indicator that contains other key indicators such as MVRV (market value to real value), VWAP (volume-weighted average price), CVDD (cumulative value daily destroyed) and Sharpe ratio. In short, BMO reduces short-term price noise and provides a long-term perspective on whether BTC falls to the bottom line or the top line. In the market cycles of 2017 and 2021, BMO reached 1.8 BTC positions, but at the time of press release, the indicator's reading was below 1. According to BMO's prediction, Wu predicts that the indicator could move to 1.8 again, marked with a white arrow on the chart, giving BTC’s price more room to move up.
What’s the next move?
Despite the bullish outlook, resistance near the last cycle high of $690,000 remains a key obstacle, according to Peter Brandt, a well-known BTC technical chart analyst.
According to Brandt, BTC must hit new highs to confirm a bull trend.
However, a recent AMBCrypto report noted that most indicators still predict a bullish scenario for the king coin. In particular, miners are not selling their holdings, and market sentiment indicates greed.
But the only problem with BTC’s price is short-term holders. Most of them are profitable and can take profits, thus triggering short-term selling pressure.
Another crypto analyst, Cryp Nuevo, predicts that liquidity chasing could take over short selling,
According to reports, a US cryptocurrency exchange (AMBCrypto) predicts that if Bitcoin reaches a one-month high,
The bullish sentiment was further echoed by cryptocurrency trading firm QCP Capital.
The company’s Mt Gox Updated near-term BTC selling pressure underestimated as rising, indicating an upward trend.
These bouts of supply anxiety could play out within a broader trend towards the end of the year.
0 notes
Text
Analysts Caution About Possible Bearish Shift in Bitcoin Market During Upcoming Halving Event
Analyst Ali's assessment raises concerns about a potential bearish shift for Bitcoin, attributing it to the Inter-exchange Flow Pulse (IFP) dropping below its 90-day average. Historically, this occurrence has been a precursor to bearish trends, prompting uncertainties about Bitcoin's immediate future.
In Ali's analysis, the Bitcoin Price line reflects the currency's price volatility (in black), while the IFP (in blue) indicates Bitcoin's inter-exchange flow. The 90-day Simple Moving Average (SMA) of IFP (in purple) provides a broader perspective on market trends. Notably, recent movements, with an uptick in IFP and a Bitcoin price dip, suggest a potential shift toward bearish sentiment.
Ali's chart also emphasizes a correlation between IFP and Bitcoin price fluctuations. A low IFP suggests holding behavior, indicative of a bull market, while a high IFP may signal increased selling pressure, aligning with bearish trends.
CryptoYoddha, another influential figure in the crypto community, offers insights into Bitcoin's historical halving events. Their chart, spanning from 2017 and projecting beyond 2024, distinguishes bear and bull markets in red and blue, respectively. The chart highlights the significant role of Bitcoin halvings, historically preceding notable price surges.
Notably, the chart features a countdown to the fourth Bitcoin halving, suggesting optimism for an ensuing bull market. It draws parallels with the outcomes of the first three halvings, projecting a similar positive outcome after the fourth.
As of the latest data, BTC is trading at $45,620.90, reflecting a 1.49% decrease in the past day. The analyses by Ali and CryptoYoddha provide valuable perspectives on Bitcoin's market dynamics, emphasizing the importance of staying informed in the volatile virtual assets market.
#Bitcoin#market trends#Inter-exchange Flow Pulse (IFP)#bearish turn#90-day average#bearish precursor#Bitcoin price fluctuations#holding behavior#bull market#selling pressure#CryptoYoddha#historical halving events#cryptotale
0 notes
Text
Bitcoin, the pioneering cryptocurrency, has captured the attention of investors, traders, and enthusiasts worldwide with its meteoric rises and dramatic falls. Predicting the next Bitcoin boom requires a deep understanding of market dynamics, technological advancements, regulatory developments, and macroeconomic trends. In this blog, Excent Capital Mexico explore strategies and indicators that can help forecast the next Bitcoin bull run and navigate the volatile cryptocurrency market.
0 notes
Text
Qmiax Witnesses The New High Breakthrough of Bitcoin: Market Enters Excitement Bull Phase
Checkmatey, an analyst at the on-chain data analysis company Glassnode, recently stated that the breakthrough of Bitcoin to a new all-time high (ATH) marks the transition from the "Enthusiasm Bull" phase to the "Excitement Bull" phase. This observation aligns with the MVRV ratio exceeding one standard deviation, although it rarely succeeds on the first attempt. In this market environment, Qmiax crypto exchange, as an industry-leading platform, provides users with various tools and strategies to help them seize opportunities during this exciting market phase and maximize investment returns.

Our exchange is committed to providing investors with the best trading experience through advanced technology and comprehensive services. Against the backdrop of the strong market performance of Bitcoin, Qmiax, with its robust trading platform and in-depth market analysis, helps users understand market dynamics and make informed investment decisions. The platform offers real-time data and professional analysis, enabling users to stay abreast of market changes and capture every potential profit opportunity.
The current performance of the Bitcoin market shows strong growth momentum. Qmiax offers a variety of trading tools, such as spot and derivatives trading, to help investors adjust their strategies flexibly in different market environments. Whether short-term traders or long-term investors, everyone can find an investment method suitable for them on the platform, maximizing the opportunities brought by market fluctuations.
To better support users, Qmiax has also strengthened its education and training services. The platform regularly holds online seminars and market analysis lectures, inviting industry experts to share the latest market trends and investment strategies. These activities not only enhance the market knowledge and investment skills of users but also boost their confidence and decision-making ability in the market.
Qmiax places particular emphasis on user experience, offering an intuitive and user-friendly trading interface and comprehensive customer support. Whether users are beginners or experienced traders, they can enjoy a smooth trading experience on the platform. The customer support team is available 24/7 to answer the questions and provide professional assistance of users.
As the Bitcoin market enters the "Excitement Bull" phase, Qmiax crypto exchange remains committed to providing users with the highest quality service and support. The platform will continuously optimize its technology and services to ensure users have the best trading experience in the market. Through constant innovation and improvement, the platform will continue to lead the industry, creating more value for users.
Qmiax crypto exchange has demonstrated its strength and advantages as an industry leader during the new high breakthrough of Bitcoin. By offering advanced trading tools, professional market analysis, and comprehensive user support, the platform helps investors seize opportunities at every stage of the market to achieve their investment goals. In the future market, Qmiax will continue to maintain its leading position, providing global users with safe, reliable, and efficient trading services.
0 notes
Text
Bitcoin whales, or large-scale investors, are holding onto their BTC, indicating strong confidence in the cryptocurrency. Recent analysis from TradingView shows robust support for Bitcoin above the $60,000 mark. This trend suggests that Bitcoin's price may remain stable, reflecting positive sentiment among major investors. Stay updated to see how this could impact the broader crypto Market.
Click to Claim Latest Airdrop for FREE
Claim in 15 seconds
Scroll Down to End of This Post
const downloadBtn = document.getElementById('download-btn');
const timerBtn = document.getElementById('timer-btn');
const downloadLinkBtn = document.getElementById('download-link-btn');
downloadBtn.addEventListener('click', () =>
downloadBtn.style.display = 'none';
timerBtn.style.display = 'block';
let timeLeft = 15;
const timerInterval = setInterval(() =>
if (timeLeft === 0)
clearInterval(timerInterval);
timerBtn.style.display = 'none';
downloadLinkBtn.style.display = 'inline-block';
// Add your download functionality here
console.log('Download started!');
else
timerBtn.textContent = `Claim in $timeLeft seconds`;
timeLeft--;
, 1000);
);
Win Up To 93% Of Your Trades With The World's #1 Most Profitable Trading Indicators
[ad_1]
Bitcoin recently surged past the significant benchmark of $67,000 and is steadily approaching the crucial $70,000 psychological threshold. According to an analyst on X, this uptick is notable because whales holding over 1,000 BTC are not moving their coins to exchanges. This indicates that they likely expect Bitcoin prices to spike even higher in the coming days and weeks.
Whales Are Not Selling, More Gains Expected?
Despite a quiet weekend, the substantial price extension earlier today has bullish traders feeling optimistic. Historically, coin holders, including whales, tend to take profits when gains are perceived as shaky. However, this current cycle shows that whales are holding onto their coins, expecting a strong price recovery. The analyst highlighted that the 30-day average of BTC held by whales is 641 BTC, which has sharply decreased from mid-2023.
NewsBTC
This observation suggests that whales are bullish and not swayed by short-term price movements. While this doesn’t guarantee a rapid increase, it supports the outlook that Bitcoin prices may rise further in the coming sessions. Accompanying the recent breakout above $66,000, on-chain data shows that the Market Value to Realized Value (MVRV) ratio is also climbing. The MVRV ratio for those who've held BTC for 1 to 3 months has risen above the $66,500 mark.
Bitcoin Finds Strong Support Above $60,000
Another analyst highlighted that over 530,000 BTC were traded at a price of $66,250. This point is turning into a reliable support level. If bulls can absorb the selling pressure, the $66,250 line may act as a solid platform for further gains towards an all-time high. The zone above $60,000 is seen as a strong support level, with analysts noting that the Bitcoin Short-Term Holder Cost Basis (STHCB) is rising and now stands at $60,700.
NewsBTC
In on-chain analysis, the STHCB is a metric that tracks the average purchase price of BTC by short-term holders, those who bought their coins within the last 180 days. Historically, the STHCB has served as a support level during bull runs and a resistance level during bear markets. Currently, the STHCB sits at $60,700 and is increasing, suggesting a potential floor for Bitcoin prices.
Win Up To 93% Of Your Trades With The World's #1 Most Profitable Trading Indicators
[ad_2]
What does it mean that Bitcoin whales are not selling?
Bitcoin whales are big investors who own a lot of Bitcoin. When they don’t sell, it usually means they believe the price will go higher or stay strong.
Why is Bitcoin's strong support above $60,000 important?
If Bitcoin stays above $60,000, it means there's solid backing from buyers.
This can make the price more stable and less likely to drop suddenly.
How does TradingView News know Bitcoin whales are not selling?
TradingView News uses data from the blockchain and trading platforms to see if large amounts of Bitcoin are being moved or sold by big investors.
Can Bitcoin's support level change quickly?
Yes, support levels can change due to Market news, trends, and big trades. However, strong support levels are harder to break through.
What should I do if I want to invest in Bitcoin?
Research well, understand the risks, and consider talking to a financial advisor. It's important to know that Bitcoin prices can go up and down a lot.
Win Up To 93% Of Your Trades With The World's #1 Most Profitable Trading Indicators
[ad_1]
Win Up To 93% Of Your Trades With The World's #1 Most Profitable Trading Indicators
Claim Airdrop now
Searching FREE Airdrops 20 seconds
Sorry There is No FREE Airdrops Available now. Please visit Later
function claimAirdrop()
document.getElementById('claim-button').style.display = 'none';
document.getElementById('timer-container').style.display = 'block';
let countdownTimer = 20;
const countdownInterval = setInterval(function()
document.getElementById('countdown').textContent = countdownTimer;
countdownTimer--;
if (countdownTimer < 0)
clearInterval(countdownInterval);
document.getElementById('timer-container').style.display = 'none';
document.getElementById('sorry-button').style.display = 'block';
, 1000);
0 notes
Text
Here's a blog based on the article "BTC & ETH Price Analysis: Indicators Point to Surprising Movement" from coinedition.com:
BTC & ETH Price Analysis: Indicators Point to Surprising Movement
Bitcoin (BTC) and Ethereum (ETH) have been the focal points of the cryptocurrency market, with recent price analysis indicating potential surprising movements. As key players in the crypto space, BTC and ETH's price dynamics are closely watched by traders, investors, and enthusiasts.
Technical indicators suggest that both BTC and ETH are at critical junctures, with potential for unexpected price movements in the near future. Market sentiment, trading volume, and chart patterns all contribute to the analysis of these leading cryptocurrencies.
Bitcoin's price analysis reveals a crucial support level around $57,000, with indicators signaling a potential bounce or breakout. A decisive move above key resistance levels could lead to renewed bullish momentum, while failure to hold support may result in further downside pressure.
Ethereum, on the other hand, is testing important resistance zones around $3,800, with indicators pointing to a possible breakout or retracement. ETH's price movement is influenced by factors like network activity, DeFi trends, and upcoming protocol upgrades.
Market participants are advised to monitor these critical price levels and indicators closely, as they could provide insights into the next direction for BTC and ETH. Volatility in the crypto market remains a key factor, requiring traders and investors to adopt risk management strategies and stay informed about market developments.
In conclusion, BTC and ETH's price analysis suggests potential surprising movements on the horizon. As the crypto market continues to evolve, staying updated on technical indicators, market trends, and fundamental factors is essential for making informed decisions in trading and investing.
0 notes
Text
Despite broader crypto market recovery gains, MATIC remains under bearish control. Bitcoin (BTC) is up 2% and Ethereum (ETH) is up 1.23%, but Polygon (MATIC) faces another bearish trading day. The volatile market, influenced by key U.S. economic data, saw the Dow drop over 200 points, with the S&P 500 and Nasdaq down 1% amid recession concerns.
As of press time, MATIC/USD is at $0.9350, down 0.31% for the day. CoinMarketCap ranks it as the tenth-largest cryptocurrency with an $8.15 billion market cap. MATIC powers the Polygon platform, designed to link and expand Ethereum projects and blockchains.
MATIC is trading below the 50-day moving average. On the four-hour chart, it nears the supply zone with increased volume. If bears sustain the lower level, the price may drop toward the 0.50% Fibonacci retracement level. Previously consolidating near $1.0500, MATIC now hovers around the resistance-turned-support level of $0.9372, with bulls challenging this mark.
After breaching the 0.38% Fibonacci retracement level, selling momentum receded, forming a Hammer, a bullish pattern. A close above $0.9500 could propel MATIC to the psychological $1.0000 level, followed by $1.0500. Conversely, continued bearish sentiment could push the price to $0.9094. With the daily RSI (14) below 40, the bearish trend persists, but the market isn't overstretched.
0 notes
Last Seen Blogs

pixyeojin
mills

keatonhankus1-blog
Keaton Hankus
keatonhankus1-blog
Keaton Hankus

hermosabellaydivinapasarela
PASARELA

withoutalice
How can we know the future?