#Bull market
Text
We’re in a New Bull Market! Should You Give One Single Fuck?
When we talk about the economy, we talk of stock market moves and unemployment rates (historically low at 3.7%) and inflation (holding steady). Yet numbers like these hide the human element involved in economics. People struggle and stress over making ends meet regardless of what the stock market is doing. Steadying inflation doesn’t mean much to someone who has barely been able to afford their grocery bill for the last year.
Celebrations over bull markets and low unemployment rates sometimes rankle, or even invalidate, the tough times normal folks experience. The financial news seems to be saying “What do you mean the economy sucks? Everything’s going great—the stock market, the unemployment rate, inflation. You must be imagining your troubles. Or it’s all your own fault.”
If you’re struggling in this economy, I can assure you it’s neither your imagination nor your fault, new bull market be damned.
Keep reading.
Did we just help you out? Join our Patreon!
#bull market#credit card debt#economic compassion#investing#new bull market#stock market#the economy
21 notes
·
View notes
Text

Elon Musk - Tesla Bull - Investing Design - Bull Market Baby
by WigOutlet
#elon musk#tesla#bull market#investing#palantir#technology#tech stocks#disruptive technology#home office#office accessories#small business
2 notes
·
View notes
Text
Demystifying the Bull and Bear: Understanding Market Trends
In the world of finance and investing, terms like “bull market” and “bear market” are frequently thrown around. But what do these terms really mean? Today, we’ll dive into the fascinating world of market trends and gain a clear understanding of these commonly used phrases.
Bull Market: Riding the Wave of Optimism
When we hear the term “bull market,” it signifies a period of rising stock prices…
View On WordPress
#Bear Market#Blogger#Blogging#Bull Market#dailyprompt#Demystifying the Bull and Bear: Understanding Market Trends#Financial#Financial advice for beginners#Financial Freedom#Financial Literacy#Generational Wealth#knowledge#money#Money Fun Facts#Moneymaking#Passive Income#Personal Finance#Riding the Wave#Wealth
7 notes
·
View notes
Photo

2 notes
·
View notes
Text
Take four minutes to read this post, its timely and critical
#charts#lunar#bull market#cycles#dow#contrary thinker#bear market#technical analysis#hedge#stocks#bonds#gold#volatility#In the money#options#futures#liquidity
3 notes
·
View notes
Text
Wall Street enters bull market
View On WordPress
2 notes
·
View notes
Text
ES Morning Update October 24th 2022
ES Morning Update October 24th 2022
Strong move up on Friday and it’s continuing this morning. However, all 3 scenario’s are still on the table and I really don’t think we eliminate scenario two until we get above the rising red trendline of resistance. That’s around 3850 today, so if they can say run to 3900 and pullback to 3850 the odds increase a lot that we are going for the FP on IWM.
But currently the market hasn’t even got…
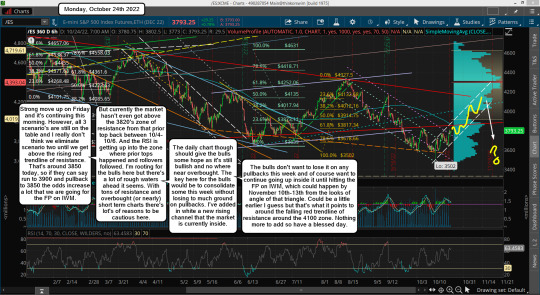
View On WordPress
#bearish#bull market#bullish#DOW#es futures#fake print#flash crash#FP#MACD#Nasdaq#rally#russell#SPX#spy#stock market#trendline
3 notes
·
View notes
Text

bull market, billings montana
#diy music#diy or die#post hardcore#invest#indie photography#canon 60d#concert photography#bull market#montana#montana music#photography
1 note
·
View note
Text

Which market is easier to profit in a bull market or a bear market?
5 notes
·
View notes
Text
Setting the Record Straight: Best Six Months, Halloween Indicator, Sell in May
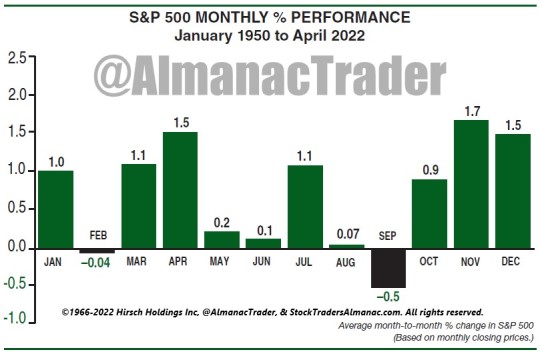
It’s that time of year again. The Best Six Months November-April begin next week, and they are even better when they begin in midterm years. But there are the naysayers so here’s the proof. This bar chart from the about to be released 2023 Stock Trader’s Almanac is led to Yale Hirsch’s discovery of this pattern and strategy.
Our Best Six Months Switching Strategy (aka “Halloween Indicator” or “Sell in May”) works. Any research to the contrary that goes back to 1900 on the DJIA (or even further back), is way too far back. Sell in May is an old British saw, soundly based on inherent behavioral finance patterns and the collective cultural behavior of the investment community, but it did not truly become a tradable investment strategy until after WWII.
The issue with starting way back then is the world is a much different place now than 100-plus years ago. Prior to about 1950, farming was a major portion of the U.S. economy and from 1901-1950, August was the best performing month of the year, up 36 times in 49 years (market closed in August 1914 due to World War I) with an average gain of 2.3%. July was the second-best month, up 31 of 50 with an average gain of 1.5%. June was fourth best, averaging 0.9%. Why, you may ask? Simply: planting, sowing, reaping, and harvesting. As crops were planted and then brought to market and sold, cash began to move and so did the stock market.
Agriculture’s share of GDP began to shrink post World War II as industrialization created a growing middle class that moved to the suburbs where hard-earned salaries would be spent filling new homes with all the modern conveniences we all take for granted now. Farming became more efficient and fewer and fewer people worked on the farm.
Suddenly, summer was less about the hard work of harvesting crops and more about vacations and relaxing. As the economy evolved and peoples’ lives changed, the market evolved. June and August went from being top performing months to bottom performing months. August went from #1 to #10 in 1950-2021 with an average DJIA gain of 0.1%. June went from #4 to #9 (0.1% average). The shift in DJIA’s seasonal pattern is clear in the following chart. “Sell in May” is a post WWII pattern, prior to then it would have been “Buy in May”.

While many market participants are hip to the saying “Sell in May and go away,” most forget to get back into the market in the fall. We like to say, “Buy in October and get yourself sober.” Before folks were keen on the Halloween Indicator which calls for getting long stocks on Halloween and the end of October, we created our Best Six Months Switching Strategy in 1986 and first featured it in the 1987 Stock Trader’s Almanac.
Back in 1986 we showed how most of the market’s gains were made in the “Best Six Months (BSM)” from November to April and that the market went sideways in the “Worst Six Months (WSM)” from May to October and is most susceptible to major declines during the Worst Six Months. From April 1950 to October, 21 2022 the S&P 500 has gained 2721.33 points versus 1013.35 points in the WSM. These six months combined have produced an average DJIA gain of 7.3% since 1950 compared to an average gain of just 0.8% during the months May to October.
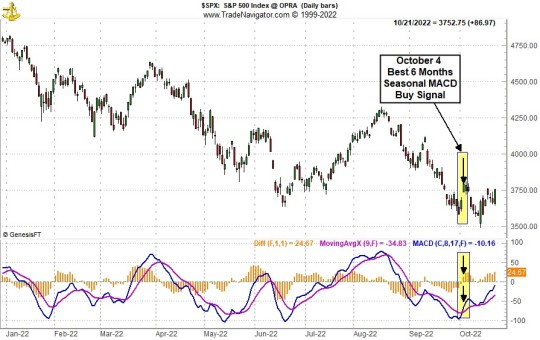
We have improved the results of the strategy using the MACD technical indicator. Back in 1999 the late Sy Harding enhanced the BSM strategy by employing the late Gerry Appel’s MACD to improve entries and exits and dubbed it, “the best mechanical system ever.” Over the years we have refined the strategy further by corroborating more than one MACD, looking for confirmation across major market indices and taking MACD triggers earlier in the month.
We issued our Best Six Months Seasonal MACD Buy Signal to members on October 4 and have also issued baskets of seasonal sector ETF and undervalued, under-the-radar stock trades.
#october#stock market#seasonality#best six months#halloween strategy#Halloween Trade#Halloween#indicator#Sell in May#Midterm Elections#midterm year#Bear market#bull market
5 notes
·
View notes
Text

Read more:
We’re in a New Bull Market! Should You Give One Single Fuck?
13 notes
·
View notes
Text
10 Habits of a Successful Trader
In the fast-paced world of trading, success is often attributed to a combination of knowledge, discipline, and the right habits. Developing effective habits can set you apart from the average trader and help you achieve consistent results. In this article, we will explore the ten key habits that successful traders possess and how they can be integrated into your trading routine.
1. Continuous…
#Bull Market#Economic Indicators#Forex#Market Conditions#Market Movements#Market Trends#Risk Management#Stop-Loss#Trading Journal#Trading Plan#Trading Success
0 notes
Text


1 note
·
View note
Text

Bull Market Thrills or Bear Market Spills? Learn to Navigate Both
Follow us: @nifty11
#finance#stock market#investment#learnandearn#educate yourself#investing stocks#stock trading#bull market#bear market
0 notes
Text
https://seekingalpha.com/article/4695976-weatherford-international-poised-for-growth-in-the-energy-services-bull-market
0 notes
Text
youtube
InvestTalk - 10-26-2023 – Lessons from the Post-Pandemic Bull Market
Although the market has seen a number of investment "fails" and the Federal Reserve is a strong but inept institution, what else have we learnt from the post-pandemic bull market?
0 notes
Last Seen Blogs

agent-zephyrkah
Sprawdź informacje o kabinach marki Ravak

milu-no-blog
ochi___

sable-myers
If evil then why cute?

sydneyshatterdomeshenanigans
Dispatches from the Sydney Shatterdome

camrythom12
Camry Thomas