#Bullish Engulfing Pattern
Explore tagged Tumblr posts
Visit Tumblr Blog
Explore Tumblr blogs with no restrictions, modern design and the best experience.
Last Seen Tumblr Blogs


Fun Fact
Mobile US users spent an average of 115.8 minutes on Tumblr app monthly.
Text
How to Trade the Bullish Engulfing Pattern: Complete Guide with Strategies
In the world of candlestick trading, price action patterns offer invaluable insights into market sentiment and potential reversals. One of the most powerful and frequently observed reversal patterns is the Bullish Engulfing Pattern. This pattern signals a shift from bearish to bullish sentiment, often preceding a strong upward move. In this blog post, we’ll explore: What the Bullish Engulfing…
#Best candlestick patterns for trading#Bullish Candlestick Patterns#Bullish Engulfing confirmation#Bullish Engulfing in downtrend#Bullish Engulfing in intraday trading#Bullish Engulfing Pattern#Bullish Engulfing pattern explained with examples#Bullish Engulfing setup#Bullish Engulfing trading strategy#Bullish Engulfing vs Bearish Engulfing#candlestick chart patterns#Candlestick reversal patterns#EMA bounce with candlestick patterns#engulfing candle setup#Engulfing candle trading strategy#Entry and exit strategy for Bullish Engulfing#High volume Bullish Engulfing#How to identify a Bullish Engulfing pattern#How to Trade Bullish Engulfing#intraday trading strategy#learn technical analysis#Price Action Strategy#Profitable Bullish Engulfing strategy for beginners#reversal trading signals#RSI and Bullish Engulfing#Stock trading patterns#Support and resistance trading#Swing trading with Bullish Engulfing#technical analysis#Technical Analysis Patterns
0 notes
Text
How to Trade with Engulfing Candlestick Patterns
Engulfing Candlestick Patterns are a type of chart pattern used in technical analysis to predict market trends. They occur when a larger candlestick completely covers or “engulfs” the previous smaller one, signalling a potential reversal in price direction. There are two types of engulfing candlestick patterns, i.e., bullish engulfing pattern and bearish engulfing pattern. These patterns are a useful tool in determining entry and exit points for trade or understanding the market behaviour to make informed portfolio decisions.

Types of Engulfing Candlestick Patterns
How to Trade Using Engulfing Candlestick Patterns
Pros and Cons of Bullish Engulfing Candlestick Pattern
Pros and Cons of Bearish Engulfing Candlestick Pattern
#engulfing candlestick#types of engulfing candlestick pattern#bullish engulfing candlestick#bearish engulfing candlestick pattern
0 notes
Text
What to expect from the stock market this week

Last week, the review of the macro market indicators saw with the March FOMC meeting and options expiration in the books, that equity markets shifted to stability after 3 weeks of downward price action. Elsewhere looked for Gold ($GLD) to continue its ascent into space while Crude Oil ($USO) consolidated at the bottom of a broad range. The US Dollar Index ($DXY) looked to have found support in its drift lower while US Treasuries ($TLT) looked weaker in their consolidation. The Shanghai Composite ($ASHR) looked to digest the recent move higher while Emerging Markets ($EEM) consolidated in a narrow range.
The Volatility Index ($VXX) looked to remain slightly elevated putting some pressure on equity markets. Their charts remained at risk of more downside, especially on the longer timeframe. On the shorter timeframe both the $QQQ and $SPY looked to be stabilizing as they held the bounce during the week. The $IWM was a bit weaker.
The week played out with Gold retesting 3000 before a run up to new all-time highs while Crude Oil found some strength and moved higher in the consolidation range. The US Dollar held in a narrow range while Treasuries fell back to a 5 week low before catching a bid Friday. The Shanghai Composite found support and moved sideways while Emerging Markets dropped out of the short consolidation.
The Volatility Index started by moving lower but reversed Wednesday to end the week slightly higher. This saw the bounce rally in equities grind to a halt early in the week and they dropped back through Friday. This resulted in the SPY and the QQQ and the IWM printing new 2 week lows. What does this mean for the coming week? Let’s look at some charts.

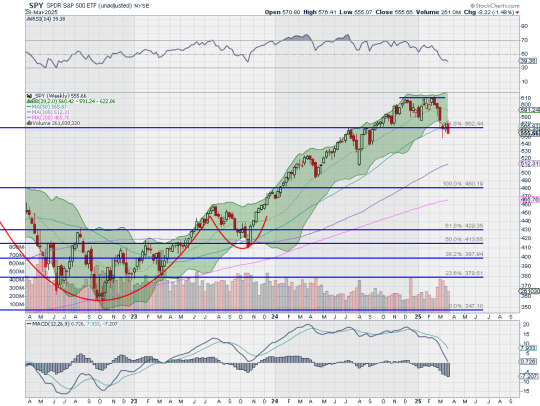
The SPY came into the week pausing in a bounce off the 61.8% retracement of the leg higher since August 2023 and reclaiming the 161.8% extension of the retracement of the 2022 drop. It gapped up Monday to touch the 200 day SMA and over the 20 day SMA but then printed and Evening Star reversal pattern and started lower Wednesday. It gathered steam in the move lower Friday to end the week at a 2 week low. It looks as if the bounce might confirm as a bear flag and confirmation would give a target to 513. It has a RSI dropping back from a stall at the midline in bearish territory with the MACD curling to cross down and negative.
The weekly chart shows a bearish engulfing candle, also suggesting more downside, holding under the 50 week SMA. The RSI has gone level at the bottom of the bullish zone with a peak into the bearish zone with the MACD dropping but positive. There is resistance above at 556.50 followed by 565.50 and 569 then 571 and 574.50 before 581 and 585. Support lower is at 549.50 then 545.75 and 542.50 before 540 and 537. Pullback in Uptrend.
With just one trading day left in the 1st Quarter of 2025, equity markets showed renewed weakness after a positive start to the week. Elsewhere look for Gold to continue its record breaking drive higher while Crude Oil rises in consolidation. The US Dollar Index looks to continue to drift to the downside while US Treasuries pullback in their consolidation. The Shanghai Composite looks to consolidation in the short term uptrend while Emerging Markets continue a short term consolidation.
The Volatility Index looks to remain slightly elevated making the path easier for equity markets to the downside. Their charts look vulnerable on both timeframes. On the shorter timeframe the SPY if a bit stronger than the QQQ and IWM. On the longer timeframe all look set up for more downside. Use this information as you prepare for the coming week and trad’em well.
Join the Premium Users and you can view the Full Version with 20 detailed charts and analysis: Macro Week in Review/Preview March 28, 2025
11 notes
·
View notes
Text
How to Trade Using Candlestick Patterns for Better Trade Decisions
Candlestick patterns are one of the most widely used tools in technical analysis. They provide valuable insights into market sentiment and potential price movements by analyzing the open, close, high, and low of each trading period. By understanding and using candlestick patterns, traders can make more informed decisions, anticipate market reversals, and optimize entry and exit points.
Here’s how you can use candlestick patterns effectively in your trading strategy.
1. What are Candlestick Patterns?
A candlestick pattern is formed by one or more candlesticks that represent price movements within a given timeframe. Each candlestick shows:
Open price: The price at which the asset opened during the time period.
Close price: The price at which the asset closed during the time period.
High price: The highest price reached during the period.
Low price: The lowest price reached during the period.
Candlestick patterns can be either bullish (indicating an upward price movement) or bearish (indicating a downward price movement), depending on the relationship between the open and close prices.
2. Popular Bullish Candlestick Patterns
Bullish candlestick patterns signal potential upward price movement. Here are a few common ones to look out for:
Bullish Engulfing Pattern: This pattern consists of a small bearish candlestick followed by a larger bullish candlestick that completely engulfs the previous one. It indicates strong buying pressure and often signals the beginning of an uptrend.
Hammer: A hammer candlestick has a small body and a long lower shadow, which indicates that sellers tried to push the price lower, but buyers stepped in and drove the price back up. It suggests a potential reversal from a downtrend to an uptrend.
Morning Star: This pattern consists of three candlesticks: a long bearish candlestick, followed by a small-bodied candlestick, and then a long bullish candlestick. The morning star indicates a potential trend reversal from bearish to bullish.
3. Popular Bearish Candlestick Patterns
Bearish candlestick patterns suggest potential downward price movement. Here are a few common bearish patterns to look for:
Bearish Engulfing Pattern: The opposite of the bullish engulfing pattern, the bearish engulfing consists of a small bullish candlestick followed by a larger bearish candlestick that completely engulfs it. This pattern indicates strong selling pressure and often signals the start of a downtrend.
Shooting Star: The shooting star has a small body and a long upper shadow, signaling that buyers tried to push the price higher but were unable to sustain it. This pattern suggests a potential reversal from an uptrend to a downtrend.
Evening Star: The evening star is the opposite of the morning star, consisting of a long bullish candlestick, followed by a small-bodied candlestick, and then a long bearish candlestick. This pattern indicates a potential reversal from bullish to bearish.
4. Using Candlestick Patterns for Entry and Exit
Candlestick patterns can be used to make more informed decisions about when to enter and exit trades:
Entry: When you identify a bullish reversal pattern (like a bullish engulfing or hammer) at support levels, it could be an indication to enter a long position. Similarly, a bearish reversal pattern (like a bearish engulfing or shooting star) at resistance levels could signal a short position.
Exit: Candlestick patterns can also help with determining exit points. For example, if you are in a long position and a bearish reversal pattern (like an evening star) forms near a resistance level, it might be a signal to close your position or set a stop-loss order to protect your profits.
5. Combining Candlestick Patterns with Other Indicators
While candlestick patterns can provide valuable insights, they work best when combined with other technical indicators to confirm the signals. Here are some tools you can use alongside candlestick patterns:
Support and Resistance: Look for candlestick patterns that form at key support or resistance levels. For example, a bullish engulfing pattern at a support level has a higher probability of success.
Moving Averages: Combine candlestick patterns with moving averages (e.g., 50-day or 200-day MA) to confirm the overall trend. A candlestick pattern that aligns with the trend can be more reliable.
RSI (Relative Strength Index): Use RSI to confirm whether an asset is overbought or oversold. A candlestick reversal pattern accompanied by an overbought or oversold condition can strengthen your trade decision.
6. Practice Patience and Wait for Confirmation
Candlestick patterns should never be used in isolation. They work best when you wait for confirmation before entering a trade. For example:
Volume: If a candlestick pattern forms with high volume, it’s a stronger signal. Volume confirmation helps validate the strength of the pattern.
Other Indicators: Look for confirmation from indicators like RSI or moving averages. For example, a bullish engulfing pattern near a moving average support level combined with an RSI showing oversold conditions may provide a more reliable signal.
Waiting for confirmation ensures you’re not jumping into a trade based on an isolated pattern, which could turn out to be a false signal.
Final Thought: Master Candlestick Patterns for Smarter Trading
Candlestick patterns are a powerful tool that can enhance your trading strategy. By understanding and recognizing common bullish and bearish patterns, you can make more informed decisions about entry and exit points, improve timing, and manage risk more effectively.
Ready to trade smarter with expert-backed strategies? Download Univest — the SEBI-registered trading app that helps you identify profitable candlestick patterns, follow expert strategies, and trade with confidence. Stay ahead of the market and improve your trading success.
0 notes
Text
forex scalping strategy for beginners
1. Introduction to Forex Scalping
https://secretindicator.com/product/forex-gold-m5-non-repaint-mt4-indicator/

TELEGRAM CHANNEL
Forex scalping is a fast-paced trading strategy where traders aim to profit from small price changes in the market. A scalper typically enters and exits trades within minutes—or even seconds—to capture small pip gains repeatedly throughout the trading session.
For beginners, scalping might seem intense, but with proper discipline, understanding, and tools, it can become a profitable trading method.
2. Advantages and Disadvantages
Advantages
Quick Profits: Since trades last minutes, you can quickly realize gains (or losses).
Low Exposure to Risk: Short time in the market means reduced exposure to unpredictable market news.
Frequent Opportunities: There are many setups during high liquidity periods.
Compounding Effect: Many small wins can accumulate into significant profits.
Disadvantages
High Stress: Constant monitoring and quick decision-making can be stressful.
Requires Focus and Time: Scalping is time-intensive and requires full attention.
Higher Transaction Costs: Frequent trading can lead to higher spreads and commissions.
Risk of Overtrading: Temptation to take too many trades in a short period can lead to losses.
3. Understanding the Forex Market Basics
Before jumping into scalping, you need to understand the fundamentals of the Forex market:
Currency Pairs: Forex is traded in pairs (e.g., EUR/USD, GBP/JPY). Scalpers usually trade major pairs due to tight spreads and high liquidity.
Pips and Spreads: A pip is the smallest price movement in a currency pair. The spread is the difference between the buy (ask) and sell (bid) prices.
Leverage: Many brokers offer leverage, which magnifies both profits and losses. Beginners should use this cautiously.
4. Choosing the Right Trading Platform and Broker
Scalping requires a reliable and fast broker. Here's what to look for:
Broker Requirements
Low Spread and Commission: Since scalping focuses on small price moves, tight spreads are essential.
No Restrictions on Scalping: Ensure the broker allows scalping strategies.
Fast Order Execution: Slippage can ruin scalping trades; you need instant order execution.
Regulated Broker: Choose a broker regulated by a recognized authority (FCA, ASIC, NFA, etc.)
Platform Features
Real-Time Charts: You need charts that update instantly.
Customizable Indicators: Useful for implementing your strategy.
One-Click Trading: For fast execution.
MT4 or MT5 Platforms: These are the most popular among scalpers.
5. Essential Tools and Indicators for Scalping
1. Moving Averages (MA)
Purpose: Identifies trend direction.
Common Types: Simple Moving Average (SMA), Exponential Moving Average (EMA).
Scalping Use: Short MAs (e.g., 5 EMA and 20 EMA) to identify entry/exit points.
2. Bollinger Bands
Purpose: Measures volatility and overbought/oversold conditions.
Scalping Use: Price bouncing off the outer bands signals entry points.
3. Stochastic Oscillator
Purpose: Shows momentum and overbought/oversold zones.
Scalping Use: Buy in oversold areas; sell in overbought zones.
4. Relative Strength Index (RSI)
Purpose: Measures the strength of price movements.
Scalping Use: 5-period RSI for quick signals.
5. Price Action and Candlestick Patterns
Purpose: Provides insight into market sentiment.
Scalping Use: Pin bars, engulfing candles, and dojis at support/resistance.
6. Step-by-Step Scalping Strategy
Trading Pair Selection
Focus on major pairs like EUR/USD, GBP/USD, USD/JPY due to high liquidity and low spreads.
Timeframes
Use 1-minute (M1) and 5-minute (M5) charts for scalping.
Analyze trends using a higher timeframe (M15 or M30).
Step-by-Step Strategy: 5 EMA + 20 EMA + Stochastic RSI
Indicators Setup:
5-period EMA (fast line)
20-period EMA (slow line)
Stochastic RSI (14, 3, 3)
Entry Rules:
Buy Setup:
5 EMA crosses above 20 EMA (bullish crossover).
Stochastic RSI below 20 and starting to curve upward.
Price pulls back slightly toward EMAs (not far from crossover).
Candlestick pattern confirming reversal (e.g., bullish engulfing).
Sell Setup:
5 EMA crosses below 20 EMA (bearish crossover).
Stochastic RSI above 80 and starting to curve downward.
Price pulls back to EMAs.
Candlestick pattern confirming bearish move (e.g., bearish pin bar).
Exit Rules:
Take Profit: 5–10 pips (based on volatility and spread).
Stop Loss: 3–5 pips below/above entry candle or recent support/resistance.
Risk-Reward Ratio: Aim for at least 1:1; ideally 2:1.
Best Times to Trade:
London Open (8:00 AM GMT)
New York Open (1:00 PM GMT)
Avoid low liquidity times (late Asian session or before major news events).
7. Risk Management in Scalping
Scalping requires a strict risk management plan because the frequency of trades can amplify losses.
1. Position Sizing
Never risk more than 1% of your account per trade.
Use a position size calculator based on stop-loss distance.
2. Limit Daily Losses
Set a daily stop-loss limit, such as 3% of your account balance. Walk away after hitting it.
3. Avoid Overtrading
Limit your trades per day (e.g., max 5–10 quality setups).
Quality > Quantity.
4. Use a Journal
Record every trade: entry, exit, reason, result, emotion.
Helps you analyze patterns and improve over time.
8. Psychology of a Scalper
1. Emotional Control
Stay calm under pressure. Avoid revenge trading.
Accept losses as part of the game.
2. Patience and Discipline
Wait for your setup. Don’t force trades.
Stick to your strategy. Don’t chase the market.
3. Confidence Through Practice
Use a demo account to refine your strategy.
Backtest with historical data.
4. Speed and Focus
Be decisive, but not impulsive.
Avoid distractions during trading hours.
9. Common Mistakes to Avoid
1. Trading Without a Plan
Scalping without rules is gambling. Always follow a tested strategy.
2. Using High Leverage
High leverage can wipe out your account in minutes.
Use conservative leverage (e.g., 1:10 or 1:20 for beginners).
3. Ignoring News Events
Unexpected news can spike volatility.
Always check the economic calendar.
4. Trading Low-Liquidity Pairs
Wider spreads = harder to make profits.
Stick to majors with tight spreads.
5. Holding Trades Too Long
Scalping = quick in, quick out.
Don’t turn scalps into swing trades if price moves against you.
10. Conclusion
Forex scalping can be a rewarding strategy for traders who are disciplined, focused, and patient. For beginners, it offers an exciting way to learn about market movements and build trading experience quickly. However, it demands a solid understanding of the market, risk management, and the right psychological mindset.
Key Takeaways:
Start with a demo account to master your strategy.
Choose a reliable broker with low spreads and fast execution.
Use technical indicators like EMA, Stochastic RSI, and candlestick patterns.
Practice strict risk management and never trade based on emotion.
Constantly review and improve your strategy using a trade journal.
Bonus Tip: Simple Scalping Checklist
Before entering a trade, ask yourself:
Is the market in a trend or range?
Are EMAs giving a clear crossover signal?
Is the stochastic in an overbought/oversold zone?
Is there a confirming price action signal?
Are you within the high-volume trading hours?
Have you set your stop-loss and take-profit?
https://secretindicator.com/product/forex-gold-m5-non-repaint-mt4-indicator/
#forex indicators#forex#forex factory#forex online trading#forex market#crypto#forex ea#forexsignals#forex trading
0 notes
Text
Nifty Forecast Tomorrow: Expert Predictions and Market Trends You Should Know
If you're looking for the most accurate Nifty forecast for tomorrow, you're not alone. Every day, thousands of traders and investors closely follow the Nifty 50 index, aiming to anticipate the next market move and get a step ahead of the volatility. In this post, we break down key technical levels, current sentiment, and expert-backed strategies to help you prepare for the trading session ahead.
📊 What Is the Nifty 50 and Why Its Forecast Matters
The Nifty 50 is India’s flagship stock market index, representing 50 of the largest and most liquid companies listed on the National Stock Exchange (NSE). It's a key barometer for market trends and investor confidence.
A well-researched forecast for Nifty 50 movement tomorrow can be highly valuable for:
Intraday traders planning entry and exit points.
Swing traders timing short-term opportunities.
Investors staying aligned with macroeconomic trends.
🔍 Nifty 50 Technical Analysis for Tomorrow
1. Key Support and Resistance Levels
Based on today’s market close and recent trading patterns:
Support zones: 22,300 and 22,180
Resistance zones: 22,500 and 22,640
If the index breaks above 22,500 with momentum, it may push higher. A drop below 22,180 could shift sentiment toward bearish.
2. Moving Averages
Nifty is trading above both 20-day and 50-day EMAs, suggesting the trend remains positive.
The Relative Strength Index (RSI) is around 58–60, reflecting healthy momentum without overbought conditions.
3. Candlestick Pattern
Today’s session showed indecision, forming a neutral candle. A breakout candle or a bullish engulfing pattern tomorrow would be a strong confirmation of upward momentum.
🗣️ Market Sentiment & Global Cues
Sentiment in the market remains cautiously optimistic. Some of the key global and domestic factors influencing the Nifty forecast tomorrow include:
U.S. Federal Reserve commentary on interest rates
Movement in crude oil prices
INR/USD exchange rate fluctuations
Institutional investor activity (FII/DII inflow/outflow)
FIIs were net buyers today, a signal that global appetite for Indian equities remains intact — at least for now.
📈 Expert Outlook: Nifty Forecast for Tomorrow
Analysts are leaning towards a mild bullish trend continuing into tomorrow’s session, assuming no sudden negative cues overnight. That said, volatility is likely to spike during the first hour of trade.
Here are some smart trading reminders:
Don’t chase early price gaps.
Stick to well-defined stop losses.
Wait for volume confirmation, especially near breakout zones.
💡 Tip: A breakout above 22,500 on strong volume could provide a high-probability setup for short-term trades.
🛠️ Action Plan for Traders
Intraday Traders
Observe the first 15–30 minute range for market direction.
Indicators like MACD, RSI, and volume spikes are crucial for timing entries.
Use a trailing stop-loss strategy once in profit.
Positional Traders
Consider adding long positions above 22,500 with upside targets around 22,800.
If Nifty dips below 22,180, reassess and wait for a base to form before entering.
🔗 Live Updates and Tools
Want more granular data? For real-time charts, key levels, and analyst videos, check out the full Nifty 50 forecast and live analysis page.
📬 Final Thoughts
A well-informed Nifty prediction for tomorrow helps traders cut through the noise and take calculated risks. No forecast is 100% guaranteed, but combining technical signals, market sentiment, and global cues can give you an edge.
Trade smart. Stay disciplined. And always have a plan.
#nifty forecast tomorrow#nifty 50 prediction#nifty 50 forecast#nifty technical analysis#nifty trend tomorrow#share market forecast#stock market prediction#nifty outlook#nifty analysis#nifty trading strategy#nifty support and resistance#nifty levels tomorrow#intraday trading tips#stock market india#nifty market trend#nifty tomorrow analysis#nifty movement prediction#NSE forecast#indian stock market forecast#market trend analysis#technical analysis nifty 50#nifty 50 chart#fii dii data analysis#stock market update today#trading view nifty#nifty live updates#nifty chart pattern#nifty stock tips#nifty breakout strategy#nifty candlestick analysis
0 notes
Text
Engulfing Pattern Indicator with Volume Confirmation - indicator MetaTrader 5
Description: This indicator identifies bullish and bearish engulfing candlestick patterns on the chart and optionally confirms them with volume. When the volume of the current candle exceeds that of the previous one, the pattern is considered stronger and more reliable. The user can choose whether or not to apply this volume confirmation filter. External Inputs: BullishArrowColor : Color of the…
0 notes
Text
Swing Trading Techniques: How to Capture Big Market Moves
forex trading app is the sweet spot between fast-paced day trading and long-term investing. It’s perfect for traders who want to capture big market moves by holding positions for a few days to several weeks, instead of minutes or years. The strategy is simple in theory: Make profit from market “swings” or fluctuations. This means buying near support (when prices dip) and selling near resistance (when prices peak) as trends shift.
What makes swing trading so appealing? It’s flexible, less stressful than day trading, and more active than just buying and holding stocks.
By combining technical analysis with defined entry and exit rules, swing trading offers an accessible way for swing trading for beginners and intermediate retail traders alike to participate in markets without constant screen time.
Understanding Swing Trading
Swing trading is a strategy that uses technical analysis to spot price patterns, momentum changes, and support/resistance levels that show potential buy and sell points over days or weeks. Typical holding periods range from two days up to several weeks, targeting moves that are too large for scalpers but too short for position trading.
Tools like candlestick patterns, oscillators (like RSI), moving averages, and chart patterns—like breakouts or consolidations—help confirm setups in stocks, forex, commodities, and crypto markets, all of which have the volatility needed for this style.
Example: Let’s say you see ABC Corp. trading at $50, forming a clear support level with a rising 20-day moving average. You buy in at $51 and set a stop-loss at $48. A week later, the stock goes up to $60, hitting a short-term resistance zone. You sell, making a $9 profit per share—about a 17.6% gain in just seven days.
Reversal trading anticipates complete turns in market direction, using indicators like RSI or MACD indicator divergences and candlestick patterns (like hammers or engulfing patterns). Traders get in once they see a reversal signal confirmed (e.g., bullish divergence on RSI plus a strong bullish candle).
Essential Tools and Indicators for Swing Trading
Swing traders use a bunch of forex trading platforms to find high-probability setups and confirm when to enter or exit.
Moving averages help smooth out price data to spot trends and dynamic support/resistance levels. The Simple Moving Average (SMA) calculates the average closing price over a certain time (like 50 or 200 days), while the Exponential Moving Average (EMA) focuses on more recent prices for quicker reactions. Traders often look for crossovers (like the 50-day EMA crossing above the 200-day EMA, also known as the "Golden Cross") to spot trend reversals or confirm breakouts.
Relative Strength Index (RSI)
The RSI indicator measures momentum on a scale from 0 to 100, showing when something is overbought (>70) or oversold (<30). Using RSI with MACD helps confirm reversals because they look at momentum in different ways.
MACD
The Moving Average Convergence Divergence (MACD) shows the difference between two EMAs (usually 12- and 26-period) and signals crossovers to indicate when trends are shifting.
Bollinger Bands
Bollinger Bands consist of a middle SMA and upper/lower bands set two standard deviations away from the SMA.
In January 2025, UAL set up for a reversal at its 50-day EMA and broke out with above-average volume. You could enter at $38 with a stop-loss at $36.50 and take profits in stages, like selling a quarter at +2% and another quarter at +10%, which helped cushion you before earnings. Even though the stock dipped after a good report, this method secured a net gain of about 7.8% by selling into strength and locking in profits before the market got shaky.
In late 2024, GEV bounced back to its 21-day moving average after the GE spin-off, leading to a long entry at $345 with a stop at $338. However, a sell-off in the sector triggered the stop the next day, resulting in a 2% loss. A partial re-entry when strength returned saw selling near $350 before hitting resistance, which helped avoid bigger losses when the overall energy sector took a hit.
Lesson Learned: Always check the strength of related indices and sector trends before re-entering, since broader market weakness can mess up even good setups.
Tips for Successful Swing Trading
Implement the following swing trading best practices to improve consistency and performance.
Develop and Follow a Trading Plan: Define setups, risk rules, and review criteria before entry.
Maintain a Trading Journal: Record setups, emotions, and outcomes to identify strengths/weaknesses.
Use Multiple Time Frames: Use a higher time frame (daily) for trend direction and a lower one (4-hour) for precise entries.
Stay Updated: Monitor economic calendars for events that can trigger volatility.
Avoid Emotional Decisions: Follow your plan; don’t chase losses or overtrade.
0 notes
Text
Understanding the Bullish Engulfing Pattern for Forex Reversal Signals
The bullish engulfing pattern is a powerful two-candle reversal signal that appears at the bottom of a downtrend in Forex trading, indicating a potential shift from bearish to bullish momentum. It features a small bearish candle followed by a larger bullish candle that completely engulfs the previous body, signaling growing buyer strength. Traders can use this pattern as an entry point for long positions, especially when it forms near key support levels or aligns with indicators like RSI or MACD. While simple to spot, its reliability increases in trending markets and on higher time frames, making it a valuable tool for both beginners and experienced traders. To know more, visit https://forexopher.com/what-is-bullish-engulfing-pattern
0 notes
Text
Assessing the Right Time to Invest in Forex: A Comprehensive Guide
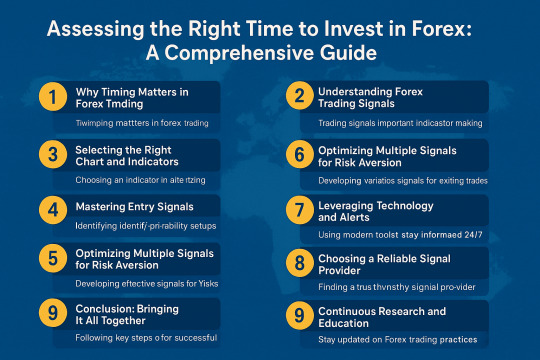
Investing in the foreign exchange (Forex) market can be highly rewarding—but only if you know when and how to enter and exit trades. This guide will walk you through the key steps to assess the optimal time to invest, including understanding trading signals, choosing the right charts, mastering entry and exit indicators, and leveraging technology to stay ahead. Whether you’re a beginner or a seasoned trader, these strategies will help you make informed, logical decisions and minimize risk.
1. Why Timing Matters in Forex Trading
The Forex market operates 24 hours a day, five days a week, with trillions of dollars changing hands daily. Given its continuous nature and high volatility, timing your trades can be the difference between healthy profits and significant losses. Entering at the wrong time may expose you to adverse currency swings, while exiting too early can prevent you from maximizing gains.
A well-timed trade allows you to:
Capitalize on momentum during strong trends
Avoid sharp reversals triggered by economic news
Reduce drawdowns and preserve capital
Improve risk-to-reward ratios on every position
By the end of this article, you’ll have a clear roadmap to pinpoint the best moments to invest and secure consistent returns.
2. Understanding Forex Trading Signals
Trading signals are alerts based on predefined criteria that suggest when to buy or sell a currency pair. They distill vast market data into actionable insights, helping traders spot opportunities without parsing every tick on the chart. Signals can be:
Technical: Generated from mathematical calculations on price and volume (e.g., Moving Averages, RSI, MACD).
Fundamental: Driven by economic events, like interest rate decisions or GDP reports.
Sentiment-based: Reflecting trader positioning and market psychology.
The key is to choose signals that align with your trading style—whether that’s scalping, day trading, swing trading, or longer-term position trading.
3. Selecting the Right Chart and Indicators
Before diving into signals, select a charting platform that offers:
Real-time data feeds for all major and minor currency pairs
Customizable timeframes (from 1-minute to monthly)
Built-in technical indicators and the ability to add custom scripts
Common Forex Charts
Line Chart: Simplest view showing closing prices.
Bar Chart: Displays open, high, low, and close (OHLC) for each period.
Candlestick Chart: Similar to bar charts, but with color-coded bodies—excellent for spotting reversal patterns.
Essential Technical Indicators
Moving Averages (MA): Identify trend direction and dynamic support/resistance.
Relative Strength Index (RSI): Measures overbought/oversold conditions.
Moving Average Convergence Divergence (MACD): Captures trend strength and momentum shifts.
Bollinger Bands: Highlight volatility and potential breakout points.
Stochastic Oscillator: Another momentum tool for spotting reversal zones.
Familiarize yourself with how each indicator behaves across different timeframes. Longer MAs smooth out noise but lag more, while shorter MAs react quickly but can generate false signals.
4. Mastering Entry Signals
An effective entry strategy combines multiple indicators to confirm a high-probability setup. Here’s a step-by-step process:
Trend Confirmation:
Use a 50-period and 200-period MA crossover to determine the primary trend (bullish when 50 above 200; bearish when below).
Momentum Filter:
Check RSI or MACD histogram for momentum alignment. For example, in an uptrend, RSI should be above 50.
Pattern Recognition:
Look for chart patterns (e.g., flags, pennants, head and shoulders) that signal continuation or reversal.
Entry Trigger:
A candlestick pattern (e.g., bullish engulfing) or a break above/below a recent swing high/low.
Volume/Volatility Check:
Confirm with volume spikes or Bollinger Band width expansion to ensure the move is supported by sufficient trading activity.
Example Entry Signal Workflow
Step 1: EUR/USD 4-hour chart shows 50 MA above 200 MA (uptrend).
Step 2: RSI sits at 55, indicating bullish momentum.
Step 3: Price consolidates in a bull flag for three candles.
Step 4: A breakout candle closes above the flag’s top—enter long.
Step 5: Volume increases by 20% above the 20-period average, confirming strength.
5. Optimizing Exit Strategies
Your exit plan is just as important as your entry. There are three common types of exits:
Fixed Stops and Profit Targets:
Predefine a stop-loss level (e.g., 30 pips) and a profit target (e.g., 60 pips) before entering. This guarantees a positive risk-to-reward ratio.
Trailing Stops:
Move your stop-loss in your favor as price advances. Many traders use a moving average or ATR-based trailing stop to capture extended moves.
Limit Exits at Key Levels:
Close positions at significant support/resistance zones or Fibonacci retracement lines.
Short-Term (Scalp/Swing) Exits
For quick trades, focus on “turning points”—repeated short-term patterns that can produce fast reversals. Monitor currency pair swings on 5- to 15-minute charts and set tight limit exits (e.g., 10–15 pips) with equally tight stops.
Real-Time Exit Signals
Many platforms offer real-time alerts—for example, if the MACD line crosses below the signal line or if price breaks below a key moving average. These can automate your exit decisions and reduce emotional bias.
6. Combining Multiple Signals for Risk Aversion
Relying on a single indicator is risky; it can generate false positives or lag behind. Instead, create a signal matrix by:
Overlaying trend, momentum, and volatility indicators
Filtering signals across multiple timeframes (e.g., align a 15-minute entry with a 1-hour trend)
Assigning weights to each signal based on reliability and recent performance
By evaluating multiple Forex signals together, you gain a holistic view of the market and can better anticipate fluctuations. This approach helps you stick to a logical mechanism rather than making random decisions under stress.
7. Leveraging Technology and Alerts
Modern Forex trading thrives on technology. With the right tools, you can analyze markets around the clock and never miss a crucial signal.
Mobile Trading Apps: Execute buy/sell orders and monitor charts on your smartphone—no physical presence required.
Automated Alert Systems: Configure alerts for when indicators meet your predefined parameters (e.g., RSI crosses below 30).
Expert Advisors (EAs): Deploy algorithmic trading systems that scan for signals and place trades automatically.
These innovations ensure that you’re always ready to act on new opportunities, whether you’re at your desk or on the go.
8. Choosing a Reliable Signal Provider
While self-generated signals are ideal, many traders supplement their strategies with professional signal services. To choose a trustworthy provider:
Check Track Record: Look for audited performance over at least six months with clear equity curves.
Read Reviews and Forums: Engage with communities on Forex forums and social media—peer feedback can be invaluable.
Compare Costs vs. Value: Free signals can be high-volume but low-quality, while paid services often offer curated, lower-frequency alerts.
Trial Periods: Opt for services that provide a trial or money-back guarantee so you can test signals risk-free.
Always cross-reference third-party signals with your own analysis to maintain control over your trades.
9. Continuous Research and Education
Forex markets evolve constantly. To stay ahead:
Read Business Newspapers and Magazines: Stay informed on macroeconomic trends that influence currency values.
Participate in Online Forums and Webinars: Exchange ideas with other traders and learn from expert lectures.
Backtest New Strategies: Use historical data and Forex software to simulate performance before risking real capital.
Maintain a Trading Journal: Record each trade’s setup, outcome, and your emotional state to refine your approach over time.
By committing to lifelong learning, you’ll adapt your system to changing market conditions and improve your win rate.
10. Conclusion: Bringing It All Together
Assessing the right time to invest in Forex isn’t about luck—it’s about systematic analysis, disciplined execution, and continuous improvement.
Understand and select the best trading signals for your style.
Choose the right charts and technical indicators.
Master robust entry and exit strategies.
Combine signals across multiple timeframes for enhanced risk aversion.
Leverage technology to automate alerts and execute trades.
Partner with a reputable signal provider, but always validate their calls.
Commit to ongoing research and education to refine your edge.
By following these steps, you’ll position yourself to make well-timed, high-probability trades that align with your goals and risk tolerance. Remember, consistency beats occasional brilliance—stick to your plan, and let your system guide you to long-term success in the Forex market. For more insights: Mastering Forex Trading Psychology: Traits, Emotions, and Mindset for Success Paperback – Large Print, May 20, 2025 by NABAL KISHORE PANDE (Author)
#Forex#TradingSignals#ForexStrategy#ForexIndicators#CurrencyTrading#InvestSmart#MarketTiming#ForexCharts#TradingPsychology#ExitStrategy
0 notes
Text

Top Bullish Reversal Candle Patterns
READ BLOG - CLICK HERE
Morning Star
Bullish Engulfing
Hammer
Inverted Hammer
Double Bottom
0 notes
Video
youtube
Golden Era Scanner in Action Step by Step Forex Scalping Win & Analysis
Join Bill Soriano for a live Forex trading session demonstrating the power and precision of the Golden Era Scanner! In this video, I walk you through identifying trade setups, understanding entry signals (the yellow checkmark!), waiting for candle confirmation, and managing trades using the scanner's invalidation zones and take profit targets.
(What viewers will learn/see) You'll see:
How the Golden Era Scanner identifies potential bullish and bearish engulfing patterns.
The importance of waiting for the 5-minute confirmation candle to close.
Real-time decision-making during Asian session trading.
How the scanner provides clear entry, invalidation, and exit points.
An example of a "no trade" signal (white flag) when price moves too quickly.
A detailed walkthrough of a winning scalping trade on Gold (XAUUSD) resulting in a (DEMO ACCOUNT) profit!
My thoughts on optimal trading sessions for this scanner.
>>> Get Your FREE Golden Era Scanner Overview PDF! <<< Learn more about how this powerful tool can enhance your trading: https://sorianoblueprint.com/GOLDEN-ERA-SCANNER-OVERVIEW.pdf
0 notes
Text
What to expect from the stock market this week

Last week, the review of the macro market indicators saw with the unofficial start of summer ahead and just 4 trading days left in May, equity markets were mixed with tech strong, large caps flat and small caps lower. Elsewhere looked for Gold ($GLD) to continue to consolidate in the uptrend while Crude Oil ($USO) resumed a short term downtrend. The US Dollar Index ($DXY) might resume the short term move lower while US Treasuries ($TLT) remained in a downtrend. The Shanghai Composite ($ASHR) looked to pause in the short term move higher while Emerging Markets ($EEM) might be confirming a failed break out higher.
The Volatility Index ($VXX) looked to remain very low and stable making the path easier for equity markets to the upside. The charts of the $SPY and $QQQ looked strong, especially on the longer timeframe. On the shorter timeframe the QQQ was also strong with the SPY in consolidation. The $IWM continued to be the outlier, consolidating at a higher range.
The week played out with Gold finding support and holding in a narrow range while Crude Oil consolidated rose early in the week before giving back the gain later. The US Dollar held over support while Treasuries moved higher in the downtrend. The Shanghai Composite held at support while Emerging Markets rocketed to the downside.
Volatility rose up off the recent lows but but only to 14. This put pressure on equities and the large caps and tech names responded with a 4 day move lower. The small caps found support mid week and bounced in consolidation. This resulted in the SPY, IWM and QQQ ending back below their 20 day SMA’s. What does this mean for the coming week? Let’s look at some charts.
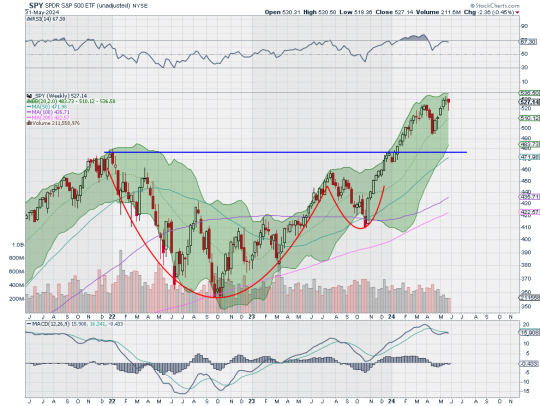
SPY Daily, $SPY

The SPY came into the week consolidating at the all-time high but after a bearish engulfing candle failed to confirm Friday. It held Tuesday and then started to move lower on Wednesday. Thursday it crossed below the 20 day SMA for the first time since May 2nd and dropped again Friday before a strong move higher the last 30 minutes of the day. The RSI is dropping at the midline but in the bullish zone with the MACD crossed down and positive. So far this could just be a momentum reset, with no threat to the uptrend yet.
The weekly chart shows a more damaging pattern as the doji last week is confirmed as a reversal with a move lower this week. This happened as the RSI stalled at a lower high showing a divergence. The price is far from the 20 week SMA and the last pullback found support there. The MACD is crossed down and moving lower but positive. There is support at 520.50 and 517.50 then 513.50 and 510 before 503.50 and 501.50. Resistance higher is at 524.50 and 530. Digestion in Uptrend.
SPY Weekly, $SPY
With the month of May in the books, equity markets showed some signs of weakness following divergences last week. Elsewhere look for Gold to continue its consolidation in the uptrend while Crude Oil consolidates in a narrow range after a pullback. The US Dollar Index continues to drift to in broad consolidation while US Treasuries continue their downtrend. The short term move higher in the Shanghai Composite looks to be at risk of reversing while Emerging Markets enter a short term downtrend.
The Volatility Index looks to remain very low and stable making the path easier for equity markets to the upside. The charts of the SPY and QQQ look strong on the longer timeframe, but with a possible momentum reset continuing in the short run. On the shorter timeframe both the QQQ and SPY have reset to their 20 day SMA’s where they often find support. How they react next week could tell if this week was meaningful or not. The IWM continues to be the laggard, stalled near the top of a 2 year range. Use this information as you prepare for the coming week and trad’em well.
Join the Premium Users and you can view the Full Version with 20 detailed charts and analysis: Macro Week in Review/Preview May 31, 2024
Start of Summer Annual Sale! Hi all the Start of Summer Annual Sale is on at Dragonfly Capital. Get an annual subscription for 38.2% off or pay quarterly for 15% off. Both auto-renew at that discounted rate until you decide to leave.
9 notes
·
View notes
Text
Kalkine Canada Highlights Low-Priced Equities With Technical Focus
Highlights:
Kalkine Canada report examines equities priced below a dollar across TSX Venture Exchange, CSE, NYSE, and NASDAQ
Utilizes a proprietary technical framework emphasizing momentum, breakout signals, and historical trading behavior
Sector-specific coverage includes mining, biotechnology, energy, and digital services based on technical indicators
Overview of Low-Priced Stocks in Canada and the US
Low-priced equities trading on Canadian and US exchanges form a distinct category frequently associated with early-stage growth or innovative business models. These securities, listed on platforms such as TSX Venture Exchange, Canadian Securities Exchange (CSE), NYSE, and NASDAQ, often operate in industries like biotechnology, energy, and resource exploration. Kalkine Canada provides a structured and technically-driven approach to evaluating such equities.
Technical Assessment Methodology by Kalkine
The approach used in the Kalkine Canada Stocks under 1 $ Report is based on technical indicators and historical charting rather than narrative forecasting. This methodology integrates proprietary chart-screening tools that identify and analyze trading setups. Factors such as volume surges, candlestick formations, and support-resistance zones form the basis of stock selection. Momentum indicators help assess short- and mid-term stock behavior with data-centric precision.
Stock Selection by Price and Technical Trends
Stocks featured in the report are identified based on a strict price band criterion. Only those trading below one dollar on Canadian and US exchanges are reviewed. The screening process emphasizes recent trading patterns, price consolidation ranges, and visible momentum characteristics. Companies that demonstrate irregular price activity or erratic patterns are excluded from the final listing.
Chart-Centric Observations and Market Behavior
Each stock in the publication includes detailed chart-based analysis. Observations typically highlight candlestick behavior, moving average levels, and trading volume patterns. Indicators such as Relative Strength Index (RSI), Bollinger Bands, and MACD are interpreted to reflect recent market direction. The report maintains clarity and removes speculative interpretation to ensure transparency in data reporting.
Cross-Sector Technical Representation
The report categorizes stocks across multiple sectors including cannabis, digital platforms, mining, and energy. Sector grouping is based on the common appearance of technical breakout setups. For example, firms within the energy segment showing upward momentum patterns or volume surges are grouped together to highlight shared technical signals.
Canadian Exchange Focus and Screening Infrastructure
Kalkine's report places special emphasis on Canadian exchanges known for micro-cap representation. Companies listed on the TSX Venture Exchange and the Canadian Securities Exchange often form the majority of the listings. The automated infrastructure employed by Kalkine helps assess key criteria such as liquidity, price consistency, and market entry-exit zones based solely on historical trading behavior.
Report Structure and Delivery Format
The Kalkine Canada Stocks under 1 $ Report is delivered through a digital subscription model. Each listing includes the ticker, exchange, technical chart input, and status summary. The report is designed for ease of navigation with a visually structured format. It does not incorporate any form of speculative or forward-looking content, maintaining its position as a fact-based technical resource.
Sector Trends and Technical Pattern Highlights
When several companies within a particular sector display common breakout patterns—such as bullish engulfing formations or wedge setups—the report groups them under that theme. These groupings provide clarity into sector-based momentum trends. Each technical term is explained in brief to support broader understanding of stock chart behavior.
Research Integrity and Data-Only Focus
Kalkine ensures that the Canada Stocks under 1 $ Report is centered around objective technical insights. With no promotional content or forward-looking statements, it reflects pure chart-based research. This structured and automated methodology fits into Kalkine’s broader suite of digital products aimed at technical equity assessment across markets.
0 notes
Text
Top Equity Swing Trading Strategies India – A Guide for Smart Traders
Swing trading is becoming increasingly popular among retail traders in India looking for short- to medium-term gains. If you're someone who wants to profit from market trends without committing to long-term investments or the fast pace of day trading, swing trading may be your ideal strategy.
In this guide, we explore the top equity swing trading strategies India has to offer, tailored to suit the unique characteristics of Indian stock markets. Whether you're a beginner or a seasoned trader, you'll find actionable insights to enhance your swing trading journey.
What is Swing Trading?
Swing trading is a trading style that aims to capture short- to medium-term price movements over a period ranging from a few days to several weeks. Unlike intraday trading, swing trading allows traders more time to analyze charts, study trends, and make informed decisions. It's perfect for part-time traders who cannot constantly monitor the markets.
Swing traders usually rely on technical analysis, although some also incorporate fundamental factors when picking stocks.
Why Choose Equity Swing Trading in India?
India’s equity market is vibrant, volatile, and full of opportunities. Here are a few reasons why swing trading is especially suited for Indian markets:
High Liquidity: Stocks listed on NSE and BSE offer excellent liquidity, which is crucial for entering and exiting trades swiftly.
Diverse Sectors: Indian markets allow traders to diversify across sectors like IT, pharma, banking, FMCG, and more.
Active Retail Participation: Increasing participation by retail investors adds momentum to stocks, which swing traders can capitalize on.
To get started with actionable strategies, check out our detailed resource on Equity swing trading strategies India.
Best Equity Swing Trading Strategies India Traders Can Use
Here are the most effective swing trading strategies tailored to Indian market conditions:
1. Moving Average Crossover Strategy
This strategy involves two moving averages—typically the 50-day and 200-day moving averages. When the short-term MA crosses above the long-term MA, it’s a bullish signal (golden cross). Conversely, a cross below is bearish (death cross).
Entry Point: Buy when the 50-DMA crosses above the 200-DMA.
Exit Point: Sell when the trend reverses or hits your profit target.
Indian stocks like Infosys, HDFC Bank, or Tata Motors often exhibit clear crossover patterns, making them ideal candidates.
2. Support and Resistance Bounce
This involves identifying key support and resistance levels on stock charts. Stocks tend to bounce from support levels and retreat from resistance zones.
Entry Point: Buy near support with confirmation (e.g., bullish engulfing pattern).
Exit Point: Near resistance or when price weakens.
For example, if Reliance Industries shows consistent support at ₹2,200, entering near this level can offer a favorable risk-to-reward ratio.
3. Breakout Strategy
When a stock breaks above a well-established resistance or below support with significant volume, it often continues in that direction for a few days to weeks.
Entry Point: Enter on breakout with high volume confirmation.
Exit Point: Use trailing stop-loss or exit when the price momentum weakens.
This strategy is particularly effective in earnings seasons when stock volatility surges.
4. Relative Strength Index (RSI) Reversal
RSI helps identify overbought and oversold conditions. An RSI below 30 often indicates an oversold stock, while above 70 indicates overbought conditions.
Entry Point: Buy when RSI moves above 30 after hitting oversold.
Exit Point: Sell when RSI nears 70 or shows reversal.
Many Indian mid-cap and small-cap stocks offer profitable swing trades using RSI reversal setups.
5. Volume Spike Strategy
An unexpected spike in trading volume often precedes a significant price move. Pairing volume spikes with price action and candlestick confirmation can be a powerful swing trading signal.
Entry Point: Buy when a volume spike accompanies a bullish breakout.
Exit Point: Exit when volume dries up or price loses strength.
Volume analysis works well for stocks like Adani Enterprises, IRCTC, and Zomato, where retail trader participation is high.
Risk Management in Swing Trading
Even the best strategies fail without solid risk management. Here are essential tips:
Use Stop-Loss Orders: Always define your maximum acceptable loss before entering a trade.
Limit Exposure: Avoid putting all your capital in a single trade.
Position Sizing: Adjust your lot size based on account size and risk tolerance.
Stay Updated: Indian markets are influenced by domestic and global news, earnings reports, and policy changes.
Tools and Platforms for Swing Trading in India
To execute your swing trading strategies effectively, you need the right tools:
Charting Software: TradingView, Zerodha Kite, and Upstox Pro offer excellent charting tools.
Brokerage Platforms: Choose discount brokers like Zerodha, Upstox, or Angel One for lower transaction costs.
News Feed: Use tools like Moneycontrol, Bloomberg Quint, or Economic Times Markets for real-time updates.
Common Mistakes to Avoid in Swing Trading
Overtrading: Trading too frequently can erode profits due to fees and emotional exhaustion.
Ignoring News Events: Swing trades can be disrupted by news like interest rate hikes, policy changes, or global cues.
Lack of Strategy: Jumping into trades without a tested system is a fast track to losses.
Chasing Trades: Don’t buy just because a stock is moving up rapidly. Always wait for pullbacks or setups.
Final Thoughts
India’s equity markets are full of opportunities for swing traders who are patient, strategic, and disciplined. By mastering proven Equity swing trading strategies India, traders can position themselves for consistent profits without the stress of intraday volatility.
Swing trading blends the benefits of technical analysis with a manageable timeframe—making it ideal for working professionals, part-time traders, and those who prefer quality over quantity in their trades.
Ready to Get Started?
At Finversify, we provide expert-curated trading guides, platform comparisons, and tools to help you become a better trader. Whether you're new to swing trading or looking to sharpen your edge, our resources are built with Indian traders in mind.
Visit Finversify today and take your trading to the next level with our latest insights on Equity swing trading strategies India!
0 notes
Text
Types of Candlestick Patterns Explained Simply

Types of Candlestick Patterns: A Beginner-Friendly Guide
Have you ever looked at a stock chart and felt like it was speaking a foreign language? Those little red and green bars—known as candlesticks—aren’t just random shapes. They tell stories. Stories of fear, greed, hesitation, and opportunity. If you've ever wished to understand those stories, you're in the right place.
In this article, we’re going to explore the types of candlestick patterns in a way that’s easy to grasp, even if you're brand new to trading. Think of candlestick patterns like emojis—small symbols packed with emotional context. Just as means happiness, a Hammer candlestick might signal a bullish reversal.
Explore types of candlestick patterns in simple terms. A complete guide to all types of candlestick patterns for beginners and curious traders.
Introduction to Candlestick Patterns
Candlestick patterns are visual tools used in stock trading to predict potential price movements. Each candlestick shows four key details: the opening price, closing price, highest price, and lowest price for a specific time frame.
These patterns originated in 18th-century Japan—yes, that far back!—when rice traders used them to predict future prices.
Why Candlestick Patterns Matter
Understanding candlestick patterns is like learning to read body language. While price tells you what happened, candlesticks hint at why. Are traders getting scared? Is there confidence building up? Candlestick patterns provide these answers through easy-to-spot formations.
Single Candlestick Patterns
Let’s begin with the simplest types. These involve only one candlestick and are often the first step for beginners.
The Hammer & Hanging Man
These two look nearly identical but mean very different things.
Hammer: Appears at the bottom of a downtrend. Think of it as the market “hammering out” a bottom. It has a small body and a long lower shadow.
Hanging Man: Shows up after an uptrend. Same shape as the hammer but signals a potential drop in price.
Tip: The color of the body isn’t as important as the position and size of the shadow.
Doji – The Market's Pause Button
The Doji is like a moment of hesitation. The opening and closing prices are nearly the same, forming a tiny body.
Types of Doji:
Neutral Doji: Price goes up and down, but ends unchanged.
Long-legged Doji: Large wicks on both sides, signaling major indecision.
Gravestone Doji: Looks like an upside-down “T” and suggests bearish pressure.
Dragonfly Doji: Resembles a “T” and may signal bullish strength.
Spinning Top – Indecision Alert
A Spinning Top has a small body and long upper and lower shadows. It signals that buyers and sellers fought hard but neither won.
It usually shows up during a trend and indicates a possible reversal or slowdown.
Marubozu – Full of Confidence
This candlestick has no shadows—just a solid body.
Bullish Marubozu: Opens at the low and closes at the high. Total buyer control.
Bearish Marubozu: Opens at the high and closes at the low. Total seller control.
Think of it like someone shouting, “I’m all in!” without hesitation.
Engulfing Patterns – Power Shifts
These are two-candlestick patterns that reflect changing momentum.
Bullish Engulfing: A small red candle followed by a large green one that "engulfs" it. Suggests a reversal to the upside.
Bearish Engulfing: Opposite of the above, often indicating a drop ahead.
Morning Star & Evening Star
These are three-candle patterns that often signal major turning points.
Morning Star: Appears after a downtrend. A long red candle, then a small one (any color), followed by a strong green candle. Signals a bullish reversal.
Evening Star: The bearish cousin. Appears after an uptrend.
Three White Soldiers & Three Black Crows
These are sequences of three strong candles.
Three White Soldiers: Three long green candles in a row. Very bullish.
Three Black Crows: Three long red candles. Very bearish.
These patterns indicate strong sentiment, either positive or negative.
Harami – Inside Moves
The Harami pattern looks like a small candle hiding inside a larger one.
Bullish Harami: Small green candle inside a large red one. Signals a possible reversal upward.
Bearish Harami: Small red inside a green. Signals a potential downturn.
Piercing Line & Dark Cloud Cover
These two-candle patterns are also all about reversal signals.
Piercing Line: A red candle followed by a green one that opens lower but closes past the midpoint of the previous red. Bullish sign.
Dark Cloud Cover: The opposite. Bearish sentiment taking over.
Tweezer Tops and Bottoms
Tweezer Top: Two or more candles with identical highs. Suggests price resistance and a possible drop.
Tweezer Bottom: Identical lows over two or more candles. Suggests price support and possible rise.
Think of tweezers picking the top or bottom out of a price trend.
How to Read Candlestick Patterns Together
One candle alone doesn't tell the full story. It's like reading just one sentence of a novel. To truly understand the plot, you need context. Combine patterns with:
Volume
Trend direction
Support and resistance levels
Tips for Using Candlestick Patterns Effectively
Don’t trade patterns in isolation. Always confirm with other indicators.
Practice makes perfect. Use demo accounts to test your pattern-reading skills.
Stay patient. Candlestick patterns are signals, not guarantees.
Conclusion
Candlestick patterns are like the facial expressions of the stock market. They give you hints, nudges, and sometimes loud warnings about what might happen next. Whether you’re just curious or planning to dive deeper into trading, understanding these patterns will help you navigate the charts with confidence.
Remember, while this article covers all types of candlestick patterns, experience and context make all the difference in using them effectively.
FAQs
What are candlestick patterns in simple terms? Candlestick patterns are visual tools on price charts that show how a stock's price moves during a certain period, helping predict future movements.
How many types of candlestick patterns are there? There are over 30 commonly used candlestick patterns, including single, double, and triple candlestick formations.
Are candlestick patterns reliable for trading? They can be helpful indicators but should always be used with other tools like volume and trend analysis for accuracy.
What is the most bullish candlestick pattern? The “Morning Star” and “Three White Soldiers” are among the most bullish, often indicating a strong reversal to the upside.
Can I use candlestick patterns in all markets? Yes! These patterns work in stocks, forex, commodities, and crypto markets, thanks to their universal price action behavior.
#types of candlestick patterns#all types of candlestick patterns#types of candlesticks#types of candlesticks and their meaning
0 notes