#Bullish Candlestick Patterns
Explore tagged Tumblr posts
Visit Tumblr Blog
Explore Tumblr blogs with no restrictions, modern design and the best experience.
Last Seen Tumblr Blogs


Fun Fact
In 2020, 27% of US Tumblr users had an annual household income of over $100,000.
Text
Candlestick Chart Patterns - An Essential to Earn Money Through Trading in Stock Market
Traders have been using Candlestick chart patterns for centuries to analyse price trends and predict market reversals. Developed in Japan during the 18th century, this technique gained popularity among rice traders before finding its way into modern financial markets. You might also like : Nifty 50 Prediction for Tomorrow What is a Candlestick Chart Pattern? A candlestick is a candle-like…

View On WordPress
#Bearish Candlestick Patterns#Bullish Candlestick Patterns#Candlestick Chart Patterns#Reversal Candlestick Patterns#Trading Candlestick Patterns#Types of Candlestick Patterns
0 notes
Text
Bullish Marubozu: An Important Signal for Uptrend
Among candlestick patterns in market analysis, the Bullish Marubozu candlestick is a bullish indicator that is simple to understand and very effective. Unlike other candlesticks, which may show shadows or wicks, the Bullish Marubozu is unique in its simplicity—it has no shadows.
What Is the Bullish Marubozu?
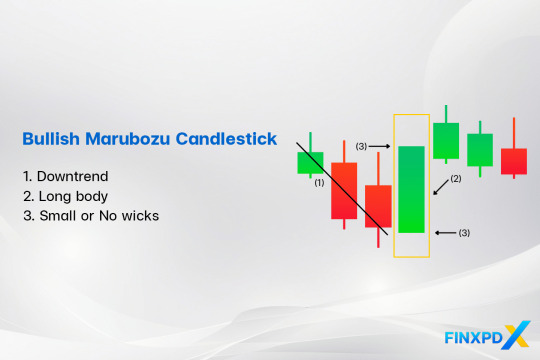
The Bullish Marubozu candlestick is a bullish candlestick pattern that shows strong buying pressure throughout the trading session. It has a long white or green body with no shadows or wicks, meaning the price opened at its lowest and closed at its highest point.
The name “White Marubozu” is another name for a Bullish Marubozu candlestick that combines its appearance and Japanese origins. “White” refers to the bullish candle color, and “Marubozu,” meaning “bald” in Japanese, describes its lack of wicks.
Characteristics of the Bullish Marubozu Candlestick
Bullish Marubozu: Features a long, solid green body with little to no wicks.
Full Bullish Marubozu: No wicks at all, showing the strongest bullish control throughout the session.
Open Bullish Marubozu: No lower wick but a small upper wick, indicating a strong upward move with slight selling pressure at the end.
Close Bullish Marubozu: A small lower wick but no upper wick, reflecting strong buying with a slightly higher open.
Read more: FinxpdX
Download PDF: 35 Powerful Candlestick Patterns
#investing#finance#investment#financial#stocks#forex#forextrading#forex market#candlestick#candlestick patterns#Marubozu#bullish#forex indicators
4 notes
·
View notes
Text
Candlestick Charting: A Tale of Tradition and Innovation from Japan
Candlestick charting's rich origins in Japan reveal timeless insights into market sentiment. Embrace the past's wisdom as we navigate today's markets, confident that understanding emotions will illuminate brighter trading paths! 🚀📈 #FinancialWisdom
Candlestick charting, a vital tool for traders globally, originated in 18th-century Japan amid a feudal society and a thriving rice market. Developed by legendary trader Munehisa Homma, it visualised price movements using candlesticks, revealing market psychology and predicting trends. Steve Nison’s introduction of candlestick charting to the West in the 1980s revolutionised technical analysis.…

View On WordPress
#Bullish and Bearish Patterns#Candlestick Patterns#Feudal Japan#Financial Education#Japan#Market Psychology#Modern Trading#Price Action#Risk management#Technical Analysis
4 notes
·
View notes
Text
How to Trade with Engulfing Candlestick Patterns
Engulfing Candlestick Patterns are a type of chart pattern used in technical analysis to predict market trends. They occur when a larger candlestick completely covers or “engulfs” the previous smaller one, signalling a potential reversal in price direction. There are two types of engulfing candlestick patterns, i.e., bullish engulfing pattern and bearish engulfing pattern. These patterns are a useful tool in determining entry and exit points for trade or understanding the market behaviour to make informed portfolio decisions.

Types of Engulfing Candlestick Patterns
How to Trade Using Engulfing Candlestick Patterns
Pros and Cons of Bullish Engulfing Candlestick Pattern
Pros and Cons of Bearish Engulfing Candlestick Pattern
#engulfing candlestick#types of engulfing candlestick pattern#bullish engulfing candlestick#bearish engulfing candlestick pattern
0 notes
Text
youtube
Mastering Forex Charts: A Beginner's Guide to Candlesticks, Lines, and Bar Patterns
#Forex trading#Forex charts#candlestick charts#line charts#bar charts#trading tutorial#chart analysis#technical analysis#Forex market#bullish patterns#bearish patterns#price movements#market trends#OHLC#trading strategies#chart reading#price action#trading tips#beginner trading#advanced trading#Forex education#PipInfuse#trading insights#market sentiment#trend analysis#trading confidence#Youtube
1 note
·
View note
Text
10 Candlestick Patterns for Effective Trading
Candlestick patterns are a powerful tool for traders to analyze price movements and predict future market behavior. Developed in Japan over 300 years ago, these patterns are widely used in modern technical analysis. This article will explore ten essential candlestick patterns that can help traders make informed decisions and enhance their trading strategies. What are Candlestick…
#Bearish Patterns#Bullish Patterns#Candlestick Patterns#Downtrend#Entry and Exit Points#Forex#Forex Traders#Forex Trading#Market Reversal#Price Movements#Risk Management#Stop-Loss#Take-Profit#Technical Analysis#Trading Psychology#Trading Strategies#Trading Strategy#Trend Direction#Trend Identification#Uptrend
1 note
·
View note
Text
#risk management#market capitalization#india#bullish reversal#market trends#chart pattern#candlestick pattern
0 notes
Text
Unlock the Secrets of Trading with Top Chart Patterns! Explore the world of chart patterns with Funded Traders Global. From understanding the basics of technical analysis to recognizing common chart patterns like head and shoulders, double tops, and flags, our blog equips you with the knowledge to enhance your trading skills. Discover advanced patterns like pennants, wedges, and harmonic patterns, and gain practical tips for effective trading. Improve your risk management, pinpoint entry and exit points, and combine chart patterns with technical indicators. Start your journey towards trading success today with Funded Traders Global!
#Advanced Chart Pattern#and Descending Triangles#and mini trading#Ascending#Basics of Technical Analysis#Benefits of Recognizing in Chart Pattern#Bullish and Bearish Flags Pattern#candlestick#candlestick Pattern#career in forex trading#chart patterns#classic reversal pattern#common chart patterns#cup and handle pattern#Double top and double bottom patterns#drawdown#financial markets#Forex trading financial freedom#FTG#ftg prop firm#ftg trading#Funded Traders Global#Gaps#Harmonic Patterns#Head and Shoulders Pattern#how to scale into a forex trade#Macro#Master the Market with These Top Chart Patterns for Trading#mastering Forex trading#micro
0 notes
Text
How To Commerce The Inverse Head-and-shoulders Sample
With the investor loosing interest in investing in shares, the volume drops and the inventory worth starts to decline. The heart trough is the deepest and the opposite two are of roughly the same depth. An inverted Head and shoulders pattern occurs when the price of a security drops marking the bearish pattern and reaches the bottom level. Then the bullish development kicks back in and pushes the worth upwards.
In this case, the inventory's price reaches three consecutive lows, separated by momentary rallies.
This breakdown ought to be convincing, occurring on robust volume and coinciding with momentum indicators pointing towards sturdy bearish momentum.
If the value advance preceding the top and shoulders top is not long, the following worth fall after its completion may be small as nicely.
All expressions of opinion are subject to vary without discover in response to shifting market circumstances.
Some progress on the US debt ceiling talks is lifting the general market mood. The Relative Strength Index indicator turned bearish, warranting that additional downside is expected, whereas the 3-day Rate of Change , continues to slide beneath its neutral level. Futures and futures choices buying and selling includes substantial risk and isn't appropriate for all investors. Please read theRisk Disclosure Statementprior to buying and selling futures merchandise.
Figuring Out The Pinnacle And Shoulders Trading Pattern
The neckline can additionally be an essential part of the pinnacle and shoulders sample as it is the stage of resistance that merchants use in order to set up the world vary to put orders. So, to find the neckline, first, find the left shoulder, head, and proper shoulder. Then connect the low factors after the left shoulder with the low after the head, which creates the neckline.
youtube
youtube
It can be difficult for newbies to determine the altering developments.
Is Your Risk/reward Enough?
Chart patterns Understand the method to learn the charts like a professional trader. Live streams Tune into day by day live streams with expert merchants and transform your buying and selling abilities. A catalyst is something that can move traders or buyers to buy or promote a stock. That’s as a outcome of you must use this sample to discover out a significant change in development. Ascending triangle pattern need a lot of traders to see the sample, so they act accordingly and the price sample plays out.

#Chart patterns#Price action trading#Trading basics#Technical analysis#Candlestick patterns#Support and resistance#Trend lines#Breakout trading#Reversal patterns#Continuation patterns#Fibonacci retracements#Moving averages#Trading strategies#Bullish engulfing pattern#Bearish engulfing pattern#Head and shoulders pattern#Double top pattern#Triple bottom pattern#Cup and handle pattern#Ascending triangle pattern#Descending triangle pattern#Wedge pattern#Harami pattern#Doji candlestick#Morning star pattern#Evening star pattern#Trading psychology#Risk management#Entry and exit points#Backtesting strategies
0 notes
Link
#CandlestickAnalysis#candlestickpatterns#chartpatterns#ForexTrading#markettrends#MomentumTrading#priceaction#ReversalPatterns#riskmanagement#StockMarket#supportandresistance#technicalanalysis#TradingSignals#TradingStrategy#TrendContinuation
2 notes
·
View notes
Text
Hammer Candlestick: Make Reversal Opportunities
In the world of technical analysis, identifying potential market reversals is important for traders seeking to maximize their profits and minimize their losses. One of the most reliable patterns for spotting these reversals is candlestick patterns, especially hammer candlestick
What Is a Hammer Candlestick?
A hammer candlestick pattern is a specific type of candlestick pattern used in technical analysis to indicate a potential reversal in a downtrend. It appears at the bottom of a downward trend and is characterized by a small body at the upper end of the trading range with a long lower shadow. The length of the lower shadow is at least twice the length of the body. This pattern suggests that despite the sellers pushing prices down significantly during the trading period, strong buying pressure drove the prices back up near the opening price by the end of the period, indicating a possible reversal to the upside.
Types of Hammer Candlestick
Hammer Candlestick The hammer candlestick pattern appears at the bottom of a downtrend and is characterized by a small body with a long lower shadow and little to no upper shadow. The lower shadow should be at least twice the length of the body.
Inverted Hammer Candlestick The inverted hammer candlestick pattern also appears at the bottom of a downtrend but is characterized by a small body with a long upper shadow and little to no lower shadow. The upper shadow should be at least twice the length of the body.
Limitations of Hammer Candlestick
Confirmation Required: A hammer candlestick alone does not guarantee a trend reversal. Subsequent bullish price action is needed to validate it.
No Price Target: The pattern does not provide a specific price target for the potential reversal, requiring other tools for determining exit points.
Context-Dependent: The hammer pattern is most reliable at the bottom of a downtrend and may not be valid in other market conditions.
False Signals: In highly volatile markets, hammer patterns can occur frequently without indicating a true reversal.
Additional Indicators Needs: It will be more effective with other technical analysis tools, rather than relying solely on the hammer candlestick.
Learn more: https://finxpdx.com/hammer-candlestick-how-to-spot-reversal-opportunities/

5 notes
·
View notes
Text
Bitcoin, the leading cryptocurrency, has recently faced a significant downturn, trading around $56,697.32. Despite this bearish phase, there are signs of a potential rebound. The Relative Strength Index (RSI) stands at 28.41, indicating oversold conditions typically seen as buying opportunities. Candlestick patterns with long lower shadows suggest buying pressure at lower levels, hinting at a price reversal.
Influential analyst CryptoJack is optimistic, predicting Bitcoin will surpass $100,000 despite the current downturn. He believes Bitcoin is near its bottom, aligning with technical indicators suggesting an oversold market.
Market data from CoinMarketCap shows Bitcoin’s market cap at $1.12 trillion, a 2.63% increase in one day, while the 24-hour trading volume has decreased by 38.03% to $31.91 billion, indicating consolidation. Traders are cautious, but the oversold RSI and bullish patterns support the possibility of a rebound. Watching for signs of reversal could signal the start of a recovery phase.
4 notes
·
View notes
Text
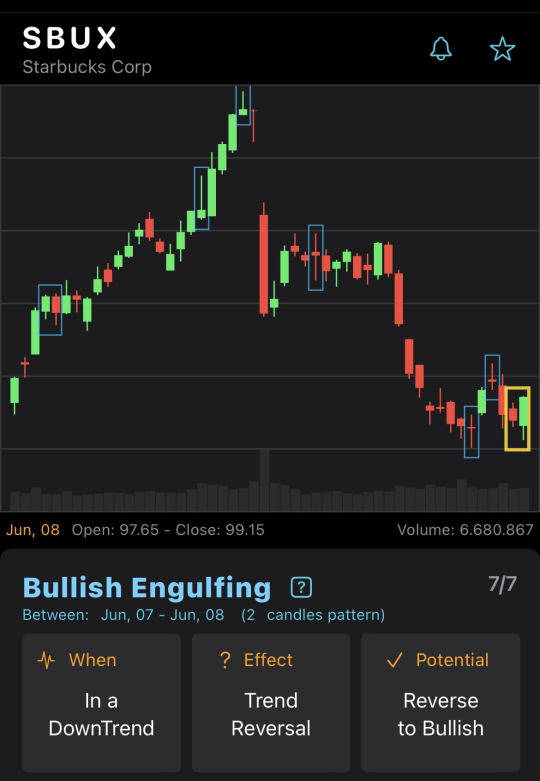
Bullish Engulfing on SBUX chart
BullishEngulfing CandleStickPattern on SBUX end-of-day chart on Jun, 08. Potential reverse to bullish.
8 notes
·
View notes
Text
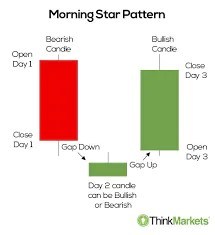
Mastering the Morning Star Pattern: A Step-by-Step Guide
Title: Mastering the Morning Star Pattern: A Step-by-Step Guide Introduction:The world of technical analysis offers traders a plethora of tools to identify potential trend reversals and market opportunities. One such powerful pattern is the Morning Star pattern, a three-candlestick formation that signals a potential bullish reversal after a downtrend. In this step-by-step guide, we will explore…
View On WordPress
#bullish reversal#candlestick patterns#comprehensive trading approach.#confirmation factors#doji candle#downtrend#false signals#market sentiment#momentum shift#Morning Star pattern#position sizing#price action#resistance levels#Risk Management#spinning top#stop-loss#support levels#technical analysis#trading strategy#trading volume#Trend Reversal#volume analysis
0 notes
Text
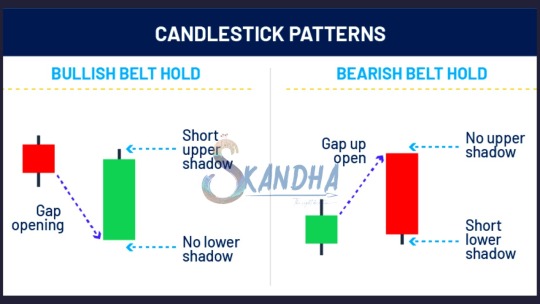
A belt hold pattern suggests that a trend may be reversing and indicates investor sentiment may have changed. When looking at them historically, there will often be a clear trend in one direction, followed by a clear trend in the other direction as the color of the candlestick changes.
There are two types of belt hold candlestick: one bullish and one bearish.
#skandhatrade #belthold #support #resistance #stock #chart #Trade #signal #patterns
#trend #Technicals #analysis #strategies #candlestick #priceaction #entry #supply #demand
To Learn More DM us
We Offer Paid Courses And Training Contact us Via
Email : [email protected]
https://forms.gle/8rWzz1gUuerxwVM49
Website: https://skandhatrade.com/
To Register for Learning:
2 notes
·
View notes
Text
Top Strategies for Successfully Trading Breakouts and Pullbacks
Trading breakouts and pullbacks are two of the most powerful strategies in technical analysis. When executed correctly, they can offer high-probability setups and consistent returns. At AtlasFunded, we help traders sharpen their edge by understanding market structure, timing, and risk management. In this guide, we’ll break down the top strategies for successfully trading breakouts and pullbacks.

What Are Breakouts and Pullbacks?
A breakout occurs when the price moves beyond a defined support or resistance level with increased volume. This often signals the start of a new trend. A pullback, on the other hand, is a temporary reversal within an existing trend—a chance for traders to enter at a better price before the trend resumes.
Both strategies are used by day traders, swing traders, and even long-term investors.
Strategy 1: Identify Key Support and Resistance Levels
The foundation of breakout and pullback trading lies in accurately identifying support and resistance zones. These levels are where price has historically reversed or paused, making them critical decision points.
Tip: Use tools like horizontal lines, Fibonacci retracements, and pivot points to mark these areas. Volume analysis can also confirm the strength of a breakout.
Strategy 2: Use Volume to Confirm Breakouts
Volume plays a crucial role in confirming the validity of a breakout. A breakout with high volume indicates strong market interest and a higher chance of follow-through.
AtlasFunded Insight: Low-volume breakouts are more likely to fail or reverse, trapping traders in poor entries. Always wait for volume confirmation before jumping in.
Strategy 3: Wait for the Retest (Breakout-Pullback Combo)
One of the most effective breakout trading methods is to wait for the retest. After the initial breakout, price often returns to test the previous resistance (now support) or support (now resistance) before continuing.
This gives traders a chance to enter with a lower risk and higher reward setup.
Strategy 4: Trendline and Moving Average Pullbacks
When trading pullbacks, using a trendline or moving average (like the 20 EMA) helps identify dynamic support or resistance. These indicators can act as reliable zones for pullback entries during a trend.
Tip: Enter on a bullish or bearish candlestick pattern near the trendline or moving average for added confirmation.
Strategy 5: Set Clear Entry, Stop, and Target Levels
Whether trading a breakout or pullback, never skip proper risk management. Define:
Entry: Above the breakout point or at the pullback support/resistance
Stop-loss: Below the breakout level or under recent swing low/high
Take-profit: Based on risk/reward ratio (e.g., 1:2 or 1:3)
At AtlasFunded, we emphasize disciplined trade planning to help traders scale with confidence.
Conclusion
Trading breakouts and pullbacks can be incredibly rewarding, but success comes from preparation, not prediction. Focus on structure, confirmation, and discipline.
Join AtlasFunded and gain access to educational resources, funding opportunities, and a community that empowers you to trade smarter, not harder.
0 notes