#CandlestickChart
Explore tagged Tumblr posts
Visit Tumblr Blog
Explore Tumblr blogs with no restrictions, modern design and the best experience.
Last Seen Tumblr Blogs


Fun Fact
In Q3 of 2020, 31% of US users access the Tumblr app daily.
Text
Candle Chart - Unveiling India's Stock Market | What Is Candlestick Chart? 🤔 | Complete Candlestick
youtube
#stockmarket#CandlestickChart#InvestingIndia#FinancialEducation#StockAnalysis#TradingStrategies#MarketTrends#StockMarketExplained#LearnWithUs#InvestmentTips#CandlestickPatterns#MarketAnalysis#Youtube
0 notes
Link
#BankNifty#BankNiftyAnalysis#Candlestickchart#flagpattern#IntradayTradeSetup#NationalStockExchange#Nifty50#Nifty50analysis#optionchain#optionchainanalysis#optionchaindata#priceactionconfirmation#technicalanalysis#tradingstrategy
0 notes
Text
Simple Guide to Candlestick Charts: Read Price Like a Pro
Candlestick Patterns: Your Trading Companion
Let’s be honest — if you’re stepping into the trading world and you still haven’t wrapped your head around candlestick charts, you’re behind. This isn’t a “nice to know.” It’s a non-negotiable skill. Because no matter what market you’re in — forex, stocks, crypto, commodities — candlestick charts, which show the opening price, are the language of price. And if you can’t read that language, you’re trading blind.
Candlestick charts are not just about understanding opening and closing prices; they are about grasping the entire market sentiment. These charts, or candlestick chart patterns, including bearish candlestick patterns originating from Japanese candlestick charting techniques, have been used for centuries to interpret price movements and predict potential trends. Whether it's the bullish engulfing pattern or the bearish engulfing pattern, each candlestick pattern provides insights into the ongoing battle between buyers and sellers.
Now don’t worry — I’m not here to throw technical jargon at you. This is your simple guide to candlestick charts. Whether you're a total beginner or someone who’s been winging it for a while, this breakdown will make it click. Because once you understand how to read candlestick charts, everything on your screen starts making more sense. You’ll learn to spot bullish reversal patterns, including a bullish pattern, and bearish reversal patterns, understand the significance of a morning star pattern or an evening star pattern, and recognize the power of a hammer candlestick pattern or a shooting star pattern.
Understanding these patterns is crucial as they often signal trend reversals or continuation patterns. For instance, a strong bullish candle, represented by a bullish engulfing candlestick pattern after a downtrend, suggests a potential shift in control of the market from sellers to buyers. Similarly, a bearish harami pattern might indicate indecision in the market, often leading to a bearish reversal signal.
By mastering the art of candlestick charting, you equip yourself with the ability to read the market's heartbeat, especially in periods of strong buying pressure, allowing you to anticipate price movements and make informed trading decisions. So, dive in, explore the various candlestick patterns, including common bullish candlestick patterns, and start decoding the bullish candles and bearish candles that narrate the story of the market.
What Is a Candlestick Chart, Really?
Let’s strip it down. A candlestick chart is a visual representation of price action over a specific time period, essential in technical analysis. Each individual “candle” on the chart provides four crucial pieces of information: the open, high, low, and close (OHLC) of that time frame, and what each candlestick represents. These four data points are not just numbers; they tell a compelling story about the ongoing battle between buyers and sellers in the market.
When you see a candle that is green or white, it indicates that the price closed higher than it opened, signaling a bullish candlestick pattern. Conversely, a red or black candle means the price closed lower than it opened, indicating a bearish candlestick pattern. The body of the candle represents the distance between the open and close prices, while the wicks (or shadows) illustrate the highs and lows during that time frame.
Understanding these basics of candlestick formation transforms your perception of price from mere numbers to insights about momentum, hesitation, rejection, and confirmation. This transformation allows your chart to start communicating with you, revealing the underlying market sentiment, especially in relation to the previous candle.
Each candlestick pattern, whether it's a bullish engulfing pattern or a bearish engulfing pattern, provides valuable insights into potential trend reversals or continuation patterns. For example, a bullish engulfing candlestick pattern appearing after a downtrend might suggest a shift in market control from sellers to buyers. Similarly, a bearish harami pattern could indicate indecision in the market, potentially leading to a bearish reversal.
By mastering the art of candlestick charting, you gain the ability to read the market's heartbeat, anticipate price movements, and make informed trading decisions. Dive into the world of various candlestick patterns and start decoding the bullish candles and bearish candles that narrate the story of the market.
For instance, a morning star pattern often signals a bullish reversal, indicating that the selling pressure is waning, and buyers might be taking control. On the other hand, an inverted hammer candlestick pattern can be a bearish reversal pattern, suggesting that the buying momentum is losing steam, and sellers might push the price down.
Moreover, understanding continuation candlestick patterns, including a bearish abandoned baby pattern and bullish continuation patterns like the rising three methods, can help you identify when a current trend is likely to continue, providing opportunities for traders to capitalize on ongoing price movements.
Incorporating these insights into your trading strategy can significantly enhance your ability to predict price movements and understand the market sentiment behind each candlestick pattern. Whether you're analyzing a shooting star candlestick pattern, a hammer candlestick pattern, or a doji candlestick pattern, and understanding how they relate to the closing price can profoundly impact your trading approach.
So, immerse yourself in the fascinating world of candlestick charting and elevate your trading prowess to new heights. By recognizing and understanding the most common candlestick patterns, such as the bullish harami pattern, piercing line pattern, or dark cloud cover pattern, you can better navigate the complexities of the market and make more informed trading decisions.
Why Candlestick Charts Matter?
Here’s the truth: no indicator, no matter how fancy, will ever beat pure price action. And candlestick charts are the foundation of that. They’re the most direct, visual way to see what price is doing, what buyers are trying to do, and how sellers are responding — or vice versa, especially in the context of a strong bearish candle. This makes them an indispensable tool in any trader's arsenal, especially when combined with the analysis of a larger bearish candle.
You’re not just seeing movement. You’re seeing intent. The candlestick technical analysis allows traders to interpret price in real time, offering a window into the market's psyche. Did buyers step in and push the price up, only to get rejected at the top? That long upper wick tells you. Did price consolidate, then burst out with a wide green body? That’s momentum. Are we getting small candles with long wicks in both directions? That’s indecision.
In short, trading with candlestick charts gives you an edge that indicators can’t — because you’re reading the raw data of the market. Not a lagging average. Not a smoothed curve. Just the real heartbeat of price. By understanding the dynamics of various candlestick patterns, such as the long bullish candle represented by bullish engulfing pattern or the bearish engulfing pattern, traders can better anticipate potential trend reversals or continuation patterns.
For instance, a bullish engulfing candlestick pattern after a downtrend suggests a potential shift in control of the market from sellers to buyers. Similarly, a bearish harami pattern might indicate indecision in the market, often leading to a bearish reversal. Recognizing these patterns equips traders with the knowledge to make informed decisions, enhancing their ability to predict price movements and understand market sentiment.
By mastering the art of candlestick charting, you gain the ability to read the market's heartbeat, anticipate price movements, and make informed trading decisions. Dive into the world of various candlestick patterns and start decoding the bullish candles and bearish candles that narrate the story of the market. Whether you are analyzing a morning star pattern, a shooting star pattern, or a hammer candlestick pattern, understanding the implications of each, particularly in the context of bullish sentiment, can significantly impact your trading strategy. So, embrace the power of candlestick charts and elevate your trading game to new heights.
How to Read Candlestick Charts Like a Trader?
Let’s keep it practical. If you want to know how to read candlestick charts, don’t just memorize patterns — learn how to read the story behind the pattern.
A bullish engulfing candle after a downtrend? That tells you buyers just overpowered the sellers. A doji at a resistance zone? That’s hesitation. A long hammer wick after a sharp move down? That’s potential reversal — if followed by confirmation.
There are dozens of types of candlestick patterns out there — pin bars, inside bars, morning stars, evening stars — but the key is understanding why they form. Are they showing strength? Exhaustion? Trap? Rejection? Don’t just name it. Understand it.
Once you get fluent in interpreting candlestick charts, your strategy becomes sharper. You’ll stop taking random trades and start recognizing candlestick chart signals that align with structure, support, resistance, trend, and timing.
Using Candlesticks with Simple Strategies
Here’s where it gets powerful — you don’t need complicated systems to trade. Some of the most effective strategies are simple trading strategies using candlesticks. Let me give you a few I personally use:
Rejection at Key Levels: Wait for price to tap into a support/resistance zone and look for a rejection candle, like a pin bar or engulfing.
Breakout Confirmation: Don’t chase the breakout. Wait for a strong candle to close above the zone, showing conviction.
Trend Continuation: When price pulls back into the trendline or moving average and prints a clean bullish or bearish candle — that’s your signal to re-enter.
You don’t need five indicators or a PhD in technicals. You just need a candlestick chart for beginners, along with an understanding of green candles strong level, and a bit of patience.
Candlestick Charts in Different Markets
1. Universal Application of Candlestick Charts
One of the most remarkable aspects of candlestick charts is their universal applicability. Whether you're analyzing Japanese candlestick charts for currency pairs like USD/JPY, examining price action on the S&P 500, or deciphering Bitcoin’s unpredictable movements, the foundational logic of candlestick charting remains unchanged. This universal nature makes candlestick charts one of the most used tools in technical analysis worldwide.
2. Candlestick Analysis in Forex
In the Forex market, where speed and volatility are the norms, candlestick analysis is invaluable. Traders use candlestick patterns to quickly assess market sentiment and make rapid decisions. Patterns like the bullish engulfing pattern or a bearish pattern such as the bearish engulfing pattern, are particularly useful in identifying potential reversals or continuations amidst fast-moving currency prices.
3. Candlestick Patterns in Stock Trading
When it comes to stocks, candlestick charts help traders spot volume-based breakouts or reactions to earnings reports. For instance, a bullish engulfing candlestick pattern following a period of consolidation might signal a strong buying opportunity. Similarly, a bearish harami pattern could indicate a potential downturn, allowing traders to adjust their positions accordingly.
4. Candlestick Charting in Cryptocurrency
In the volatile world of cryptocurrency, candlestick charts are a trader’s best ally. Given the market's tendency to print fakeouts frequently, understanding patterns like the morning star pattern, the evening star pattern, or the long-legged doji pattern can help traders navigate these false signals. The shooting star candlestick pattern and the hammer candlestick pattern are also crucial for identifying potential reversals in crypto trading.
5. The Role of Market Sentiment
Across all markets, candlestick charts provide insights into the underlying market sentiment. By interpreting patterns, traders can gauge whether the market is experiencing strong buying or selling pressure, indecision, or a potential shift in momentum. This understanding allows for more informed and strategic trading decisions.
6. The Versatility of Candlestick Charts
The versatility of candlestick charts lies in their ability to communicate the market's story, regardless of the asset class. By mastering these patterns, traders can better anticipate price movements, understand the dynamics of bullish and bearish candles, and enhance their overall trading strategy. Whether you're trading Forex, stocks, or cryptocurrencies, candlestick charts are an indispensable tool in your technical analysis toolkit.
Start With the Candle, Build the Picture
If you want to become a confident, independent trader, start with this: learn candlestick charts inside out. Don’t just watch YouTube patterns. Pull up your chart. Study real-time reactions. Screenshot your trades. Ask: What were buyers doing here? Where did they fail? Where did they win?
This isn’t about finding a magic pattern. This is about building a conversation with price. When you understand that, every candle becomes a sentence. Every setup becomes a story. And every trade you take starts to make sense.
So, yeah — indicators are great. But candlesticks? They’re the roots.
By delving deeper into candlestick charting, you unlock the ability to interpret the subtle nuances of market movements. Each candlestick pattern, including the third candle in a sequence such as the bullish engulfing pattern or the bearish engulfing pattern, serves as a chapter in the ongoing narrative of market sentiment. As you become more adept at reading these patterns, you'll start to recognize when a bullish reversal pattern is forming or when a bearish continuation pattern might signal further declines.
Moreover, understanding the implications of a morning star pattern or the significance of a shooting star candlestick pattern can provide you with a strategic edge. These patterns are not just abstract concepts; they are reflections of the market's psychology, revealing moments of indecision or shifts in momentum.
Engage actively with your charts, and you'll soon be able to anticipate potential trend reversals or identify continuation patterns with greater accuracy. This deeper comprehension allows you to make informed trading decisions, enhancing your ability to predict price movements and respond effectively to market dynamics. Embrace the power of candlestick charts, and let them guide you to becoming a more proficient and confident trader.
1 note
·
View note
Text
How to Read and Interpret Candlestick Charts
Unveiling the Secrets of Candlestick Chart Interpretation By Amir Shayan Candlestick charts are a fundamental tool in the world of financial trading. They provide crucial insights into the price movements of various assets, helping traders make informed decisions. Understanding how to read and interpret candlestick charts is a skill that can greatly enhance your trading acumen. In this article, we will delve into the intricacies of candlestick charts, unraveling their significance and guiding you through the process of deciphering their patterns.
The Language of Candlestick Charts
Candlestick charts originated in Japan centuries ago and have since become a cornerstone of technical analysis. Each candlestick represents a specific time frame, whether it's a minute, an hour, a day, or longer. The chart consists of individual candles, and the patterns they form can reveal potential trends, reversals, and price movements.
Anatomy of a Candlestick
A single candlestick consists of several key components: the body, the wick (or shadow), and sometimes the tail. The body represents the difference between the opening and closing prices during the given time frame. If the closing price is higher than the opening price, the body is typically colored or filled. Conversely, if the opening price is higher than the closing price, the body is usually empty or transparent. The wick or shadow extends above and below the body, indicating the range between the highest and lowest prices during the time period. The tail, if present, extends from the body's top or bottom, signifying the range beyond the wick.
Common Candlestick Patterns
Doji: A Doji occurs when the opening and closing prices are very close or even identical. It suggests uncertainty in the market and a potential reversal. Hammer and Hanging Man: These patterns have small bodies and a long lower tail. A Hammer appears after a downtrend and implies a potential bullish reversal, while a Hanging Man after an uptrend can indicate a bearish reversal. Bullish and Bearish Engulfing: A Bullish Engulfing pattern occurs when a small bearish candle is followed by a larger bullish one. The reverse is the Bearish Engulfing pattern. These suggest a reversal of the current trend. Morning Star and Evening Star: The Morning Star is a three-candle pattern featuring a large bearish candle, a small bearish or bullish one, and a large bullish one. It indicates a potential reversal from a downtrend. The Evening Star is the opposite, signaling a potential reversal from an uptrend.
Interpreting Candlestick Patterns
Candlestick patterns provide valuable information about market sentiment and potential price movements. For instance, a series of bullish candlesticks indicates a strong uptrend, while a succession of bearish ones suggests a downtrend. Reversal patterns, as the name suggests, may indicate an impending change in the current trend. It's important to note that while candlestick patterns can offer insights into market movements, they should be considered alongside other technical and fundamental analysis tools for a comprehensive understanding.
Conclusion
Candlestick charts are a visual representation of market dynamics, revealing the battle between buyers and sellers. By understanding the patterns they form, traders can gain a deeper understanding of market sentiment and potential price movements. However, like any tool, candlestick charts are most effective when used in conjunction with other forms of analysis. Learning to read and interpret candlestick charts takes time and practice, but it's a skill that can greatly improve your trading decisions. As you become more proficient in deciphering these patterns, you'll be better equipped to navigate the complexities of financial markets and make informed choices that align with your trading strategy. Read the full article
#candlestickcharts#candlestickpatterns#Chartinterpretation#financialmarkets#marketanalysis#marketsentiment#PriceMovements#Technicalanalysis#Tradingpatterns#tradingstrategy
0 notes
Text
Heikin-Ashi Trading Strategy: A Game-Changer for trader
Discover the Heikin-Ashi Trading Strategy, a unique approach to Forex trading that combines candlestick charts and momentum indicators. Learn how this powerful strategy can help you identify trend reversals and improve your trading performance.

The Heikin-Ashi charting technique is a unique and popular tool used by traders in the financial markets, particularly in the forex market. It provides a different perspective compared to traditional candlestick charts and offers valuable insights into price trends and reversals. This article will delve into the intricacies of the Heikin-Ashi Trading Strategy, exploring its calculation method, advantages, and how to effectively trade with it.
Understanding Heikin-Ashi Charts:
Heikin-Ashi charts resemble candlestick charts in appearance, but their construction and plotting differ significantly. Candlestick charts display the Open, Close, High, and Low prices for each period, whereas Heikin-Ashi charts utilize calculations based on the previous candle to plot the current one. This unique approach contributes to the smoothness of the Heikin-Ashi candles and provides a different perspective on market trends.
Here is how the four components of a Heikin-Ashi candle are calculated:
It is important to note that Heikin-Ashi candles are interdependent as the close and open prices of each candle are calculated using the previous candle's close and open prices. Moreover, the high and low prices are influenced by the preceding candle. This interrelation between candles contributes to the smoothing effect and delayed signals of Heikin-Ashi charts.
Advantages of Heikin-Ashi Trading:
Trading with Heikin-Ashi:
The Heikin-Ashi Trading Strategy combines the power of Heikin-Ashi reversal patterns with popular momentum indicators to enhance trading decisions. Here is a step-by-step guide on how to trade with Heikin-Ashi:
The Heikin-Ashi Trading Strategy is a powerful approach for traders in the forex market. By incorporating Heikin-Ashi charts and combining them with momentum indicators like the Stochastic Oscillator, traders can improve the accuracy of their trading decisions. The strategy's advantages, including smoothed price action, delayed signals, and clear trend identification, have contributed to its popularity among forex traders. However, it is essential to practice proper risk management and thoroughly backtest the strategy before applying it to live trading.
Please note that the answers provided above are for informational purposes only and should not be considered as financial advice. Trading in financial markets carries risks, and individuals should conduct thorough research and seek professional guidance before making any trading decisions.
#ForexTrading #TradingStrategy #HeikinAshi #CandlestickCharts #MomentumFilters #TrendReversals #TechnicalAnalysis
0 notes
Photo

Friends, Please support us by reposting or sharing our posts. #candlestickcharts #pinbartrading #pinbar #pinbarsetup #candlestick #candlestickchart #candlestickspatterns #candlestickspatterns #candlesticktrading https://www.instagram.com/p/CAvZcg5lTO_/?igshid=jhl275ai2xfx
#candlestickcharts#pinbartrading#pinbar#pinbarsetup#candlestick#candlestickchart#candlestickspatterns#candlesticktrading
0 notes
Text
Candle Chart - Unveiling India's Stock Market | What Is Candlestick Chart? 🤔 | Complete Candlestick
youtube
0 notes
Text
THE IMPORTANCE OF THE OPENING PRICE IN TRADING

The opening price in trading is crucial as it sets a reference point for price movement, often creating an anchoring bias that influences decisions throughout the day. Traders use it to identify key buy or sell moments and rely on charting techniques like candlesticks to analyze price action. By understanding its role, traders can better predict price movements and optimize their strategies.
#tradingstrategies#TradingStrategy#OpeningPrice#StockMarketTips#CandlestickCharts#TechnicalAnalysis#PriceAction
1 note
·
View note
Link
#BankNifty#Candlestickchart#NationalStockExchange#NationalStockExchangeofIndia#Nifty#Nifty50#Nifty50analysis#NiftyBank#optionchainanalysis#pivotpoint#stockmarket#StockTrading#Supportandresistancelevels#technicalanalysis#tradingstrategies#weeklyanalysis#WeeklyAnalysisofBankNiftyandNifty50
0 notes
Text
How to Read and Interpret Candlestick Charts

Unveiling the Secrets of Candlestick Chart Interpretation By Amir Shayan Candlestick charts are a fundamental tool in the world of financial trading. They provide crucial insights into the price movements of various assets, helping traders make informed decisions. Understanding how to read and interpret candlestick charts is a skill that can greatly enhance your trading acumen. In this article, we will delve into the intricacies of candlestick charts, unraveling their significance and guiding you through the process of deciphering their patterns.
The Language of Candlestick Charts
Candlestick charts originated in Japan centuries ago and have since become a cornerstone of technical analysis. Each candlestick represents a specific time frame, whether it's a minute, an hour, a day, or longer. The chart consists of individual candles, and the patterns they form can reveal potential trends, reversals, and price movements.
Anatomy of a Candlestick
A single candlestick consists of several key components: the body, the wick (or shadow), and sometimes the tail. The body represents the difference between the opening and closing prices during the given time frame. If the closing price is higher than the opening price, the body is typically colored or filled. Conversely, if the opening price is higher than the closing price, the body is usually empty or transparent. The wick or shadow extends above and below the body, indicating the range between the highest and lowest prices during the time period. The tail, if present, extends from the body's top or bottom, signifying the range beyond the wick.
Common Candlestick Patterns
Doji: A Doji occurs when the opening and closing prices are very close or even identical. It suggests uncertainty in the market and a potential reversal. Hammer and Hanging Man: These patterns have small bodies and a long lower tail. A Hammer appears after a downtrend and implies a potential bullish reversal, while a Hanging Man after an uptrend can indicate a bearish reversal. Bullish and Bearish Engulfing: A Bullish Engulfing pattern occurs when a small bearish candle is followed by a larger bullish one. The reverse is the Bearish Engulfing pattern. These suggest a reversal of the current trend. Morning Star and Evening Star: The Morning Star is a three-candle pattern featuring a large bearish candle, a small bearish or bullish one, and a large bullish one. It indicates a potential reversal from a downtrend. The Evening Star is the opposite, signaling a potential reversal from an uptrend.
Interpreting Candlestick Patterns
Candlestick patterns provide valuable information about market sentiment and potential price movements. For instance, a series of bullish candlesticks indicates a strong uptrend, while a succession of bearish ones suggests a downtrend. Reversal patterns, as the name suggests, may indicate an impending change in the current trend. It's important to note that while candlestick patterns can offer insights into market movements, they should be considered alongside other technical and fundamental analysis tools for a comprehensive understanding.
Conclusion
Candlestick charts are a visual representation of market dynamics, revealing the battle between buyers and sellers. By understanding the patterns they form, traders can gain a deeper understanding of market sentiment and potential price movements. However, like any tool, candlestick charts are most effective when used in conjunction with other forms of analysis. Learning to read and interpret candlestick charts takes time and practice, but it's a skill that can greatly improve your trading decisions. As you become more proficient in deciphering these patterns, you'll be better equipped to navigate the complexities of financial markets and make informed choices that align with your trading strategy. Read the full article
#candlestickcharts#candlestickpatterns#Chartinterpretation#financialmarkets#marketanalysis#marketsentiment#PriceMovements#Technicalanalysis#Tradingpatterns#tradingstrategy
0 notes
Link
A forex chart shows a graphical illustration of the exchange rate between two currencies. You can see both the real-time data and the past history.
Read the article to know more. https://tradersir.com/types-of-forex-charts/
#forex#fxtrading#technicalanalysis#forexcharts#linecharts#barcharts#candlestickcharts#bearish#bullish#tradingeducation#tradersir
0 notes
Photo
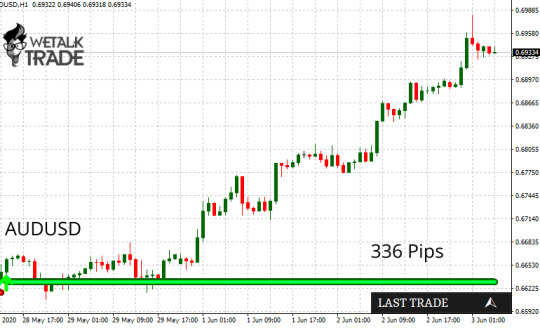
Explore Pipbreaker that works on a unique formula and gives you consistent pips!
See the performance in AUD/USD which fetched 336 pips for users. It’s your turn to join with the successful users.
Call us anytime for more details. https://wetalktrade.com/best-indicator-for-mt4/
1 note
·
View note
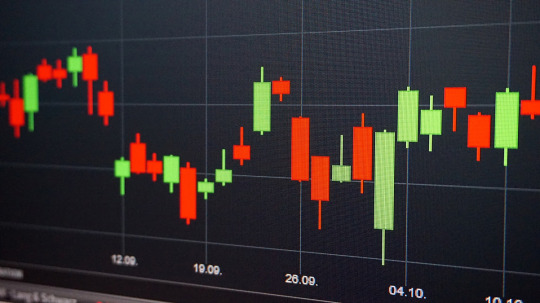
Photo

Strong bullish candle. Candlestick analysis. #candlestickcharts #candlestickchart #candlesticks #candlestickspatterns #candlestickpatterns #candlestick #candlestickanalysis #candlestickbible #candlestickschart #technicalanalysis #technicalanalyst #learn #stockmarket #sharemarket #stockmarketmalayalam #sharemarketmalayalam #greencandle #bullish #bullishmarket #bullishpattern #bullishcandle #bullishcandlesticks #bullishtrend https://www.instagram.com/p/CAX_QlnF0pI/?igshid=1ovloonok16ko
#candlestickcharts#candlestickchart#candlesticks#candlestickspatterns#candlestickpatterns#candlestick#candlestickanalysis#candlestickbible#candlestickschart#technicalanalysis#technicalanalyst#learn#stockmarket#sharemarket#stockmarketmalayalam#sharemarketmalayalam#greencandle#bullish#bullishmarket#bullishpattern#bullishcandle#bullishcandlesticks#bullishtrend
0 notes
Text
Candle Chart - Unveiling India's Stock Market | What Is Candlestick Chart? 🤔 | Complete Candlestick
youtube
0 notes
Link
0 notes
Text
How Traders Succeed In Trading Stocks - Options Pop

Options Pop is a constructive step by step program that guides users on how to stock trade appropriately. Now, how does this occur? The guide provides you simple options trade alerts as well as training that help users get the best results possible. It will help you receive simple options alerts that give a higher probability of moving up in prices in a few days. https://youtu.be/_Jb28hL2ijw Why Investors Buy Options? In the stock and option's market, the biggest profits come from owning Call or Put options. The reason is because buying options have high risk and high reward. Call Option buyers make the most money when the stock rises in price.Put Option buyers make the most money when the stock drops in price.OptionsPop.com uses just one simple strategy: Buy Call or Put Options on certain stocks and sell them within 2 to 9 days! What You Get In Options Pop Member Area Instant and unlimited to the member’s area.Great ad profitable alerts.You will also get three options pop email buy alerts each and every week.There is also an inclusion of new options training updates.The program will help you to identify put or call options that are about to move up or down.You will discover that there is no complicated trading instructions or market analysis.This program will help you to discover the best ways through which you can generate income at the same time the right time to generate better profits. Read the full article
#adamthomas#beginnerdaytradingstrategies#beginnertradingstrategies#bullputspread#callandputoption#calloption#calloptionandputoption#callorputoptions#callput#callputoption#candlestickcharts#daytrade#daytrader#daytrading#daytradingcourses#daytradingstrategiesforbeginners#Forextrading#Howto#howtobuystocks#howtodaytrade#howtomakemoneytrading#HowToSucceedinTradingOptions#howtotrade#howtotradepennystocks#ironcondor#livetrade#longstraddle#momentumdaytradingstrategies#momentumtrading#optionspopreviews2020
0 notes