#Tradingpatterns
Explore tagged Tumblr posts
Visit Tumblr Blog
Explore Tumblr blogs with no restrictions, modern design and the best experience.
Last Seen Tumblr Blogs


Fun Fact
BuzzFeed published a report claiming that Tumblr was utilized as a distribution channel for Russian agents to influence American voting habits during the 2016 presidential election in Feb 2018.
Text
LOWER LOWS AND LOWER HIGHS PATTERN

The "Lower Lows and Lower Highs" pattern is a chart formation where consecutive lower highs and lower lows suggest a short-term reversal. One trading strategy involves entering at the close when a daily bar shows both a lower high and a lower low, with an exit after 1-10 bars. Another strategy enters after two consecutive days of lower highs and lows for stronger confirmation. This pattern is often used to identify potential reversals in trending markets.
2 notes
·
View notes
Text
The Ultimate Forex Trading Patterns List: Key Patterns Every Trader Should Know
In the fast-paced world of Forex trading, understanding chart patterns is essential for identifying potential market movements. These patterns serve as visual representations of price action, helping traders make informed decisions. Mastering key Forex trading patterns can significantly enhance your trading skills and improve your chances of success. In this article, we’ll explore the most important Forex trading patterns every trader should know.

What Are Forex Trading Patterns?
Forex trading patterns are formations on price charts that indicate potential market movements. They are created by fluctuations in price over time and can help traders predict future trends. Patterns fall into two main categories: continuation patterns and reversal patterns.
Continuation patterns suggest that the current trend will continue after a brief consolidation.
Reversal patterns signal that the market is likely to change direction.
By recognizing these patterns, traders can better time their entries and exits, improving their overall strategy.
Why Forex Trading Patterns Matter
Understanding Forex patterns is crucial for several reasons:
Predicting Market Behavior: Patterns help traders anticipate price movements with greater accuracy.
Risk Management: Recognizing patterns allows traders to set appropriate stop-loss and take-profit levels.
Enhanced Decision-Making: Patterns provide a structured approach to analyzing the market, reducing emotional trading.
Now, let’s dive into the key Forex trading patterns every trader should know.
1. Head and Shoulders Pattern
Description
The Head and Shoulders pattern is a popular reversal pattern that signals a potential trend change. It consists of three peaks: a higher peak (head) between two lower peaks (shoulders). This pattern is typically seen at the end of an uptrend.
How It Works
Left Shoulder: The first peak forms after a strong upward movement.
Head: The second, higher peak represents the continuation of the uptrend.
Right Shoulder: The final peak is lower than the head, signaling weakening bullish momentum.
Once the neckline is broken, it confirms the reversal, and the price typically moves downward.
Trading Tip
Wait for the price to break below the neckline with high volume before entering a short position.
2. Inverse Head and Shoulders Pattern
Description
The Inverse Head and Shoulders pattern is the bullish counterpart of the regular Head and Shoulders. It signals a potential reversal from a downtrend to an uptrend.
How It Works
Left Shoulder: The first low forms after a strong downward movement.
Head: The second low is deeper, representing the continuation of the downtrend.
Right Shoulder: The final low is higher than the head, indicating reduced bearish pressure.
Once the price breaks above the neckline, the trend reversal is confirmed.
Trading Tip
Enter a long position when the price breaks above the neckline with strong volume.
3. Double Top and Double Bottom Patterns
Double Top Pattern
A Double Top is a bearish reversal pattern that appears after an uptrend. It consists of two consecutive peaks at roughly the same level, separated by a moderate dip.
How It Works
After the second peak, the price fails to break higher and reverses downward.
The confirmation occurs when the price breaks below the support level formed by the dip between the two peaks.
Double Bottom Pattern
The Double Bottom is the bullish counterpart of the Double Top. It signals a potential reversal from a downtrend to an uptrend.
How It Works
The price forms two consecutive lows at a similar level.
The confirmation occurs when the price breaks above the resistance level formed by the peak between the two lows.
Trading Tip
For both patterns, wait for a confirmed breakout before entering a position.
4. Triangles
Triangles are continuation patterns that indicate a period of consolidation before the trend resumes. There are three types of triangle patterns:
Ascending Triangle
This bullish pattern features a flat resistance level and rising support. It indicates that buyers are gaining strength and a breakout to the upside is likely.
Descending Triangle
This bearish pattern has a flat support level and declining resistance. It suggests that sellers are in control, and a downside breakout is expected.
Symmetrical Triangle
This neutral pattern forms when both support and resistance converge toward each other. The breakout can occur in either direction, so traders must watch for confirmation.
Trading Tip
Wait for a breakout with strong volume to confirm the direction of the trend before taking a position.
5. Flags and Pennants
Flags and pennants are short-term continuation patterns that indicate a brief pause in the current trend before it resumes.
Flag Pattern
The flag resembles a small rectangle that slopes against the prevailing trend. It indicates a brief consolidation before the trend continues.
Pennant Pattern
The pennant is similar to the flag but has a triangular shape. It forms after a strong price movement, followed by a brief consolidation period.
Trading Tip
Enter a trade in the direction of the breakout once the price exits the flag or pennant formation.
6. Wedge Patterns
Wedges are reversal or continuation patterns that indicate a narrowing price range. There are two types:
Rising Wedge
This bearish pattern forms when the price makes higher highs and higher lows, but the range narrows over time. It usually signals an impending downward breakout.
Falling Wedge
This bullish pattern forms when the price makes lower highs and lower lows, with the range narrowing over time. It typically precedes an upward breakout.
Trading Tip
Wait for a confirmed breakout before entering a trade, as false breakouts are common with wedges.
Conclusion
Mastering Forex trading patterns is a vital skill for any serious trader. By understanding and recognizing key patterns such as Head and Shoulders, Double Tops and Bottoms, Triangles, Flags, Pennants, and Wedges, you can significantly improve your market analysis and trading decisions. At Shenzhou Capital, we emphasize the importance of combining these patterns with a well-rounded trading strategy to help traders achieve consistent results.
Remember, no pattern is 100% accurate, and it’s essential to combine them with other technical indicators and sound risk management strategies. With practice and patience, these patterns can become powerful tools in your trading arsenal.
So, start observing these patterns on your charts and incorporate them into your trading strategy. The more you practice, the better you’ll get at identifying opportunities and making confident trades in the Forex market.
#ForexTrading#TradingPatterns#ForexStrategy#ForexChartPatterns#HeadAndShouldersPattern#DoubleTopPattern#DoubleBottomPattern#TrianglePattern#WedgePattern
0 notes
Text
How to Read and Interpret Candlestick Charts
Unveiling the Secrets of Candlestick Chart Interpretation By Amir Shayan Candlestick charts are a fundamental tool in the world of financial trading. They provide crucial insights into the price movements of various assets, helping traders make informed decisions. Understanding how to read and interpret candlestick charts is a skill that can greatly enhance your trading acumen. In this article, we will delve into the intricacies of candlestick charts, unraveling their significance and guiding you through the process of deciphering their patterns.
The Language of Candlestick Charts
Candlestick charts originated in Japan centuries ago and have since become a cornerstone of technical analysis. Each candlestick represents a specific time frame, whether it's a minute, an hour, a day, or longer. The chart consists of individual candles, and the patterns they form can reveal potential trends, reversals, and price movements.
Anatomy of a Candlestick
A single candlestick consists of several key components: the body, the wick (or shadow), and sometimes the tail. The body represents the difference between the opening and closing prices during the given time frame. If the closing price is higher than the opening price, the body is typically colored or filled. Conversely, if the opening price is higher than the closing price, the body is usually empty or transparent. The wick or shadow extends above and below the body, indicating the range between the highest and lowest prices during the time period. The tail, if present, extends from the body's top or bottom, signifying the range beyond the wick.
Common Candlestick Patterns
Doji: A Doji occurs when the opening and closing prices are very close or even identical. It suggests uncertainty in the market and a potential reversal. Hammer and Hanging Man: These patterns have small bodies and a long lower tail. A Hammer appears after a downtrend and implies a potential bullish reversal, while a Hanging Man after an uptrend can indicate a bearish reversal. Bullish and Bearish Engulfing: A Bullish Engulfing pattern occurs when a small bearish candle is followed by a larger bullish one. The reverse is the Bearish Engulfing pattern. These suggest a reversal of the current trend. Morning Star and Evening Star: The Morning Star is a three-candle pattern featuring a large bearish candle, a small bearish or bullish one, and a large bullish one. It indicates a potential reversal from a downtrend. The Evening Star is the opposite, signaling a potential reversal from an uptrend.
Interpreting Candlestick Patterns
Candlestick patterns provide valuable information about market sentiment and potential price movements. For instance, a series of bullish candlesticks indicates a strong uptrend, while a succession of bearish ones suggests a downtrend. Reversal patterns, as the name suggests, may indicate an impending change in the current trend. It's important to note that while candlestick patterns can offer insights into market movements, they should be considered alongside other technical and fundamental analysis tools for a comprehensive understanding.
Conclusion
Candlestick charts are a visual representation of market dynamics, revealing the battle between buyers and sellers. By understanding the patterns they form, traders can gain a deeper understanding of market sentiment and potential price movements. However, like any tool, candlestick charts are most effective when used in conjunction with other forms of analysis. Learning to read and interpret candlestick charts takes time and practice, but it's a skill that can greatly improve your trading decisions. As you become more proficient in deciphering these patterns, you'll be better equipped to navigate the complexities of financial markets and make informed choices that align with your trading strategy. Read the full article
#candlestickcharts#candlestickpatterns#Chartinterpretation#financialmarkets#marketanalysis#marketsentiment#PriceMovements#Technicalanalysis#Tradingpatterns#tradingstrategy
0 notes
Text
The Nepal Stock Exchange (NEPSE) index f... #declines #developmentbanksdecrease #digits #double #financesubgroup #financesubgroupdecline #financialmarketupdate #Khabarhub #marketanalysis #marketfluctuations #marketindices #marketperformance #Monday #nepalstockexchange #Nepalstockmarket #nepse #NEPSEindex #NEPSEindexdecrease #NEPSEtradingreport #NEPSEtradingtrends #NEPSEtrends #productionbanksdecrease #sharevalue #sharevaluedecline #stableshares #stockexchangenews #stockmarket #stockmarketanalysis #stockmarketdownturn #stockmarketfluctuation #stockmarketnews #stockmarketupdate #tradingcompanies #tradingpatterns #tradingvalue #TradingVolume #tradingvolumedecline
0 notes
Text
Patterny tradingowe na BTC 👀 #thecryptoklein #cryptoklein #trading #bybit #mexc #tradingpatterns
Patterny tradingowe na BTC 👀 #thecryptoklein #cryptoklein #trading #bybit #mexc #tradingpatterns #short from The Crypto Klein https://www.youtube.com/watch?v=LQPr_XESMa4
View On WordPress
#bestbitcointradingplatform#bitcointradingstrategies#cryptotradingbottutorial#cryptotradingtutorial#daytradingcryptotutorial#whatIsbitcointrading
0 notes
Text
youtube
https://tradegenie.com/ - Welcome to a comprehensive journey of mastering the art of trading and investment! In this video, we delve into a treasure trove of invaluable knowledge and strategies designed to elevate your trading game to the next level.
"Mastering the Principles of Abundance" sets the stage, as we discuss the fundamental concepts that underpin success in the financial markets.
Learn the art of "Creating Waves in the Market," and discover how to spot emerging trends that can propel your investments to new heights.
"Developing Low-Risk Trade Ideas" is a key theme, as we unravel the secrets of making calculated moves to protect your capital while maximizing potential gains.
"Crafting Your Low-Risk Trading Game Plan" is a must-watch segment, providing you with a blueprint for success in trading and investment.
"Advanced Trading Strategies - Techniques & Patterns" uncovers the sophisticated tactics and patterns used by seasoned traders to stay ahead of the curve.
Explore the "Your Trading Candidates" section, where we discuss trading opportunities among "Horsemen," "Kings," "Queens," "Financials," and "Oil," offering insights into diverse market sectors.
Learn the importance of "Price & Volume Filters" to refine your trading decisions, ensuring you're well-prepared to seize the right opportunities.
"Opening a New Trade" and "Using Limit Orders Intelligently" are essential techniques that can make or break your trading success, and we provide expert guidance on these critical aspects.
Whether you're a seasoned trader looking to sharpen your skills or a newcomer eager to embark on a successful trading journey, this video has something for everyone. Don't miss out on the chance to master excellence in trading and investing. Hit that play button and get ready to take your financial journey to the next level!
Limited-Time Offer: Join Swing Options Service
Join our Swing Options Service monthly at a trial price of $97 instead of the regular price of $197.
Use promo code "SAVE100" to get an incredible $100 OFF!
For more information and resources, visit our coaching page: https://tradegenie.com/coaching/
Connect with us on Facebook: / therealtradegenie
Head Office:
Trade Genie Inc.
315 South Coast Hwy 101,
Encinitas, CA 92024
Phone Number: 212-930-2245
Email: [email protected]
#TradingStrategies
#InvestmentTips
#MarketAnalysis
#FinancialEducation
#AdvancedTrading
#LowRiskTrading
#TradeIdeas
#MarketTrends
#TradingPatterns
#AbundancePrinciples
#LimitOrders
#PriceandVolume
#FinancialMarkets
#InvestmentStrategy
#TradingGamePlan
#TradeExecution
#TradingTechniques
#Trading-Strategies#Investment-Tips#Market-Analysis#Financial-Education#Advanced-Trading#LowRisk-Trading#Youtube
0 notes
Link
A recent drop in Auckland housing prices may have worked in favor of real estate brokerage agencies and private sellers. Even as the selling prices and sales volumes dropped by a margin, the trading patterns remained quite the same. Property listings in the Auckland housing market were up by 19.7% still, on a month-on-month basis; and compared to the December average selling price of $1.278 million, the January figure was a decent $1.230 million, after a 3.8% drop.
#webuyproperty#AucklandHousingMarket#housingprices#brokerageagencies#tradingpatterns#propertylistings#droppedsellingprices#droppedsalesvolume#Auckland
0 notes
Text
INTRADAY HIGH AND LOW IN THE S&P 500 BY WEEKDAY
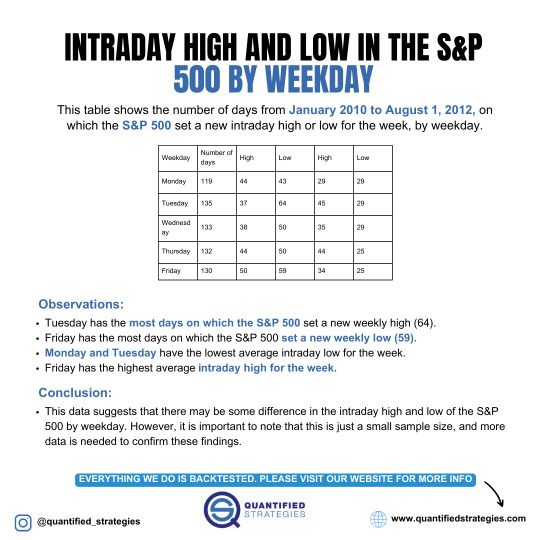
From January 2010 to August 1, 2012, the S&P 500 set new intraday highs or lows on specific weekdays. Tuesday recorded the most weekly highs (64), while Friday saw the most weekly lows (59). Monday and Tuesday had the lowest average intraday lows, whereas Friday had the highest average intraday highs. This suggests potential patterns in intraday highs and lows by weekday, though the sample size is small, and further data is needed for confirmation.
1 note
·
View note
Photo

Amazon [AMZN] TECHNICAL ANALYSIS Content: - Bollinger Bands - Channels - Moving averages - Support & Resistance - Patterns (2T) - Test Zone - - - - - - - - - - - - 📣 “Evolution is the concept that makes Humans unique” - - - - - - - - - - - - 📣 FOLLOW US FOR MORE CONTENT 👉@coneicom 👉@coneicom 👉@coneicom - - - - - - - - - - - - 🔎 If you want to know more about us visit our link in bio and discover our services! - - - - - - - - - - - - 📣 Please, no investment advice. Our purpose is education only! - - - - - - - - - - - - #amazon #amzn #tradingamazon #technicalanalysischarts #tradingpatterns #bollingerbands #supportandresistancetrading #coneicom https://www.instagram.com/p/Ca6fsPQARmG/?utm_medium=tumblr
#amazon#amzn#tradingamazon#technicalanalysischarts#tradingpatterns#bollingerbands#supportandresistancetrading#coneicom
0 notes
Photo
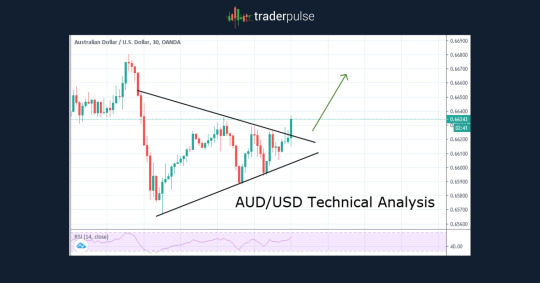
AUD/USD Technical Analysis ** This pair currently is in an asymmetrical triangle pattern. ** It breaks the line now & moves in a positive direction. ** Hence, it will be bullish from here. Get the right analysis now: Android: https://play.google.com/store/apps/details?id=com.traderpulse.analysis IOS: https://apps.apple.com/app/forex-analysis/id1358603638 Web: https://analysis.traderpulse.com
#chartpattern#tradingpatterns#asymmetrictrianglepattern#technicalanalysis#bullish#AUDUSD#freeanalysis#traderpulse
0 notes
Photo

When you read it right, you can make your profit
0 notes
Text
How to Read and Interpret Candlestick Charts

Unveiling the Secrets of Candlestick Chart Interpretation By Amir Shayan Candlestick charts are a fundamental tool in the world of financial trading. They provide crucial insights into the price movements of various assets, helping traders make informed decisions. Understanding how to read and interpret candlestick charts is a skill that can greatly enhance your trading acumen. In this article, we will delve into the intricacies of candlestick charts, unraveling their significance and guiding you through the process of deciphering their patterns.
The Language of Candlestick Charts
Candlestick charts originated in Japan centuries ago and have since become a cornerstone of technical analysis. Each candlestick represents a specific time frame, whether it's a minute, an hour, a day, or longer. The chart consists of individual candles, and the patterns they form can reveal potential trends, reversals, and price movements.
Anatomy of a Candlestick
A single candlestick consists of several key components: the body, the wick (or shadow), and sometimes the tail. The body represents the difference between the opening and closing prices during the given time frame. If the closing price is higher than the opening price, the body is typically colored or filled. Conversely, if the opening price is higher than the closing price, the body is usually empty or transparent. The wick or shadow extends above and below the body, indicating the range between the highest and lowest prices during the time period. The tail, if present, extends from the body's top or bottom, signifying the range beyond the wick.
Common Candlestick Patterns
Doji: A Doji occurs when the opening and closing prices are very close or even identical. It suggests uncertainty in the market and a potential reversal. Hammer and Hanging Man: These patterns have small bodies and a long lower tail. A Hammer appears after a downtrend and implies a potential bullish reversal, while a Hanging Man after an uptrend can indicate a bearish reversal. Bullish and Bearish Engulfing: A Bullish Engulfing pattern occurs when a small bearish candle is followed by a larger bullish one. The reverse is the Bearish Engulfing pattern. These suggest a reversal of the current trend. Morning Star and Evening Star: The Morning Star is a three-candle pattern featuring a large bearish candle, a small bearish or bullish one, and a large bullish one. It indicates a potential reversal from a downtrend. The Evening Star is the opposite, signaling a potential reversal from an uptrend.
Interpreting Candlestick Patterns
Candlestick patterns provide valuable information about market sentiment and potential price movements. For instance, a series of bullish candlesticks indicates a strong uptrend, while a succession of bearish ones suggests a downtrend. Reversal patterns, as the name suggests, may indicate an impending change in the current trend. It's important to note that while candlestick patterns can offer insights into market movements, they should be considered alongside other technical and fundamental analysis tools for a comprehensive understanding.
Conclusion
Candlestick charts are a visual representation of market dynamics, revealing the battle between buyers and sellers. By understanding the patterns they form, traders can gain a deeper understanding of market sentiment and potential price movements. However, like any tool, candlestick charts are most effective when used in conjunction with other forms of analysis. Learning to read and interpret candlestick charts takes time and practice, but it's a skill that can greatly improve your trading decisions. As you become more proficient in deciphering these patterns, you'll be better equipped to navigate the complexities of financial markets and make informed choices that align with your trading strategy. Read the full article
#candlestickcharts#candlestickpatterns#Chartinterpretation#financialmarkets#marketanalysis#marketsentiment#PriceMovements#Technicalanalysis#Tradingpatterns#tradingstrategy
0 notes
Link
intraday trading strategy work result you can see this video live
#intraday#intradaytrading#stock#stockmarket#zerodha#tradingpattern#candlestick#12septradinglive#live#live video trading result
1 note
·
View note
Photo

Become a Funded Trader in the Forex Market https://www.didimax.co.id/free-education-center-en/become-a-funded-trader-in-the-forex-market-4839
0 notes
Link
Watch our video to learn a short introduction on the inverted cup and handles pattern. It is the most bearish pattern that traders use to identify selling opportunities.
0 notes
Text
youtube
https://tradegenie.com - Are you ready to embark on a journey to unlock the secrets of profitable trading? In this exciting video, we delve into the art of trading with a focus on mastering the principles of abundance, inspired by the legendary Bruce Lee's philosophy of "Perfect Practice."
Discover the keys to creating waves in the market as we explore essential techniques for traders. From mastering key trading patterns to developing low-risk trade ideas, we guide you through a comprehensive approach to improving your trading strategy.
⏰ Time is of the essence, and we'll show you how to leverage time intervals effectively to optimize your trading decisions. Learn how to sift through the vast sea of data with price and volume filters, allowing you to focus on the most promising opportunities.
🚀 Opening a new trade can be daunting, but we demystify the process, providing you with a step-by-step guide to make informed decisions. Explore trade targets, and understand how to set and achieve them consistently.
🌅 Furthermore, we take a deep dive into the nuances of pre-market and after-market price action, revealing how these crucial periods can impact your trading. Learn to seize the opportunities that often go unnoticed.
📈��� As a special bonus, we'll also review our recent calls and puts trades, sharing real-world examples of successful trades based on these secrets. Get a sneak peek into our trading successes and gain insights that can potentially help you become a more profitable trader.
Join us for this illuminating journey into the world of trading secrets. Whether you're a beginner looking to start strong or a seasoned trader looking to enhance your skills, this video is packed with invaluable information that can lead to greater success in your trading endeavors. Don't miss out on the chance to unlock the secrets of profitable trading and take your trading skills to the next level.
Limited-Time Offer: Join Swing Options Service
Join our Swing Options Service monthly at a trial price of $97 instead of the regular price of $197.
Use promo code "SAVE100" to get an incredible $100 OFF!
For more information and resources, visit our coaching page: https://tradegenie.com/coaching/
Connect with us on Facebook: / therealtradegenie
Head Office:
Trade Genie Inc.
315 South Coast Hwy 101,
Encinitas, CA 92024
Phone Number: 212-930-2245
Email: [email protected]
#TradingSecrets
#ProfitableTrading
#Abundance
#PerfectPractice
#MarketWaves
#TradingPatterns
#LowRiskTrades
#TimeIntervals
#PriceandVolume
#TradeTargets
#PreMarket
#AfterMarket
#TradingStrategy
#TradingTips
#BruceLeeInspired
#FinancialEducation
#TradingSuccess
#StockMarket
#OptionsTrading
#TradeExamples
0 notes