#ClimateMapping
Explore tagged Tumblr posts
Visit Tumblr Blog
Explore Tumblr blogs with no restrictions, modern design and the best experience.
Last Seen Tumblr Blogs


Fun Fact
1,644 Tumblr posts in 1 second.
Text
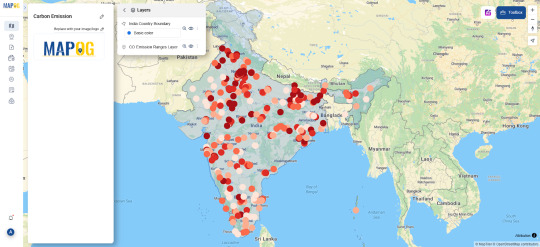
Monitoring Climate Change and Its Impact: The Power of GIS

GIS plays a vital role in monitoring climate change by transforming environmental data into visual insights, helping researchers, planners, and communities understand impacts, track changes, and make informed decisions.
Why GIS Matters in Climate Monitoring
GIS transforms satellite and environmental data into visual, interactive maps—giving scientists, planners, and communities the tools to:
Monitor Deforestation: Track forest loss and land use change using multi-temporal imagery.
Observe Glacial Retreat & Sea-Level Rise: Detect shrinking ice caps, rising coastlines, and erosion hotspots.
Map Urban Heat Islands: Analyze temperature patterns to plan greener, cooler cities.
These aren’t just data points—they're living maps that help us make smarter, faster decisions.
How It Works: A Simple Workflow
To create a carbon emissions map, start by gathering key data—such as pollutant levels and monitoring station locations. Import boundary layers and adjust their opacity for better visual clarity. Upload or enter your data, ensuring coordinates are accurately mapped. Use the Bubble tool to display the “Pollution average” across five data categories, setting a radius of 12 and choosing an appropriate color scheme. Customize the map’s layers and styles to improve readability. Once complete, analyze the map for meaningful insights and share it to help raise awareness and support informed environmental action.
Use Case: Mapping Methane Emissions from Permafrost Thaw
GIS is used to monitor and model methane release from thawing permafrost in Arctic regions. By integrating satellite imagery, soil temperature data, and terrain models, GIS helps researchers visualize methane hotspots, track emission trends, and predict future climate feedback loops—an uncommon but critical application in climate science.
Conclusion
GIS turns climate data into meaningful insights, helping us monitor environmental changes, design resilient infrastructure, and involve communities in climate solutions. Its ability to visualize and interpret change makes it an essential tool in tackling the climate crisis.
Open Tools Make It Easier
Exploring your community’s climate challenges? Cutting‑edge GIS solutions like MAPOG bring powerful capabilities—buffer analysis, multi‑layer overlays, and intuitive map‑building—to everyone from urban planners to grassroots activists. You can turn complex environmental data into clear, actionable visualizations that inform decision‑making and spark local engagement.
Have you tried using a chart of climate impacts where you live? Share your insights or questions below!
#ClimateMapping#SmartMapping#GISforClimate#GeospatialTech#EnvironmentalMonitoring#ClimateResilience#MAPOG#SustainabilityTech#DataDrivenClimateAction#InteractiveMaps#EarthObservation#ClimateScience#AdaptationStrategies
0 notes
Photo

Cycads are the world’s oldest seed-producing plants and are facing extinction. Africa is considered home to a variety of cycad species and South Africa is considered as a global hotspot for cycad diversity. To read more such interesting articles, follow @pubpoldot #cycads #extinct #iucn #climatechange #climatemapping #mapping #africa #southafrica #malaria #dengue #software #ipcc #publicpolicy #pubpoldot https://www.instagram.com/p/COFHEeDsQq7/?igshid=qxyneb64un65
#cycads#extinct#iucn#climatechange#climatemapping#mapping#africa#southafrica#malaria#dengue#software#ipcc#publicpolicy#pubpoldot
0 notes
Photo

Huge Vintage German School Map on North America, Climate and Vegetation #schoolmap #vintageschoolmap #maps #climate #climatemaps #northamerica #german #germanmaps #germany #germanschool #germanschoolmap #klima #wallmap #schoolwallmap #vegetation #nordamerika https://www.instagram.com/p/CIji1SUHHQd/?igshid=xetp5t3b6ej3
#schoolmap#vintageschoolmap#maps#climate#climatemaps#northamerica#german#germanmaps#germany#germanschool#germanschoolmap#klima#wallmap#schoolwallmap#vegetation#nordamerika
0 notes
Text
List of possible Assets and Similar projects
Assets: A height map of the entire world https://tangrams.github.io/heightmapper/#1.80907/-2.1/7.2 Climate map of certain areas https://www.weather.gov/sjt/climate-climatemaps Similar: A very high quality terrain editor https://www.world-creator.com/features/#PERFORMANCE A Game that focuses around placing various plants and animals https://store.steampowered.com/app/853550/Equilinox/
Papers/Articles: https://www.forbes.com/sites/kevinknudson/2016/05/28/how-topology-affects-the-weather/ http://www.theweatherprediction.com/habyhints/35/ https://sciencing.com/water-affect-weather-patterns-21177.html https://www.reference.com/science/mountains-affect-climate-733bcb87980449f6 https://blog.weatherops.com/how-do-mountains-affect-precipitation http://worldlandforms.com/landforms/how-landforms-affect-global-temperature-and-weather/ https://ownyourweather.com/how-does-altitude-affect-climate/ Suggestions: Either use a climate map or adjustable values for temperature and variables such as wind direction and climate type over elevation An import method for height, displacement and colour maps (All my terrain might be in black and white? Maybe invest in an AI colour scheme)
1 note
·
View note