#DataScienceProjects
Explore tagged Tumblr posts
Visit Tumblr Blog
Explore Tumblr blogs with no restrictions, modern design and the best experience.
Last Seen Tumblr Blogs


Fun Fact
Tumblr’s website traffic is steadily declining.
Text
Advanced Data Science Project Ideas for Mastering AI and Deep Learning
In 2025, working on advanced data science projects like AI-driven chatbots, image recognition systems, or predictive analytics models can significantly boost your expertise. These projects deepen your skills in machine learning, deep learning, and real-world problem-solving. They’re ideal for building a strong portfolio and standing out in the AI job market Read More..

0 notes
Text
12 Innovative Data Science Projects for 2024: Transforming Ideas into Reality
By 2025, the highest-paid skills in India include artificial intelligence, data science, cloud computing, and cybersecurity. Skills in digital marketing, blockchain, and product management are also in high demand with competitive salaries. Professionals with expertise in these areas are being hired across top tech, finance, and consulting firms. Upskilling in these fields can lead to excellent career growth
Read More...

0 notes
Text
𝐁𝐮𝐢𝐥𝐝 𝐚 𝐌𝐨𝐯𝐢𝐞 𝐑𝐞𝐜𝐨𝐦𝐦𝐞𝐧𝐝𝐚𝐭𝐢𝐨𝐧 𝐄𝐧𝐠𝐢𝐧𝐞 𝐰𝐢𝐭𝐡 𝐏𝐲𝐭𝐡𝐨𝐧 𝐒𝐭𝐞𝐩-𝐛𝐲-𝐒𝐭𝐞𝐩
In today’s digital landscape, recommendation engines play a critical role in delivering personalized user experiences. From Netflix and Amazon to Spotify and YouTube, these systems help users discover content they love while driving engagement and retention for businesses. In this in-depth tutorial, you'll learn how to build a recommendation engine using Python. Whether you're a data science student, software engineer, or machine learning enthusiast, this hands-on project will walk you through the entire process — from understanding the fundamentals to coding your own movie recommendation system.
watch https://youtu.be/alncP9nWZYQ
#RecommendationEngine#DataScienceWithPython#PythonProjects#MachineLearning#CollaborativeFiltering#ContentBasedFiltering#MovieRecommender#DataScienceTutorial#PythonMachineLearning#Personalization#ScikitLearn#PandasPython#AIProjects#SurpriseLibrary#NetflixAlgorithm#RecommenderSystem#TechTutorial#PythonForBeginners#DataScienceProjects#MLWithPython#fraoula
1 note
·
View note
Text
Tips for Creating a Compelling Data Science Portfolio that Attracts Employers
Creating a strong data science portfolio is important for showing your skills and getting noticed by employers. Here are some easy tips to help you make a great portfolio:
Pick the Right Projects: Choose projects that show off your skills in data science. Include a variety of work that demonstrates your abilities in data analysis, machine learning, and data visualization.
Explain Your Process: Don’t just show the final results; talk about how you got there. Share details about where you got the data, how you cleaned it, and what tools you used. This helps employers see how you think and solve problems.
Use Clear Visuals: Make your findings easy to understand with charts, graphs, and dashboards. Good visuals help people quickly see what you discovered.
Write Case Studies: Along with your projects, include case studies that explain the context, challenges, your approach, and the results. This story adds more depth to your work and shows your business analytics skills.
Keep It Updated: Regularly add new projects and skills to your portfolio. An updated portfolio shows that you are growing in your career and improving your technical skills.
Show Soft Skills: Include examples that show your communication skills, teamwork, and how you handle projects. Employers like to see these qualities.
Make It Easy to Use: Ensure your portfolio is easy to navigate. A clean and simple design lets your work shine and makes it easier for employers to look at your projects.
Incorporate Deep Learning and Big Data Analytics: If you have experience with deep learning or big data analytics, include those projects as well. They are highly valued in the industry and can set you apart from other candidates.
To learn more about making a great data science portfolio, consider joining a masterclass that focuses on portfolio development and presentation. This can give you extra tips to help your portfolio stand out.
#DataSciencePortfolio#PortfolioTips#DataScienceProjects#MachineLearningPortfolio#DataVisualization#CaseStudies#BigDataAnalytics#DeepLearning#DataScienceSkills#PortfolioDevelopment#DataAnalyst#CareerGrowth#JobReadyPortfolio#DataScienceJourney#DataScienceTips#SoftSkillsInTech#TechPortfolio#DataScienceCareer#PortfolioBuilding#ProfessionalGrowth#TechMasterclass#DataScienceCommunity#DataScienceShowcase#EmployerReady
1 note
·
View note
Text

Looking for Project Ideas? Stop Worrying!!! Get your final-year academic projects with us! We've got projects that make your last year memorable and meaningful. Explore, learn, and ace your final year with our academic projects. Let's make your graduation journey awesome together! For complete project guidance Contact us Now! 8328195633 Visit our Website Final Year Projects, BTech Projects, MTech Projects, MCA Projects, MSc Projects, Machine Learning Projects, AI Projects, Data Science Projects, Blockchain Projects, Networking Projects #cloudcomputingprojects #iOSDevelopment #studentprojects #dataprocomputers
#final year projects#btechprojects#mtechprojects#mcaprojects#machinelearningprojects#ai#datascienceprojects#blockchainprojects#cybersecurityprojects
0 notes
Text
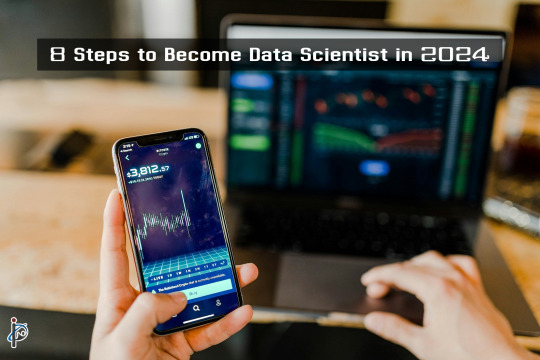
𝟖 𝐒𝐭𝐞𝐩𝐬 𝐭𝐨 𝐁𝐞𝐜𝐨𝐦𝐞 𝐃𝐚𝐭𝐚 𝐒𝐜𝐢𝐞𝐧𝐭𝐢𝐬𝐭 𝐢𝐧 𝟐𝟎𝟐𝟒
Data Science is 💥booming! Businesses are using it to solve problems, leading to high demand and good salaries for data scientists👨🔬.
This Article is your guide to becoming a data scientist, including the easiest and most valuable way to learn the skills you'll need.
#datascientistin2024#datascientists#dataengineers#datascienceprojects#datasciencejobs#carrerguides#careerplanning#fresherjobs#jobsearch#skills#blog
0 notes
Text
Assignment Week 1: Impact of Employment on Mental Health Globally.
Data Set: GAPMINDER
Motivation: The relationship between employment rates and mental health, specifically suicide rates, is a critical area of research that addresses fundamental issues of economic stability, social welfare, and public health. Understanding how employment status impacts mental well-being is essential for developing effective policies and interventions that can mitigate the adverse effects of unemployment and economic downturns on individuals and communities.
Research Question:
Is there an association between employment rates and suicide rates across countries?
Refined Research Question:
How do employment rates impact suicide rates globally, and does this association change when considering income per person, urbanization, and alcohol consumption?
Key words used: Unemployment + mental health + suicide + alcohol + urbanisation
Literature Review References:
Nordt, C., Warnke, I., Seifritz, E., & Kawohl, W. (2015). "Modelling suicide and unemployment: a longitudinal analysis covering 63 countries, 2000–2011." The Lancet Psychiatry, 2(3), 239-245.
This study explores the relationship between unemployment rates and suicide rates, providing evidence of a significant correlation, and emphasizes the importance of economic factors in mental health outcomes.
Stuckler, D., Basu, S., Suhrcke, M., Coutts, A., & McKee, M. (2009). "The public health effect of economic crises and alternative policy responses in Europe: an empirical analysis." The Lancet, 374(9686), 315-323.
This research examines the impact of economic crises on public health, including mental health outcomes like suicide rates, highlighting the influence of employment status on these outcomes.
Blakely, T. A., Collings, S. C. D., & Atkinson, J. (2003). "Unemployment and suicide. Evidence for a causal association?" Journal of Epidemiology & Community Health, 57(8), 594-600.
This paper discusses the potential causal relationship between unemployment and suicide, contributing to the understanding of how economic and employment factors affect mental health.
Chang, S. S., Gunnell, D., Sterne, J. A., Lu, T. H., & Cheng, A. T. (2009). "Was the economic crisis 1997-1998 responsible for rising suicide rates in East/Southeast Asia? A time-trend analysis for Japan, Hong Kong, South Korea, Taiwan, Singapore and Thailand." Social Science & Medicine, 68(7), 1322-1331.
This study analyzes the rise in suicide rates during economic crises in East/Southeast Asia, underscoring the relationship between employment and mental health in different cultural contexts.
Kawachi, I., & Wamala, S. (Eds.). (2006). "Globalization and Health." Oxford University Press.
This book covers various aspects of globalization and their impact on health, including how changes in employment patterns influence mental health and suicide rates worldwide.
Hypothesis:
Null Hypothesis (H0): There is no significant association between employment rates and suicide rates across countries.
Alternative Hypothesis (H1): Higher employment rates are associated with lower suicide rates across countries, even when controlling for income per person, urbanization, and alcohol consumption.
Codebook and Variables:
Group 1: Employment Rates
employrate: This variable measures the employment rate in each country, representing the percentage of the working-age population that is employed.
Group 2: Suicide Rates
suicideper100th: This variable measures the rate of suicides per 100,000 people in each country.
Control Variables:
incomeperperson: This variable measures the average income per person, representing economic status.
urbanrate: This variable measures the percentage of the population living in urban areas, representing urbanization levels.
alcconsumption: This variable measures the average alcohol consumption per person, representing potential influences on mental health.
References:
Nordt, C., Warnke, I., Seifritz, E., & Kawohl, W. (2015). Modelling suicide and unemployment: a longitudinal analysis covering 63 countries, 2000–2011. The Lancet Psychiatry, 2(3), 239-245.
Stuckler, D., Basu, S., Suhrcke, M., Coutts, A., & McKee, M. (2009). The public health effect of economic crises and alternative policy responses in Europe: an empirical analysis. The Lancet, 374(9686), 315-323.
Blakely, T. A., Collings, S. C. D., & Atkinson, J. (2003). Unemployment and suicide. Evidence for a causal association? Journal of Epidemiology & Community Health, 57(8), 594-600.
Chang, S. S., Gunnell, D., Sterne, J. A., Lu, T. H., & Cheng, A. T. (2009). Was the economic crisis 1997-1998 responsible for rising suicide rates in East/Southeast Asia? A time-trend analysis for Japan, Hong Kong, South Korea, Taiwan, Singapore and Thailand. Social Science & Medicine, 68(7), 1322-1331.
Kawachi, I., & Wamala, S. (Eds.). (2006). Globalization and Health. Oxford University Press.
1 note
·
View note
Text
In the video, you will get an idea about combo charts, how to create combo charts with different labels, line and stacked columns, scatter charts, and how to create scatter charts. Topics explained in the video 0:00 Combo and Scatter Chart in Power BI 0:06 What is Combo Chart 0:10 How to create Combo Chart with an example 0:52 Discussing the Data labels - clustered column line 01:40 Line & Stacked Column 02:25 Explaining with labels 03:00 Combo of Line & Stacked Column 03:35 What is Scatter Chart in Power BI and its features 03:48 Detailed explanation of Scatter Chart 06:05 How to present data in Scatter Chart To learn more about Power BI: • Power BI #1stepGrow#1stepGrow_Academy#datascience#powerbi#powerbitools#datascienceprojects#datavisualization#scattercharts#bubblechart#powerbichart#powerbitutorial
0 notes
Text

Data Analytics & Data Science using R Certification Course
Individuals at this job are responsible for performing different aspects of Business Analysis. He/she will be responsible for importing and pre-processing data and perform exploratory analysis to derive actionable insights along with data integrations using Data Warehouse tools.
For Further Details walk-in to our institute learn giants.
Address: Flat #202A, Building No: 1, 98/8/9/A, Cyber Hills Colony, VIP Hills, Silicon Valley, Madhapur, Hyderabad, Telangana 500081
Direction Link: https://goo.gl/maps/6tLtvUvctmQ3aQ4k7
call us: 9032444875
WhatsApp link: https://wa.link/6b8f4k
Website: https://learngiants.com/index.html
Follow us: https://www.facebook.com/Learngiants https://www.instagram.com/learngiants1/ https://in.pinterest.com/learngiants123/ https://www.youtube.com/@LearnGiants-mj7uh
datascience #madhapur #Hyderabad #certificatecourse #certificationtraining #careers #datascienceprojects #dataanalytics #bestsoftwaretraininginstitute #bestdatasciencetraining #learngiants- At learn giants.
0 notes
Text
#DataScience#datasciencecourse#datasciencecoursefees#datasciencesalary#datasciencejobs#datasciencesyllabus#datasciencemeaning#datascienceinterviewquestions#datasciencecoursesyllabus#datasciencecourses#datascienceprojects#datascienceroadmap#datascienceinternship#datasciencetutorial#datasciencetools#datasciencecoursesinindia#datesciencejavatpoint#datascience#sciencedatacourse#sciencedatabook#sciencedataanalyst#sciencedatabase#sciencedataanalystsalary#sciencedata bookpdf#sciencedatabank#sciencedatatable#sciencedatadefinition#science datacatalog#sciencedatamanagement#sciencedatajournal
0 notes
Photo


It's always beneficial to have a practical understanding of the technology you're working on💻 Though textbooks and other study materials will provide you with all of the information you require about any technology, you will not truly master it unless you work on real-world projects📊 These machine learning project ideas will assist you in learning all of the practical aspects of your career📈 Do follow for more amazing content 👉🏻 @tutort-academy 📍
#machinelearninng#machinelearningprojects#projects#datascienceprojects#datasciencetraining#data science course#tutortacademy#technology
0 notes
Text
Advanced Data Science Project Ideas for Mastering AI and Deep Learning
In 2025, working on advanced data science projects like AI-driven chatbots, image recognition systems, or predictive analytics models can significantly boost your expertise. These projects deepen your skills in machine learning, deep learning, and real-world problem-solving. They’re ideal for building a strong portfolio and standing out in the AI job market Read More....

0 notes
Photo

Improve your practical knowledge and gain corporate exposure beforehand via immersive learning live industry projects at Modulus. Our highly-qualified mentors impart the right skills and solve all your queries through one-on-one sessions. Pick your program, become industry-relevant Data Science or Cybersecurity expert in just 9-12 months and get one of the highest paid jobs in the industry in top organisations globally. For more info on our courses, visit the website www.inventico.co/modulus #datascience #datasciencelearning #datasciencecourses #modulus #gomodulus #datascienceprojects #python https://www.instagram.com/p/CHNeE66g6qJ/?igshid=tvdyz40tv65n
0 notes
Text
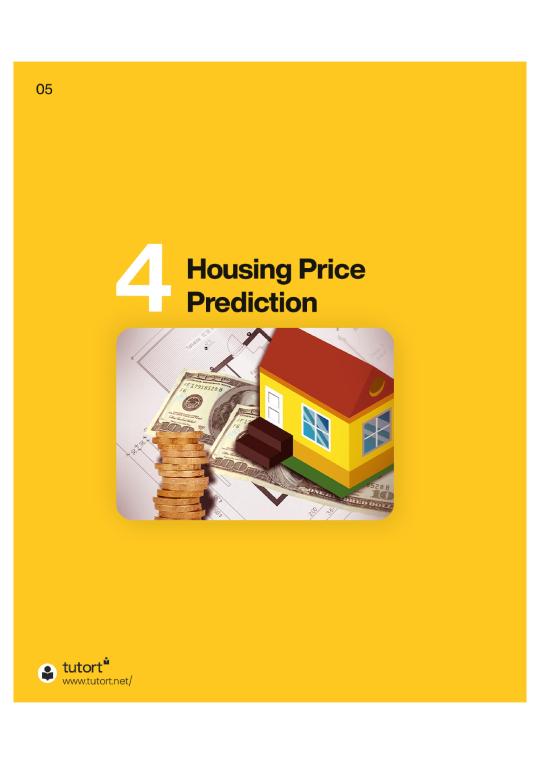
Python Project Sales Lead Analytics Part 1 | Python Project | Practical Python
Data Science with Python Real-time Projects and Challenges These real-world Data Science projects with source code offer you a propitious way to gain hands-on experience and start your journey with your dream Data Science job. The main question in a candidate mind how to achieve expertise in the Data Science field with a lot of real-world scenario and project working experience. You can achieve with the help of our Data Science advanced certification course BISP. A Live project working and a good hands-on learning experience for a candidate to learn in a such mentor ship and an expert career guidance, resume preparation and so on. The projects we include in our training are Lead analytics, advanced analytics, smart connect, opportunity analytics. We assure you can mention 03 years of working experience after completion of training with us.
1 note
·
View note
Text

The time has come consuming to find great quality free data sets accessible on the web and complete your first data science project. Picking a major and muddled data assortment to work while further developing data is a significant component of data science, you might need to begin with a clean dataset for your most memorable data science project so you can zero in on examination as opposed to data improvement. #datatrained has picked free data sets of different sorts and characteristics.
1 note
·
View note
Photo
(via How to choose your first data science project)
0 notes