#Database for Zabbix
Explore tagged Tumblr posts
Visit Tumblr Blog
Explore Tumblr blogs with no restrictions, modern design and the best experience.
Last Seen Tumblr Blogs


Fun Fact
There are dozens of funny blogs to kill time on Tumblr.
Text
How to Ensure 24/7 Uptime in Cryptocurrency Exchange Development

Cryptocurrency exchanges operate in a high-stakes environment where even a few minutes of downtime can result in significant financial losses, security vulnerabilities, and loss of customer trust. Ensuring 24/7 uptime in cryptocurrency exchange development requires a combination of advanced infrastructure, strategic planning, security measures, and continuous monitoring. This guide explores the best practices and technologies to achieve maximum uptime and ensure seamless operations.
1. Choosing the Right Infrastructure
The backbone of any high-availability exchange is its infrastructure. Consider the following:
1.1 Cloud-Based Solutions vs. On-Premises Hosting
Cloud-based solutions: Scalable, reliable, and backed by industry leaders such as AWS, Google Cloud, and Microsoft Azure.
On-premises hosting: Offers more control but requires extensive maintenance and security protocols.
1.2 High Availability Architecture
Load balancing: Distributes traffic across multiple servers to prevent overload.
Redundant servers: Ensures backup servers take over in case of failure.
Content Delivery Networks (CDNs): Improve response times by caching content globally.
2. Implementing Failover Mechanisms
2.1 Database Redundancy
Use Primary-Replica architecture to maintain real-time backups.
Implement automatic failover mechanisms for instant switching in case of database failure.
2.2 Active-Passive and Active-Active Systems
Active-Passive: One server remains on standby and takes over during failures.
Active-Active: Multiple servers actively handle traffic, ensuring zero downtime.
3. Ensuring Network Resilience
3.1 Distributed Denial-of-Service (DDoS) Protection
Implement DDoS mitigation services like Cloudflare or Akamai.
Use rate limiting and traffic filtering to prevent malicious attacks.
3.2 Multiple Data Centers
Distribute workload across geographically dispersed data centers.
Use automated geo-routing to shift traffic in case of regional outages.
4. Continuous Monitoring and Automated Alerts
4.1 Real-Time Monitoring Tools
Use Nagios, Zabbix, or Prometheus to monitor server health.
Implement AI-driven anomaly detection for proactive issue resolution.
4.2 Automated Incident Response
Develop automated scripts to resolve common issues.
Use chatbots and AI-powered alerts for instant notifications.
5. Regular Maintenance and Software Updates
5.1 Scheduled Maintenance Windows
Plan updates during non-peak hours.
Use rolling updates to avoid complete downtime.
5.2 Security Patching
Implement automated patch management to fix vulnerabilities without disrupting service.
6. Advanced Security Measures
6.1 Multi-Layer Authentication
Use 2FA (Two-Factor Authentication) for secure logins.
Implement hardware security modules (HSMs) for cryptographic security.
6.2 Cold and Hot Wallet Management
Use cold wallets for long-term storage and hot wallets for active trading.
Implement multi-signature authorization for withdrawals.
7. Scalability Planning
7.1 Vertical vs. Horizontal Scaling
Vertical Scaling: Upgrading individual server components (RAM, CPU).
Horizontal Scaling: Adding more servers to distribute load.
7.2 Microservices Architecture
Decouple services for independent scaling.
Use containerization (Docker, Kubernetes) for efficient resource management.
8. Compliance and Regulatory Requirements
8.1 Adherence to Global Standards
Ensure compliance with AML (Anti-Money Laundering) and KYC (Know Your Customer) policies.
Follow GDPR and PCI DSS standards for data protection.
8.2 Audit and Penetration Testing
Conduct regular security audits and penetration testing to identify vulnerabilities.
Implement bug bounty programs to involve ethical hackers in security improvements.
Conclusion
Achieving 24/7 uptime in cryptocurrency exchange development requires a comprehensive approach involving robust infrastructure, failover mechanisms, continuous monitoring, and security best practices. By integrating these strategies, exchanges can ensure reliability, security, and customer trust in a highly competitive and fast-evolving market.
0 notes
Text
Server Maintenance Plan: What Is It and How to Do It?
A server maintenance plan is a structured approach to ensuring that your servers remain secure, optimized, and operational. Regular maintenance helps prevent downtime, security vulnerabilities, and hardware failures, ensuring business continuity.
What Is a Server Maintenance Plan?
A server maintenance plan consists of scheduled tasks and best practices to keep servers running smoothly. It includes hardware checks, software updates, security measures, and performance optimizations.
Why It’s Important: ✔ Prevents unexpected failures ✔ Enhances server security ✔ Optimizes performance and efficiency ✔ Reduces downtime and data loss risks ✔ Ensures compliance with industry standards
How to Perform Server Maintenance?
1. Regular Software Updates & Patch Management
Keep OS and Applications Updated: Apply security patches, firmware updates, and software upgrades regularly. Update Antivirus & Security Tools: Ensure your security software is up-to-date to prevent malware and cyber threats.
2. Monitor Server Performance
Track CPU, Memory & Disk Usage: Use monitoring tools like Nagios, Zabbix, or PRTG to detect performance bottlenecks. Optimize Resource Allocation: Adjust workloads and storage as needed to maintain efficiency.
3. Backup & Disaster Recovery Plan
Schedule Regular Backups: Use automated solutions to back up critical data daily or weekly. Test Backup Recovery: Ensure backups can be restored quickly in case of failure or cyberattacks.
4. Security & Access Control
Enforce Strong Authentication: Implement multi-factor authentication (MFA) for server access. Restrict User Access: Use role-based access control (RBAC) to limit permissions. Review Firewall & Security Settings: Regularly update firewall rules and monitor logs for suspicious activity.
5. Hardware Inspections & Cooling Management
Check for Overheating: Ensure proper airflow and cooling in the data center or server room. Monitor Hardware Components: Inspect hard drives, RAM, and power supplies for failures or degradation.
6. Clean Up and Optimize Storage
Remove Unused Files & Logs: Delete temporary files and outdated logs to free up space. Defragment & Optimize Databases: Optimize database indexes and query performance to reduce load times.
7. Schedule Regular Server Reboots
Restart Periodically: Prevent memory leaks and refresh system processes by scheduling reboots during maintenance windows.
8. Document Everything
Maintain Logs & Reports: Keep records of maintenance tasks, security incidents, and system changes for future reference.
Conclusion
A well-structured server maintenance plan ensures stability, security, and efficiency. By implementing regular updates, monitoring performance, and maintaining security best practices, businesses can prevent costly downtime and extend server lifespan.
Need help with server maintenance? Consider managed IT services for 24/7 monitoring and support!

0 notes
Text
How to Optimize Your Offshore SSD VPS for Maximum Efficiency
Having a well-optimized Offshore SSD VPS Hosting Solution is crucial for maintaining high performance, security, and cost-effectiveness. By implementing the right strategies, you can maximize the efficiency of your SSD VPS Servers while ensuring a seamless experience for your users. Here’s a step-by-step guide to help you achieve optimal performance.

1. Select the Right Operating System
Choosing an efficient OS like Linux (Ubuntu, CentOS, or Debian) can reduce resource consumption and improve server stability. Opt for minimal installations to avoid unnecessary processes that slow down your Offshore VPS Hosting Services.
2. Keep Software and System Updated
Regular updates enhance security and efficiency. Ensure your Offshore VPS Hosting Solutions receive the latest OS patches, security fixes, and software upgrades to maintain peak performance.
3. Optimize SSD Performance
Since SSDs provide high-speed storage, enabling TRIM support and reducing unnecessary write operations will extend their lifespan and enhance server performance. Using a lightweight file system like ext4 or XFS can further optimize storage efficiency.
4. Implement Caching Mechanisms
Caching reduces server load and speeds up content delivery. Tools like Memcached, Redis, or Varnish can significantly improve the responsiveness of your SSD VPS Servers by storing frequently accessed data.
5. Use a Lightweight Web Server
Switching to a high-performance web server like Nginx or LiteSpeed can enhance efficiency by handling more simultaneous connections with fewer resources. This optimization is essential for Offshore VPS Hosting Services that deal with heavy traffic.
6. Optimize Database Queries
Inefficient database queries can slow down your server. Use indexing, query caching, and database optimization tools to ensure fast and efficient data retrieval. MySQL tuning with InnoDB adjustments can also improve performance.
7. Strengthen Security Measures
Securing your Offshore SSD VPS Hosting Solutions is critical. Use firewalls (like UFW or CSF), SSH key authentication, and regular malware scans to prevent vulnerabilities and unauthorized access.
8. Leverage a Content Delivery Network (CDN)
A CDN reduces latency and speeds up global content delivery by caching and distributing resources across multiple locations. This reduces the direct load on your Offshore VPS Hosting Solutions.
9. Monitor Resource Usage
Tracking CPU, memory, and disk space usage is essential for identifying bottlenecks. Use monitoring tools like Nagios, Zabbix, or htop to ensure your SSD VPS Servers operate efficiently.
10. Optimize Bandwidth Usage
Reduce data transfer costs and improve performance by enabling Gzip or Brotli compression, minimizing HTTP requests, and optimizing website images. This ensures efficient bandwidth usage for your Off shore SSD VPS Hosting Solutions.
Conclusion
By applying these optimization techniques, you can enhance the efficiency, security, and performance of your Offshore SSD VPS Hosting Solutions. A well-maintained VPS ensures smooth operation, better user experience, and cost savings. Start implementing these strategies today to get the most out of your hosting solution!
0 notes
Text
How To Install WordPress On Ubuntu 20.04
Now I want to share how to install WordPress on ubuntu 20.04 server. WordPress is an most popular opensource CMS. You can install on your vps or local server using my tutorial. ★ How To Install Zabbix 5.0 On Centos 7 ★ How To Install DNS Server (Bind9) On Ubuntu 20.04 My server info : Server IP : 10.66.11.15 Disk : 25 GB RAM : 1GB vCPU : 2 Service : WordPress Web : Apache Database : Mariadb Php :…
0 notes
Text
Top Tools for Effective System Monitoring and Maintenance
In today's technology-driven world, businesses and organizations rely heavily on IT systems to ensure smooth operations. With the increasing complexity of modern networks and infrastructures, maintaining system health, preventing downtime, and ensuring security have become paramount. This is where system monitoring and maintenance tools come into play. These tools help IT teams proactively manage system performance, identify issues, and address them before they become critical. In this blog, we’ll explore some of the top tools available for effective system monitoring and maintenance.
1. Nagios
Nagios is one of the most popular and versatile system monitoring tools. It provides comprehensive monitoring solutions for systems, applications, services, and network infrastructure. Nagios offers real-time monitoring with instant alerts and reports, enabling IT teams to address issues before they cause serious downtime.
Key Features:
Real-Time Monitoring: Nagios tracks system resources, services, and network protocols to ensure optimal system performance.
Customizable Alerts: It provides alerts via email, SMS, or other notifications based on thresholds.
Extensive Plugin Support: Nagios supports a wide range of plugins to monitor diverse services and applications.
Scalability: Whether it’s a small office or large enterprise, Nagios can scale to meet the needs of different infrastructures.
Best For: Large enterprises and organizations with complex IT infrastructures.
2. Zabbix
Zabbix is an open-source monitoring solution designed for performance monitoring of networks, servers, cloud services, and applications. Known for its flexibility and scalability, Zabbix allows users to gather detailed insights into system performance, making it easier to detect and resolve issues.
Key Features:
Comprehensive Monitoring: Zabbix monitors a wide range of systems including servers, databases, virtual environments, and cloud services.
Real-Time Alerts: Zabbix sends notifications to users in case of system failure or performance degradation.
Visualization: Custom dashboards and graphs provide clear insights into system performance.
Auto-Discovery: Automatically detects and adds new devices to the monitoring system.
Best For: Organizations that require detailed monitoring and flexible configuration options.
3. SolarWinds
SolarWinds is a well-established name in the IT monitoring space, known for providing easy-to-use tools for network and system management. SolarWinds offers a suite of solutions that can be customized to meet the needs of both small and large organizations.
Key Features:
Network Performance Monitoring: SolarWinds tracks network performance in real-time, including bandwidth usage, device health, and more.
System Monitoring: It offers robust monitoring for operating systems, applications, and server performance.
Centralized Dashboard: SolarWinds has an intuitive and user-friendly dashboard that consolidates all monitoring data in one place.
Customizable Alerts: Alerts are highly customizable to suit the specific needs of the system.
Best For: Organizations looking for an easy-to-use, all-in-one solution for network and system monitoring.
4. Prometheus
Prometheus is a powerful open-source monitoring tool designed for cloud-native environments. It’s ideal for organizations using microservices and containers, especially those relying on Kubernetes. Prometheus focuses on time-series data, providing high-resolution metrics for system monitoring.
Key Features:
Time-Series Data: Prometheus stores metrics in a time-series database, enabling efficient analysis of trends over time.
Integration with Kubernetes: Prometheus is seamlessly integrated with Kubernetes, making it a go-to option for cloud-native environments.
Powerful Query Language: PromQL (Prometheus Query Language) is a flexible query language that enables users to extract and analyze data efficiently.
Alerting: Prometheus offers built-in alerting capabilities to notify users when specific thresholds are breached.
Best For: Companies using microservices, containers, and Kubernetes who need advanced monitoring capabilities.
5. Datadog
Datadog is a cloud-based monitoring tool that offers full-stack observability, which is crucial for businesses operating in multi-cloud or hybrid cloud environments. It provides deep insights into cloud infrastructure, servers, containers, and applications, all from a single platform.
Key Features:
Cloud-Native Monitoring: Datadog is ideal for monitoring dynamic, cloud-based environments and modern infrastructure.
End-to-End Visibility: Monitors everything from network traffic to application performance and cloud services.
Integrated Dashboards: Provides real-time and customizable dashboards that help users visualize system performance.
Anomaly Detection: Datadog’s machine learning-driven anomaly detection helps identify unusual behavior across your infrastructure.
Best For: Enterprises operating in multi-cloud or hybrid environments looking for a comprehensive cloud-based solution.
6. New Relic
New Relic is a popular observability platform that helps businesses monitor their entire stack, from infrastructure to applications. It focuses on performance monitoring for applications and allows businesses to identify bottlenecks and optimize user experience.
Key Features:
Application Performance Monitoring (APM): New Relic offers deep insights into application performance, helping to identify slow transactions and errors.
Distributed Tracing: Tracks requests across microservices, providing visibility into each step of the transaction lifecycle.
Custom Dashboards: Users can create customizable dashboards for specific metrics or use cases.
Integration: New Relic integrates with numerous third-party services and platforms.
Best For: Teams focused on monitoring application performance and user experience.
7. Puppet
Puppet is an automation tool that also supports system monitoring and maintenance. It helps ensure that your IT infrastructure is always configured and maintained according to desired states, automatically applying updates and fixes to prevent issues before they arise.
Key Features:
Configuration Management: Puppet helps maintain the desired state of your systems and ensures configurations are applied consistently across the infrastructure.
Automated Updates and Patches: Puppet automates updates and security patches, reducing manual effort and minimizing downtime.
Reporting and Auditing: Puppet generates detailed reports to help you track changes and ensure compliance.
Best For: Organizations looking for automation combined with monitoring to streamline system maintenance.
8. Checkmk
Checkmk is another open-source monitoring solution that covers both IT infrastructure and application monitoring. It’s known for its easy setup, scalability, and high flexibility, making it a great choice for a wide range of environments.
Key Features:
Infrastructure Monitoring: Provides comprehensive monitoring of network devices, servers, and cloud infrastructure.
Agent and Agentless Monitoring: Supports both agent-based and agentless monitoring methods, making it adaptable to different use cases.
Powerful Dashboards: Checkmk’s dashboards are highly customizable to show exactly what you need to see.
Scalability: Checkmk can scale from small environments to large, complex infrastructures.
Best For: Medium to large businesses requiring an open-source monitoring solution with high scalability.
Conclusion
System monitoring and maintenance are critical for ensuring that your IT infrastructure runs smoothly, securely, and efficiently. Choosing the right tools for the job depends on your specific needs, infrastructure complexity, and business size. Whether you’re managing a small network or a sprawling enterprise, there’s a solution out there to fit your needs.
By leveraging these top tools, you can not only prevent downtime but also optimize system performance, enhance security, and ensure the overall health of your IT infrastructure. With proactive monitoring and regular maintenance, your systems will be more resilient and capable of handling the demands of modern business operations.
for more details please visit
www.qcsdclabs.com
www.hawkstack.com
0 notes
Text
Microsoft Azure Managed Services: Empowering Businesses with Expert Cloud Solutions
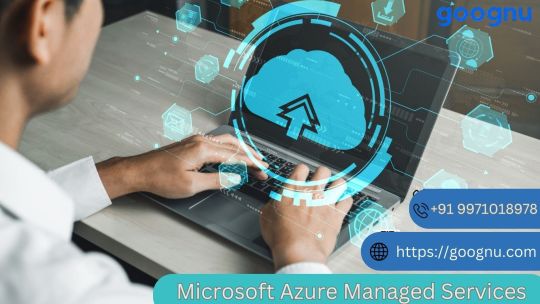
As businesses navigate the complexities of digital transformation, Microsoft Azure Managed Services emerge as a crucial tool for leveraging the potential of cloud technology. These services combine advanced infrastructure, automation, and expert support to streamline operations, enhance security, and optimize costs. For organizations seeking to maximize the benefits of Azure, partnering with a trusted Managed Service Provider (MSP) like Goognu ensures seamless integration and efficient management of Azure environments.
This article explores the features, benefits, and expertise offered by Goognu in delivering customized Azure solutions.
What Are Microsoft Azure Managed Services?
Microsoft Azure Managed Services refer to the specialized support and tools provided to organizations using the Azure cloud platform. These services enable businesses to effectively manage their Azure applications, infrastructure, and resources while ensuring regulatory compliance and data security.
Azure Managed Service Providers (MSPs) like Goognu specialize in delivering tailored solutions, offering businesses a wide range of support, from deploying virtual machines to optimizing complex data services.
Why Choose Goognu for Azure Managed Services?
With over a decade of expertise in cloud solutions, Goognu stands out as a leading provider of Microsoft Azure Managed Services. The company’s technical acumen, customer-centric approach, and innovative strategies ensure that businesses can fully harness the power of Azure.
Key Strengths of Goognu
Extensive Experience With more than 10 years in cloud management, Goognu has built a reputation for delivering reliable and efficient Azure solutions across industries.
Certified Expertise Goognu's team includes certified cloud professionals who bring in-depth knowledge of Azure tools and best practices to every project.
Tailored Solutions Recognizing the unique needs of every business, Goognu designs and implements solutions that align with individual goals and challenges.
Comprehensive Azure Services Offered by Goognu
Goognu provides a holistic suite of services under the umbrella of Microsoft Azure Managed Services. These offerings address a wide range of operational and strategic needs, empowering businesses to achieve their objectives efficiently.
1. Azure Infrastructure Management
Goognu manages critical Azure components such as:
Virtual Machines
Storage Accounts
Virtual Networks
Load Balancers
Azure App Services
By handling provisioning, configuration, and ongoing optimization, Goognu ensures that infrastructure remains reliable and performant.
2. Data Services and Analytics
Goognu provides expert support for Azure data tools, including:
Azure SQL Database
Azure Cosmos DB
Azure Data Factory
Azure Databricks
These services help businesses integrate, migrate, and analyze their data while maintaining governance and security.
3. Security and Compliance
Security is paramount in cloud environments. Goognu implements robust measures to protect Azure infrastructures, such as:
Azure Active Directory for Identity Management
Threat Detection and Vulnerability Management
Network Security Groups
Compliance Frameworks
4. Performance Monitoring and Optimization
Using tools like Nagios, Zabbix, and Azure Monitor, Goognu tracks performance metrics, system health, and resource usage. This ensures that Azure environments are optimized for scalability, availability, and efficiency.
5. Disaster Recovery Solutions
With Azure Site Recovery, Goognu designs and implements strategies to minimize downtime and data loss during emergencies.
6. Application Development and Deployment
Goognu supports businesses in building and deploying applications in Azure, including:
Cloud-Native Applications
Containerized Applications (Azure Kubernetes Service)
Serverless Applications (Azure Functions)
Traditional Applications on Azure App Services
7. Cost Optimization
Cost management is critical for long-term success in the cloud. Goognu helps businesses analyze resource usage, rightsize instances, and leverage Azure cost management tools to minimize expenses without sacrificing performance.
Benefits of Microsoft Azure Managed Services
Adopting Azure Managed Services with Goognu provides several transformative advantages:
1. Streamlined Operations
Automation and expert support simplify routine tasks, reducing the burden on in-house IT teams.
2. Enhanced Security
Advanced security measures protect data and applications from evolving threats, ensuring compliance with industry regulations.
3. Cost Efficiency
With a focus on resource optimization, businesses can achieve significant cost savings while maintaining high performance.
4. Improved Performance
Proactive monitoring and troubleshooting eliminate bottlenecks, ensuring smooth and efficient operations.
5. Scalability and Flexibility
Azure’s inherent scalability, combined with Goognu’s expertise, enables businesses to adapt to changing demands effortlessly.
6. Focus on Core Activities
By outsourcing cloud management to Goognu, businesses can focus on innovation and growth instead of day-to-day operations.
Goognu’s Approach to Azure Managed Services
Collaboration and Strategy
Goognu begins by understanding a business’s specific needs and goals. Its team of experts collaborates closely with clients to develop strategies that integrate Azure seamlessly into existing IT environments.
Customized Solutions
From infrastructure setup to advanced analytics, Goognu tailors its services to align with the client’s operational and strategic objectives.
Continuous Support
Goognu provides 24/7 support, ensuring that businesses can resolve issues quickly and maintain uninterrupted operations.
Unlocking Innovation with Azure
Goognu empowers businesses to accelerate innovation using Azure’s cutting-edge capabilities. By leveraging cloud-native development, AI/ML operations, IoT integration, and workload management, Goognu helps clients stay ahead in competitive markets.
Why Businesses Choose Goognu
Proven Expertise
With a decade of experience in Microsoft Azure Managed Services, Goognu delivers results that exceed expectations.
Customer-Centric Approach
Goognu prioritizes customer satisfaction, offering personalized solutions and unwavering support.
Advanced Capabilities
From AI/ML to IoT, Goognu brings advanced expertise to help businesses unlock new opportunities with Azure.
Conclusion
Microsoft Azure Managed Services offer unparalleled opportunities for businesses to optimize their operations, enhance security, and achieve cost efficiency. By partnering with a trusted provider like Goognu, organizations can unlock the full potential of Azure and focus on their strategic goals.
With a proven track record and unmatched expertise, Goognu delivers comprehensive Azure solutions tailored to the unique needs of its clients. Whether it’s infrastructure management, data analytics, or cost optimization, Goognu ensures businesses can thrive in today’s digital landscape.
Transform your cloud journey with Goognu’s Microsoft Azure Managed Services. Contact us today to discover how we can help you achieve your business goals.
0 notes
Text
Root Cause Analysis and Event Correlation: Understanding the Differences and Interactions
In today’s increasingly complex IT environments, ensuring smooth operations and minimizing downtime is a major priority. Two critical approaches in troubleshooting and issue resolution are Root Cause Analysis (RCA) and Event Correlation. While they are distinct methodologies, they often work in conjunction to identify and resolve incidents in large-scale systems. Understanding the differences and how they can complement each other is essential for IT administrators, network managers, and DevOps professionals.
What is Root Cause Analysis?
Root Cause Analysis (RCA) is a systematic process used to identify the underlying cause of an issue or failure. Instead of just addressing the symptoms, RCA digs deeper into the series of events or conditions that led to a problem, helping to prevent the recurrence of similar incidents in the future.
Key Steps in Root Cause Analysis:
Problem Identification: Clearly define the problem or failure. This could be a system crash, network downtime, or a performance issue.
Data Collection: Gather all relevant data, including system logs, error messages, and performance metrics at the time of the incident.
Cause Identification: Use various techniques such as the 5 Whys, Fishbone Diagram, or Fault Tree Analysis to trace the problem back to its root cause.
Implement Solutions: Once the root cause is determined, implement corrective measures to prevent future occurrences.
Monitoring and Validation: After implementing the fix, continuous monitoring is necessary to validate that the solution has indeed resolved the issue.
Techniques Used in Root Cause Analysis:
5 Whys: A questioning technique where you ask “Why?” five times to get to the root of the problem.
Fishbone Diagram: Also known as Ishikawa or cause-and-effect diagram, this helps visualize potential causes under various categories such as people, process, equipment, or environment.
Fault Tree Analysis: A graphical method of showing the relationships between different failure events to understand how they contributed to the problem.
What is Event Correlation?
Event Correlation is the process of analyzing multiple events in a system or network to identify patterns, relationships, or dependencies. In large IT environments, numerous events (such as error messages, alerts, or log entries) are generated by different systems. Event correlation helps in piecing together these events to identify a single underlying issue or cause.
How Event Correlation Works:
Event Aggregation: Collect events from different sources like application logs, network devices, databases, and servers.
Pattern Matching: Use algorithms and predefined rules to correlate events based on patterns. For instance, if three different network devices report similar errors, it may indicate a broader issue, like a network outage or misconfiguration.
Event Prioritization: After identifying correlated events, prioritize them to focus on the most critical issues, reducing noise and unnecessary alerts.
Alerting and Response: Once event correlation identifies significant patterns, it can trigger alerts, allowing IT teams to respond quickly to the root cause before the issue escalates.
Event Correlation Tools:
SIEM (Security Information and Event Management): Tools like Splunk, ArcSight, or IBM QRadar aggregate and correlate security events to detect breaches or abnormal activities.
Network Monitoring Tools: Tools like SolarWinds and Zabbix use event correlation to detect issues in network performance or hardware failures.
Log Analysis Tools: ELK Stack (Elasticsearch, Logstash, Kibana) correlates log events across different systems to identify patterns.
The Relationship Between Root Cause Analysis and Event Correlation
While Root Cause Analysis and Event Correlation are distinct, they are often complementary processes in IT operations.
Event Correlation is used to identify patterns and aggregate related events, simplifying the identification of the problem’s scope. By connecting seemingly unrelated events, event correlation can provide a clearer picture of what’s happening across the system.
Once related events are correlated, Root Cause Analysis takes over to dig deeper into the specifics of why the issue occurred. RCA uses the event data to trace back to the actual cause of failure, focusing on preventing the issue in the future.
For example, if a network issue occurs, event correlation can help determine that multiple devices across different locations experienced connectivity drops at the same time. This would suggest a centralized issue. Root Cause Analysis can then determine whether a specific server misconfiguration, firewall setting, or faulty hardware caused the outage.
Practical Application of RCA and Event Correlation
Scenario 1: Database Downtime
Event Correlation: Detect multiple error messages from the database layer, web servers, and network appliances showing high latency or connection drops at the same time.
RCA: Use the correlated events to investigate further and find that a failed update to the database server caused a series of cascading issues, leading to downtime.
Scenario 2: Security Breach
Event Correlation: Correlate failed login attempts, unusual file transfers, and firewall alerts across multiple systems.
RCA: Investigate and identify that a specific vulnerability in the system allowed unauthorized access, leading to the breach.
Conclusion
Root Cause Analysis and Event Correlation are both powerful tools in maintaining the stability and security of IT infrastructures. While event correlation helps in connecting the dots between related issues, RCA digs deep into identifying and eliminating the root cause. By using both methods effectively, organizations can reduce downtime, improve system performance, and prevent future incidents from recurring.
Leveraging the right tools and techniques for both processes ensures a more reliable and resilient IT environment.
0 notes
Text
How to Optimize Your Computer Server for Maximum Performance?
Optimizing your computer server for maximum performance involves a series of steps that enhance its efficiency, reliability, and speed. Here are some detailed instructions to help you achieve this:
1. Hardware Optimization
a. Upgrade Server Hardware
RAM: Ensure your server has sufficient RAM. Upgrade to ECC (Error-Correcting Code) RAM for better reliability.
Storage: Use SSDs (Solid State Drives) instead of HDDs (Hard Disk Drives) for faster read/write speeds.
CPU: Upgrade to a more powerful CPU with higher clock speeds and more cores.
Network Interface Cards (NICs): High-speed NICs, such as 10GbE, are used to handle increased network traffic.
b. Maintain Hardware
Regular Cleaning: Dust and clean server components to prevent overheating.
Monitor Hardware Health: Use tools to monitor temperatures, voltages, and fan speeds.
2. Software Optimization
a. Optimize Operating System (OS)
Choose the Right OS: Select an OS tailored to your server's role (e.g., Linux distributions like Ubuntu Server or CentOS for web servers).
Update Regularly: Keep the OS and all software up to date with the latest patches and security updates.
Remove Unnecessary Services: Disable or uninstall services and applications that are not needed.
b. Optimize Applications
Database Optimization: Use indexing and query optimization techniques. Consider database clustering for load balancing.
Web Server Optimization: For Apache, use modules like mod_deflate for compression. For Nginx, adjust worker processes and caching settings.
Caching: Implement caching mechanisms such as Memcached or Redis to reduce database load.
3. Network Optimization
a. Configure Network Settings
Adjust TCP/IP Settings: Optimize parameters such as TCP window size and timeout settings.
DNS Configuration: Use reliable and fast DNS services.
b. Network Security
Firewall Configuration: Use firewalls to block unnecessary ports and protect against attacks.
Use VPNs: Secure remote access with VPNs to ensure encrypted connections.
4. Performance Monitoring and Tuning
a. Use Monitoring Tools
System Monitoring: Tools like Nagios, Zabbix, or Prometheus can provide insights into system performance and alert you to issues.
Log Analysis: Regularly analyze logs to detect and resolve errors and performance bottlenecks.
b. Regular Performance Tuning
Load Balancing: Distribute workloads across multiple servers to prevent any single server from being overwhelmed.
Scalability Planning: Plan for future growth by considering horizontal and vertical scaling options.
5. Security Enhancements
a. Regular Security Audits
Vulnerability Scanning: Use tools like Nessus to identify and address vulnerabilities.
Penetration Testing: Conduct regular penetration tests to find and fix security weaknesses.
b. Data Protection
Backups: Implement regular, automated backups and test restore procedures.
Encryption: Use encryption for sensitive data, both in transit and at rest.
6. Energy Efficiency
a. Power Management
Use Energy-Efficient Hardware: Choose energy-efficient hardware components.
Configure Power Settings: Adjust power settings to reduce consumption during low-usage periods.
b. Cooling Optimization
Efficient Cooling Systems: Use advanced cooling systems to maintain optimal temperatures.
Hot and Cold Aisle Containment: Implement hot and cold aisle containment in data centers to improve cooling efficiency.
Conclusion
By systematically addressing these areas, you can significantly enhance your server's performance, reliability, and security. Regular monitoring, updates, and proactive maintenance are key to maintaining optimal server performance over time. You can check more at Netseg.me.
0 notes
Text
Introducing The Metrics Exporter For Dell PowerStore

Metrics Exporter for PowerStore can help you unleash the “power” of your metrics and take your company to new heights. Acquiring real-time insights on metrics such as performance, capacity utilization, or power consumption becoming essential in the rapidly evolving world of IT infrastructure and services, and in certain situations, it can even set you apart from the competition.
Dell PowerStore
Dell Technologies has made available Metrics Exporter for Dell PowerStore, an open-source tool on their official GitHub page that allows users to extract metrics from their enterprise storage solution PowerStore and have them used by well-known third-party tools like Grafana, Prometheus, and Zabbix. This could be a strategy to maximize your IT operations by releasing the “power” of your storage metrics.
Visibility into your whole infrastructure environment is made possible by tracking indicators such as performance (IOPS/bandwidth/latency), capacity usage (available/used space), and power consumption (temperature/watts). Keep an eye on your surroundings to identify any capacity restrictions or performance bottlenecks. By determining which resources are oversaturated or underutilized, you may distribute resources more effectively and optimize them as needed.
Forecasting future storage requirements and analyzing existing data enable effective capacity planning. Last but not least, monitoring power usage enables businesses to reach their sustainability targets by optimizing for energy efficiency and cutting operating expenses. Making better decisions, increasing operational efficiency, and ensuring the efficient use of your IT infrastructure assets are all possible with the tool.
Metrics Exporter for Dell PowerStore is a tool for more than just tracking metrics. In order to maximize performance, enhance capacity utilization, reallocate resources according to need, and contribute to a more sustainable future, it can be a strategic asset that gives Dell’s clients the ability to make data-driven decisions. Unlock the “power” of your measurements to achieve unprecedented success for your company.
Overview of the Dell PowerStore Metrics Exporter
End-to-end visibility into crucial workloads is necessary for enterprise monitoring. High-level monitoring and alerting are required to inform the appropriate personnel about emerging trends or urgent problems that need to be addressed.
A multitude of performance measures are gathered by Dell PowerStore to assist you in managing and keeping an eye on your vital storage resources. For a more thorough look at PowerStore, you can simply check these metrics in CloudIQ and PowerStore Manager.
PowerStore can also be integrated with third-party open source applications for administration and monitoring. Zabbix and Grafana are two examples of enterprise monitoring systems that let you monitor different infrastructure components from a single pane of glass.
Making performance metrics public
Customers can enhance the metrics capabilities of PowerStore Manager or link it with widely used enterprise monitoring tools by using the Metrics Exporter for Dell PowerStore. Performance metrics from PowerStore may be consumed by enterprise monitoring systems like Zabbix and Grafana thanks to an open-source programme called the Metrics Exporter for Dell PowerStore. Performance metrics are captured by PowerStore Exporter by utilising the PowerStore REST API.
The well-known open-source event monitoring programme Prometheus receives the metrics that PowerStore Exporter collects and distributes. PowerStore performance data can be utilized directly for monitoring and alerting through Prometheus when it is stored in a Prometheus time-series database (TSDB). Alternatively, it can be used as a data source by well-known open-source Prometheus-supporting monitoring applications like Zabbix and Grafana.
PowerStore
Among the categories of PowerStore metrics that are accessible are:
Hard Drive with Battery
Fan on the network port
Energy source
Volume performance, capacity, and appliance performance
Savings of data
Zabbix illustration
Zabbix is used by numerous businesses, including Dell Technologies, to monitor their IT infrastructure. This is an illustration of how to get the PowerStore appliance IOPS through the PowerStore Exporter and see it in Zabbix.
This is but one illustration of Zabbix’s PowerStore appliance metrics. Zabbix can use any of the several dozen performance metrics that PowerStore offers.
For instance, Grafana
Another well-liked programme for making performance dashboards is Grafana. To get you started, the PowerStore Exporter comes with a sample dashboard.
Container Storage Modules: Enterprise applications are increasingly being run on the Kubernetes (K8s) platform. With Dell Technologies Container Storage Modules, PowerStore on K8s is supported by Dell Technologies. The Container Storage Module for Observability is one of these modules; it publishes data to Prometheus as well.
The PowerStore appliance and host storage statistics can be viewed on the same Grafana dashboard for Windows, Linux, and K8s environments in conjunction with the Metrics Exporter for Dell PowerStore.
In conclusion
For comprehensive business monitoring, Dell Technologies offers PowerStore integration for your preferred monitoring tool. You can monitor PowerStore and your other essential infrastructure from a single pane of glass by publishing PowerStore metrics to the well-liked open-source programme Prometheus.
Using PowerStore’s RESTful API, this exporter gathers metrics from several PowerStore systems. Grafana is supported for data visualization, and Prometheus or Zabbix is supported for data collecting. PowerStore REST API versions 1.0, 2.0, and 3.5, Zabbix version 6.0LTS, Prometheus version 2.39.1, and Grafana version 9.3.8 have all been used to test this exporter.
Read more on Govindhtech.com
#MetricsExporter#infrastructure#DellPowerStore#RestApi#prometheus#PowerStore#grafana#news#TechNews#technology#technologynews#technologytrends#govindhtech
0 notes
Text
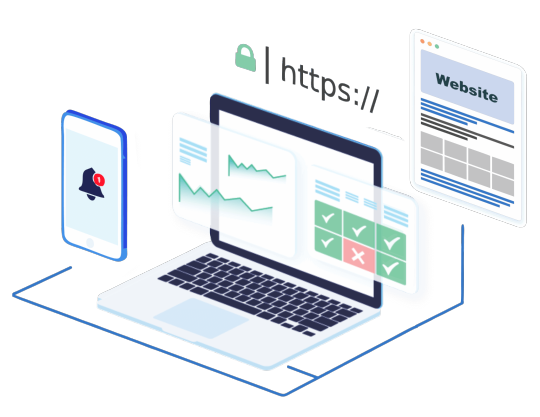
Exploring Modern Monitoring Services: Keeping Your Systems in Check
In today's fast-paced digital landscape, maintaining the health and performance of IT systems is crucial. Modern monitoring services have evolved significantly, offering sophisticated tools to ensure seamless operation and quick troubleshooting. This blog explores the various aspects of contemporary monitoring solutions and how they can benefit your organization.
Why Monitoring Services Are Essential
Monitoring services are vital for:
Proactive Issue Detection: Identify problems before they escalate.
Performance Optimization: Ensure systems are running at optimal levels.
Compliance and Security: Maintain compliance with industry standards and detect security breaches.
User Experience: Guarantee a smooth user experience by minimizing downtime.
Key Features of Modern Monitoring Services
Modern monitoring solutions come with a range of features designed to provide comprehensive oversight:
1. Real-Time Monitoring
Real-time monitoring allows IT teams to observe system performance as it happens. This feature is essential for:
Immediate Issue Detection: Quickly identify and respond to problems.
Resource Utilization Tracking: Monitor CPU, memory, and network usage to avoid resource bottlenecks.
2. Predictive Analytics
Using machine learning algorithms, predictive analytics can forecast potential issues based on historical data. This proactive approach helps in:
Preventative Maintenance: Schedule maintenance before issues occur.
Capacity Planning: Plan for future resource needs to prevent performance degradation.
3. Automated Alerts
Automated alerting systems notify IT staff of issues via email, SMS, or integrated communication platforms like Slack. These alerts can be customized based on severity and type of incident, ensuring timely responses to critical problems.
4. Dashboards and Visualization
Modern monitoring tools offer intuitive dashboards that provide a visual representation of system performance. These dashboards:
Enhance Understanding: Make complex data easily understandable.
Facilitate Quick Decisions: Allow IT teams to make informed decisions rapidly.
5. Integration with Other Tools
Integration capabilities with other IT management tools, such as ticketing systems and configuration management databases (CMDBs), streamline workflows and enhance efficiency.
Popular Modern Monitoring Tools
Here are some of the leading monitoring tools that embody these features:
1. Prometheus
An open-source monitoring solution, Prometheus excels in real-time metrics collection and alerting. It’s particularly popular in the DevOps community for its integration with Kubernetes.
2. Grafana
Grafana pairs well with Prometheus and other data sources, offering rich visualization options. Its customizable dashboards are invaluable for detailed performance analysis.
3. Datadog
Datadog is a cloud monitoring service that provides end-to-end visibility across your stack. It integrates seamlessly with various cloud providers and offers features like APM (Application Performance Monitoring) and log management.
4. Zabbix
Zabbix is another robust open-source solution known for its flexibility in monitoring diverse environments, from cloud services to on-premises hardware.
Best Practices for Effective Monitoring
To maximize the benefits of modern monitoring tools, consider these best practices:
1. Define Clear Objectives
Understand what you need to monitor and why. This clarity helps in setting up meaningful alerts and dashboards.
2. Regularly Review and Update
Continuous improvement is key. Regularly review your monitoring setup to adapt to changes in your IT environment.
3. Train Your Team
Ensure your IT staff is well-versed in using monitoring tools. Proper training can significantly enhance the effectiveness of your monitoring strategy.
4. Leverage Automation
Utilize automation wherever possible to reduce manual effort and minimize human error. Automated responses to certain alerts can also improve reaction times.
Conclusion
Modern monitoring services are indispensable in today's IT landscape. They provide the necessary tools to ensure your systems are always running smoothly, helping to prevent issues before they affect end users. By adopting the right monitoring solutions and following best practices, you can significantly enhance the reliability and performance of your IT infrastructure.
For more details click www.hawkstack.com
#redhatcourses#information technology#linux#container#docker#kubernetes#containerorchestration#containersecurity#dockerswarm#aws#hawkstack#hawkstacktechnologies
0 notes
Text
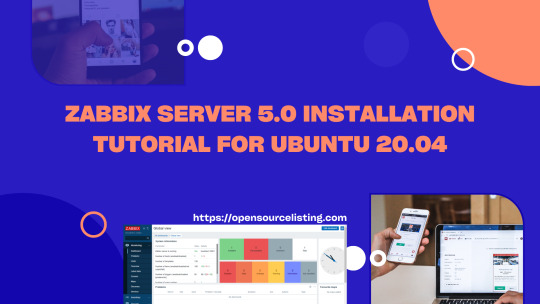
Zabbix Server 5.0 Installation Tutorial for Ubuntu 20.04
Zabbix Server 5.0 Installation Tutorial for Ubuntu 20.04 Zabbix is an open-source monitoring and management solution that provides real-time visibility into the performance and health of IT infrastructure, networks, applications, and services. It enables organizations to monitor various aspects of their systems, including servers, network devices, databases, and more, by collecting and analyzing…
View On WordPress
0 notes
Text
How to install Zabbix Monitoring Tool on a Linux System
How to install Zabbix Monitoring Tool on a Linux System
Zabbix is a high-performance monitoring tool for servers, apps, and network devices that is free and open source. It collects system metrics using agents. It also monitors typical services like SMTP and HTTP, and it enables host monitoring using SNMP, TCP, and ICMP checks. It is intended to monitor thousands of servers, virtual machines, and network devices in real time. It stores data in a…

View On WordPress
#Access Zabbix Dashboard#Database for Zabbix#database information#Linux server#Mariadb#Monitoring tool#MySQL#server monitoring#Zabbix agents
0 notes
Link
0 notes
Text
Welcome to our guide on how to install Zabbix Server 5.0 on CentOS 7 Server. Our previous guide was on the installation of How to Install Zabbix Server on Ubuntu. Zabbix is a powerful open source monitoring solution used to monitor server applications, systems, Network devices, Hardware appliances, IoT devices, e.t.c. Its backend is written in C and Java while the user web interface written in PHP. Zabbix Architecture (Server & Client) Zabbix works in a Client/Server model. The server communicates to the native software agents available for various Operating systems like Linux, NIX, and Windows. For systems without an agent, generic monitoring protocols such as Simple Network Management Protocol (SNMP) or Intelligent Platform Management Interface (IPMI) can be used. Install Zabbix Server 5.0 on CentOS 7 Zabbix Server depends on the following software applications: Apache web server PHP with required extensions MySQL/ MariaDB database server MySQL or MariaDB can be a remote server, but php and httpd need to be installed on the Zabbix server. It is possible to run Apache web server in reverse proxy mode. It is recommended to have SELinux in permissive mode unless you know how to fix its issues: sudo setenforce 0 sudo sed -i 's/^SELINUX=.*/SELINUX=permissive/g' /etc/selinux/config Step 1: Install and Configure Apache httpd server Install Apache web server on CentOS 7 server by running the command: sudo yum -y install httpd vim After installing Apache, configure basic security by allowing Prod ServerTokens only on./etc/httpd/conf/httpd.conf Add the following line at the end of the file: $ sudo vim /etc/httpd/conf/httpd.conf ServerSignature Off ServerTokens Prod The directive ServerTokens configures what is returned as the Server HTTP response. Valid options are Full | OS | Minimal | Minor | Major | Prod. Set ServerName: $ sudo vim /etc/httpd/conf/httpd.conf ServerName zabbix.example.com Set Server Admin to receive an email in case of issues. $ sudo vim /etc/httpd/conf/httpd.conf ServerAdmin [email protected] Restart apache web service after making the changes: sudo systemctl restart httpd If you have a firewalld firewall installed and enabled, allow access to port 443 and 80: sudo firewall-cmd --add-service=http,https --permanent sudo firewall-cmd --reload Step 2: Install MariaDB Database server Install MariaDB database server on CentOS 7 server using our guide: How to Install MariaDB 10.x on CentOS 7 Once Database server is installed, you need to create a database for Zabbix user: export zabbix_db_pass="StrongPassword" mysql -uroot -p Users > Admin > Password > Change Password Configure Monitoring Target host Now that we have our Zabbix server ready for monitoring, you can start configuring first monitoring target host. By default, Zabbix server is added to monitoring. To add other host devices, login to Zabbix admin dashboard with the username admin and click on Configuration > Hosts. After a few minutes, monitoring data will start flowing in, to check host graphs go to Monitoring > Screens > Server name.
0 notes
Photo
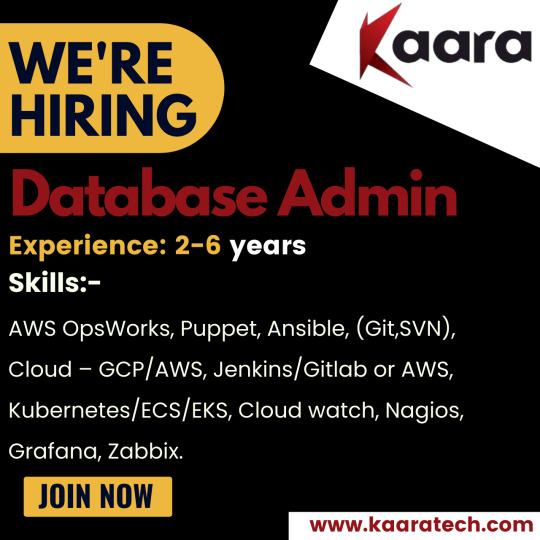
#Kaara looking for "Database Admin" candidates. Mandatory Skills:- AWS OpsWorks, Puppet, Ansible, (Git,SVN), Cloud – GCP/AWS, Jenkins/Gitlab or AWS, Kubernetes/ECS/EKS, Cloud watch, Nagios, Grafana, Zabbix.
Experience: 2-6 years
Location: Noida.
Interested candidates can send your portfolio and updated CV to [email protected].
0 notes
Text
Deep Analysis on Website Monitoring Software Market: Application and Regional Growth Forecast 2028
The global Website Monitoring Software Market report offers a comprehensive assessment of the market for the forecast years. The report contains several segments and an analysis of the market trends and growth factors that are playing a vitalrole in the market. These factors encompass the drivers, restraints, and opportunities. This global industry offers an outlook on the strategic development of the market in terms of revenue profits over the forecast period 2022-2028.
Access FREE Sample Copy of the Website Monitoring Software Market Research Report @ https://www.decisiondatabases.com/contact/download-sample-5271
Global Website Monitoring Software Market Segmentation By Type:
Cloud-based
Web-based
Global Website Monitoring Software Market Segmentation By Applications:
Large Enterprises
SMEs
Global Website Monitoring Software Market Segmentation By Regions:
North America (U.S., Canada, Mexico)
Europe (U.K., France, Germany, Spain, Italy, Central & Eastern Europe, CIS)
Asia Pacific (China, Japan, South Korea, ASEAN, India, Rest of Asia Pacific)
Latin America (Brazil, Rest of L.A.)
The Middle East and Africa (Turkey, GCC, Rest of Middle East)
Global Website Monitoring Software Market Players Profiled in the report (can be customized):
SolarWinds
Zoho
SmartBear
LogicMonitor
New Relic
Freshworks
Datadog
Nagios
Monitis
AlertBot (InfoGenius)
Anturis
Uptrends
ZABBIX
StatusCake
Progress
internetVista
Dotcom-Monitor
Cloudwise
Others
The Global Website Monitoring Software Market Report includes market data for the years 2016 to 2026. The research provides an overview of the market, including key drivers and risk factors. It also assesses the competitive landscape of the major players. The research is expanded to include regional market statistics as well as type and application information. From 2021 through 2026, the research anticipates sales and revenue. The report also goes over the sales route in detail.
Do You Have Any Query Or Report Customization? Ask Our Market Expert @ https://www.decisiondatabases.com/contact/ask-questions-5271
The report covers answers for the below questions –
What is the future scope of Website Monitoring Software market?
What is the anticipated growth of the Website Monitoring Software market in the next six years?
Which region/ country will register the highest growth in the Website Monitoring Software market in the coming years?
What are the Website Monitoring Software market opportunities, its driving forces, and market risks?
Which are the sales/revenue/global market share of key Website Monitoring Software manufacturers since the last two years?
What is the Website Monitoring Software competitive situation in terms of sales, revenue, and global market share of top Website Monitoring Software manufacturers?
What are the Website Monitoring Software Industry sales, revenue, and growth data for North America, Europe, Asia Pacific, Latin America, and Middle-East and Africa?
What are the sales and revenue data by type and application, with sales market share and growth rate by type, application for the year 2015-2020?
What are the sales and revenue forecast data by type and application for the year 2021-2026?
What are the prominent Website Monitoring Software sales channel, distributors, and customers?
Directly Purchase the Complete Global Website Monitoring Software Market Research Report @ https://www.decisiondatabases.com/contact/buy-now-5271
About Us:
DecisionDatabases.com is a global business research report provider, enriching decision-makers, and strategists with qualitative statistics. DecisionDatabases.com is proficient in providing syndicated research reports, customized research reports, company profiles, and industry databases across multiple domains. Our expert research analysts have been trained to map clients’ research requirements to the correct research resource leading to a distinctive edge over its competitors. We provide intellectual, precise, and meaningful data at a lightning speed.
For more details: DecisionDatabases.com E-Mail: [email protected] Phone: +91-93077-28237 Web: https://www.decisiondatabases.com/
#Website Monitoring Software Market#Website Monitoring Software Market Report#Website Monitoring Software Market Research Report#Website Monitoring Software Market Size
0 notes