#FibonacciRetracement
Explore tagged Tumblr posts
Visit Tumblr Blog
Explore Tumblr blogs with no restrictions, modern design and the best experience.
Last Seen Tumblr Blogs


Fun Fact
China blocked Tumblr because of pornography and censorship problems in 2013.
Text
Ethereum Price Analysis: Surge Towards $4000 Imminent
Ethereum's price is breaking above the $3550 resistance level, closely following Bitcoin's lead and potentially targeting the $4000 resistance zone soon. Ethereum Initiates a Fresh Rally Ethereum's price surge persists above the $3500 mark, mirroring Bitcoin's upward momentum. BTC surged and surpassed the $68,000 level. ETH exhibits signs of strength, climbing above $3650. A significant move above $3700 has occurred, marking a new multi-month high at $3715. Currently, the price is consolidating gains, trading above the 23.6% Fibonacci retracement level. Ethereum is currently trading above $3650 and the 100-hour simple moving average. On the hourly ETH/USD chart, a bullish trend line is forming with support near $3600, closely aligning with the 50% Fibonacci retracement level. Resistance Levels and Potential Upside Immediate resistance to the upside lies near $3720, followed by significant levels at $3780 and $3850. A break above $3850 could fuel bullish momentum, possibly targeting $3920 next. If Ethereum moves above the $3920 resistance, it could even rally towards $4000, potentially requiring a test of $4200 for further upside. Downside Correction for Ethereum? Failure to overcome the $3720 resistance might trigger a downside correction. Initial support is near $3650, followed by the $3600 zone and the bullish trend line. A significant support zone lies near $3550, with further losses possibly extending to $3420 and $3350. Technical Indicators - Hourly MACD: The MACD for ETH/USD is gaining momentum in the bullish zone. - Hourly RSI: The RSI for ETH/USD is currently above the 50 level. Key Levels - Primary Support: $3600 - Primary Resistance: $3720 Read the full article
#Bitcoin#BTC#BullishTrendLine#Cryptomarketanalysis#Cryptocurrency#DownsideCorrection#ETH#Ethereum#Fibonacciretracement#MACD#MarketForecast#priceanalysis#resistancelevels#RSI#supportlevels#TechnicalAnalysis#UpsidePotential
0 notes
Link
#bearishcandleformation#exponentialmovingaverage#Fibonacci#Fibonacciretracement#Niftyindex#Niftyoutlook#OpenInterest#supportandresistance#technicalanalysis#technicallevels
0 notes
Text
What Are Fibonacci Retracements and Fibonacci Ratios?
Fibonacci Retracement is a tool of technical analysis used by traders to determine the potential support and resistance levels which drives the price movement in a security. The retracement levels are derived from the Fibonacci ratios through a well renowned Fibonacci series. The Fibonacci ratios provide price levels to which markets tend to retrace a portion of a downtrend or uptrend move. read more

#FibonacciRetracements#FibonacciRatios#TechnicalAnalysis#StockMarketTips#TradingStrategies#MarketAnalysis#ForexTrading#CryptoTrading
0 notes
Text
POST BY CIFDAQ
Today's Teaching Thursday introduces a powerful technical indicator: Fibonacci Retracement. Dive into the article below to understand how it works and how you can apply it to your trading strategy.
Himanshu Maradiya Sheetal Maradiya Rahul Maradiya Jay Hao Krunal Sheth Anil Vasu Ankur Garg Muthuswamy Iyer Shipra Anand Mishra Anuj Barasia
CIFDAQ #CryptoTrading #BlockchainEcosystem #Web3Community #CryptoTradingPlatform #FibonacciRetracement #TradingStrategy
www.cifdaq.com

0 notes
Text
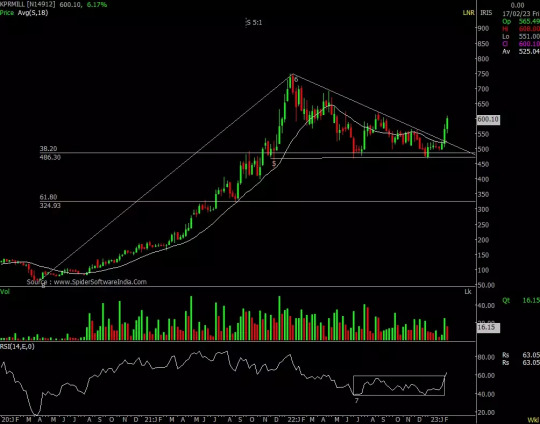
Breakout from descending triangle pattern could take this garment stock towards April 2022 highs
KPR Mill, part of the garment and apparel maker, picked up momentum in the last one month which helped the stock to break out from a descending triangle pattern on the weekly charts. The breakout has opened room for the stock to retest its 52-week highs in the next 2-3 months, suggests experts.
KPR Mill stock hit a 52-week high of Rs 704 on 18 April 2022 but it failed to hold on to the momentum. The stock reversed losses after hitting a low of Rs 479 on 26 December 2022. The stock rose more than 16% in the last one month which helped the stock to breakout from a descending triangle pattern which is a bearish pattern. A breakout suggests that bulls have taken control.
Descending triangle is a continuation of a bearish pattern where the next move will be in the primary trend. The stock has a strong base near the 38.20% Fibonacci retracement level of the previous upward movement from 63 (March 2020) to 769 (January 2022).
In terms of price action, the stock is trading well above short and long-term moving averages such as 5,10,30,50,100, and 200-DMA on daily charts which is a positive sign for the bulls.
“KPR Mill stock has exhibited a bullish trend since March 2020, and despite a recent correction, it has not dropped below the 38.20% Fibonacci retracement level of the previous upward movement from 63 (March 2020) to 769 (January 2022),” Omkar Patil, Technical Research Associate at GEPL Capital, said. “This indicates that the prices have a favorable sentiment, and suggests a potential for further upward movement,” he said. “The stock KPR Mill has demonstrated a significant technical development on its weekly timeframe, as it has successfully broken out of a descending triangle pattern, Indicating continuation of the prior uptrend,” highlighted Patil. On the daily timeframe, the stock KPR Mill has been persistently trading near the upper Bollinger Band, indicating an increase in volatility for a potential upward movement. The RSI on the weekly timeframe has given a breakout too which shows strong bullish momentum. “Based on these technical indicators, it is expected that the stock's prices will continue to rise towards the level of Rs 700, with a recommended stop loss at Rs 550 on a closing basis,” recommends Patil.
#kprmills#tradewithraj#technicalanalysis#dma#fibonacciretracement#brainmasstraders#stocks#nse#nifty#banknifty#sensex#sloploss#bolingerband
0 notes
Photo

Entry Confirmation of Stock Market Trade Guideline 1. Trendline break and retest 2. 0.618% fibonacci retracement 3 Bullish market structure 4. Bullish engulfing candlestick https://t.me/SandhuValueInvesting @SandhuValueInvesting #SandhuValueInvesting #entryconfirmation #trade #stock #market #markettrader #markettraders #markettrading #trendline #trendlinebreak #trendlineretest #fibonacci #fibonacciretracement #bullishpattern #bullishmarket #bullishmarketstructure #bullishengulfing #bullishengulfingcandlestick www.Sandhuvalueinvesting.blogspot.com https://www.instagram.com/p/CXbn64xPgNh/?utm_medium=tumblr
#sandhuvalueinvesting#entryconfirmation#trade#stock#market#markettrader#markettraders#markettrading#trendline#trendlinebreak#trendlineretest#fibonacci#fibonacciretracement#bullishpattern#bullishmarket#bullishmarketstructure#bullishengulfing#bullishengulfingcandlestick
0 notes
Video
youtube
How Do I Apply Fibonacci Retracements to Bitcoin?
0 notes
Text
Fibonacci Trading Masterclass - Fibonacci Retracement

Requirements - No Special Requirements Description Fibonacci Retracement Course Look at my trading account As you can see I am was able to make 63,000 dollars in Profit, by using a Strategy, that uses one of the most famous and accurate tools in Trading and That Tool is Fibonacci Retracement. Why this tool is one of the most famous and accurate tool in trading? How exactly you can benefit from this tool and get the same results as me. How this Everything will be disclosed in this class. Welcome to Fibonacci Trading Masterclass - Fibonacci Retracement Course For People Who Don't know me - My Name is Daksh and I am a Professional Investor and Trader. I trade and invest in Forex Stocks and Cryptos. I have been doing this from the past 9 years and I have helped more than 20,000+ People transform their financial fate. I am also the Founder of ForexMonopoly, Forex Inner Circle, Recession Rich, Cryptos Monopoly and Investors Monopoly This is not just any other Fibonacci course. This Advance Fibonacci Course Consists of Real Knowledge, Real History, Real Testing and Real Practical Results. Here is What You Will Learn in This Class The Real History of Fibonacci - The History that Very few people are aware of. Market Moves - Learn the exact way how does the market moves Mechanism of Fibonacci - Learn the real mechanism of the Fibonacci sequence. When Does Fibonacci Works and When it Doesn't on Charts? Read the full article
0 notes
Photo

Fibonacci Day: How To Use Math To Trade Bitcoin And Altcoins
#bitcoin#btc#btcusd#BTCUSDT#crypto#fibonacci#fibonacciextensions#fibonacciretracement#fibonaccisequence#xbt#xbtusd
0 notes
Photo

Never condemn Your honest efforts towards self evolution and think You are stuck, You are moving closer towards the truth one day at a time - Spirally ! 🧘🏻♂️ 📌An evolving soul will often come back time and again to certain themes or lessons. The experience of having to revisit certain types of things is one that can be quite frustrating for anyone who is committed to their self-awareness process. 📌Because we often subconsciously see our awakening journey as a race to the finish line type of path, we may feel as though we don’t have to re-visit soul lessons that we think we have already pushed past. To come back to something we think we have already been through is seen as a setback in the eyes of our goal-oriented ego. 📌However, an expanded level of consciousness shows us that a linear process is not in fact the case. So why do so many people find themselves attracting the same types of people, places and things over and over? 📌Why is it that we find it in our hearts to forgive ourselves or others, only to find ourselves in a very similar situation months later, inciting the same anger we thought we had already healed? 🧘🏻♂️ ➖ @sparshsinghofficial @liberatedhitesh @connecting_consciousness @foundconscious @project_knowledge @oldworld_noworld_2.0 @bharat_vidya @school_of_vedic_science @indiancontents @fittuber @saliljamdar @ytengra @friendofman @realeyesofficial @stop5gnow @thetrippyindian @friendofman @abhiandniyu @realeyesofficial @fing_rohan @the_baigan_vines @bharat_vidya ➖ #thespiraloflife #fractalconsciousness #higherdimension #fractalenlightenment #sacredgeometry #sacredgeometryinnature #sacredgeometryconsciousness #fibonaccispirals #fibonacciseries #fibonacciretracement #geometrytattoos #universalgeometry #higherawareness #frequencystate #lawofone #lightworkersriseup #thothhermes #higherdimensionalbeings #channelingtheangels #awakenyourthirdeye #selfevolutionrevolution #consciouslearning #thekabbalah #coronahoax2020 #plannedshudown #plannedagenda #reptilianagenda #newslies #plandemic #jain108 (at Sacred Geometry) https://www.instagram.com/p/CBoDvhin88s/?igshid=jp663dykj7y0
#thespiraloflife#fractalconsciousness#higherdimension#fractalenlightenment#sacredgeometry#sacredgeometryinnature#sacredgeometryconsciousness#fibonaccispirals#fibonacciseries#fibonacciretracement#geometrytattoos#universalgeometry#higherawareness#frequencystate#lawofone#lightworkersriseup#thothhermes#higherdimensionalbeings#channelingtheangels#awakenyourthirdeye#selfevolutionrevolution#consciouslearning#thekabbalah#coronahoax2020#plannedshudown#plannedagenda#reptilianagenda#newslies#plandemic#jain108
0 notes
Text
POST BY CIFDAQ
Today's Teaching Thursday introduces a powerful technical indicator: Fibonacci Retracement. Dive into the article below to understand how it works and how you can apply it to your trading strategy.
Himanshu Maradiya Sheetal Maradiya Rahul Maradiya Jay Hao Krunal Sheth Anil Vasu Ankur Garg Muthuswamy Iyer Shipra Anand Mishra Anuj Barasia
CIFDAQ #CryptoTrading #BlockchainEcosystem #Web3Community #CryptoTradingPlatform #FibonacciRetracement #TradingStrategy
www.cifdaq.com

0 notes
Text
📢 பங்குச்சந்தை கணிப்பு: Fibonacci Retracement மூலம் லாபம் பெறுவது எப்படி? 🚀
📢 பங்குச்சந்தை கணிப்பு: Fibonacci Retracement மூலம் லாபம் பெறுவது எப்படி? 🚀
@ParkaviFinance
📊 இந்த வீடியோவில் என்ன தெரிந்து கொள்ளலாம்?
✅ Fibonacci Retracement என்றால் என்ன? எப்படி Use செய்யலாம்?
✅ Nifty Level Marking - Higher High / Higher Low Explained & நாளைய Prediction (தமிழில்)
✅ Bank Nifty Analysis & Swing Pivot Point Level Marking
✅ Not Breakout Review - Kalyan Jewelers Target Hit ஆச்சா இல்லையா?
✅ IndusInd Bank Breakout Analysis & Retracement Strategy
✅ Risk Management - Safe Trading Strategies & CTA Parkavi Finance
📉📈 Technical Analysis traders-க்கு மிகவும் பயனுள்ளதாக இருக்கும்.
Nifty & Bank Nifty மேல்-கீழ் போக்குகளை, Fibonacci Retracement எப்படி Market Levels-ஐ Identify செய்ய உதவுகிறது என்பதை விளக்குகிறோம்!
🔗 Watch Now ➡️ https://youtu.be/DIxe-HIc9uM
📖 மேலும் படிக்க:
📌 English: https://www.parkavifinance.com/2025/03/navigating-market-trends-parkavi.html
📌 தமிழில்: https://tamilparkavifinance.blogspot.com/2025/03/tamil-share-market-is-bullish-whats.html
🔔 Subscribe பண்ணுங்க! Like & Share பண்ணுங்கள்!
📢 நீங்கள் எந்த Level-ல் Trade பண்ணுறீங்க? Comment-ல் Mention பண்ணுங்க!
#TamilBreakoutStocks #FibonacciRetracementTamil #Nifty50Analysis #BankNiftyPrediction #FibonacciRetracement #KalyanJewelers #IndusIndBank #SwingPivotPoints #NiftyTomorrowPrediction #BankNiftyLevels #RiskManagement #TradingStrategiesTamil #ParkaviFinance #StockMarketPredictionTamil #NiftyPredictionTamil #BankNiftyMonday #BreakoutStockReviewTamil #BreakoutTradingStrategyTamil #BestStocksToBuyNow #TechnicalAnalysisTamil
#share market#financial freedom#youtube#trading strategies#breakout stocks#financial updates#investing stocks#ipo analysis#stock market#ipo allotment
0 notes
Photo

⭐️Technical Analysis using Fibonacci Trading Tools • • Only at TradingLearning101 YouTube Channel • • #fibonacci #fibonacciretracement #daytrade #daytrader #trader #stockmarket #finance #invest #stocks https://www.instagram.com/p/B_da-b4gSgT/?igshid=1o9xq06g3m3f9
0 notes
Text
Bitcoin at ‘Critical Point’ as Price Suddenly Surges towards $10,000

Bitcoin has surged unexpectedly, rising to $10,000 and returning its pre-coronavirus outbreak bull run to the bitcoin market. The bitcoin price, which has risen by more than 30% since the end of March, has nearly reversed its losses in the coronavirus crash – and outperforms the U.S. The S&P 500 index and most other important stocks. It soared higher on Wednesday morning, prodding $9,000 per bitcoin before reverting on the Luxembourg-based Bitstamp bitcoin and cryptocurrency exchange to trade about $8,800. "Bitcoin is now trading at a critical inflexion point, where significant Fibonacci retracements, 50-day moving averages and 10-day moving averages converge on the daily chart," experts at the Singapore-based Bitcoin index fund Stack wrote in a report, adding that resistance to upkeep could see "further price action upside towards $9,300" but cautioned potential investors over "short-term headwinds." U.S. stocks ended higher on Wednesday, adding to earlier gains as investor excitement about possible coronavirus treatment increased, some lockdowns eased, and chairman of the Federal Reserve Jerome Powell said he was willing to move deeper to prop up the lockdown-ravaged economy. "It may well be the case that the economy needs more support," Powell said after the Fed's two-day plenary session, speaking at an event. The dovish approach of the Fed has massively boosted the price of bitcoin and most other assets, while crypto market observers have pointed to the powerful underlying feeling of bitcoin for its outsized success. "The majority of investors in the market are bullish, with many having a long-term investment horizon unfazed by recent volatility. This overall sentiment could act as support for the bitcoin price over the next few weeks, though we aren't entirely out of the woods yet," said Rich Rosenblum, co-head of trading at algorithmic digital asset trader GSR, pointing to a "clearer path" back to economics and "the impact of the economic stimulus" as driving "positive macro sentiment." The bitcoin price has surpassed most other assets lately, with year-to-date returns of Bitcoin outperforming gold, up around 25 percent, and 12 percent, respectively, since the start of the year. Also, it has overshadowed recent gains achieved by the S&P 500, which has so far fallen by about 10 per cent by 2020. Do not forget leaving your valuable comment on this piece of writing and sharing with your near and dear ones. To keep yourself up-to-date with Information Palace, put your email in the space given below and Subscribe. Furthermore, if you yearn to know about the soaring of Tesla Stock, view our construct, ‘Why Tesla Stock Is Soaring with an Amazing Pace’. Read the full article
#Bitcoin#Bitcoinindex#Bitstamp#CriticalPoint#cryptocurrency#cryptocurrencyexchange#Economy#Fed#Fibonacci#Fibonacciretracements#outbreak#Powell#RichRosenblum#S&P
0 notes
Text
Fibonacci Retracement (Fibonacci Thoái Lui) Là Gì? Hướng Dẫn Vào Lệnh Chính Xác Tuyệt Đối
Fibonacci Retracement (Fibonacci thoái lui) là gì? Đây là một công cụ phổ biến với các trader trong giao dịch tài chính như chứng khoán, forex,….

Link bài viết: https://brokervn.net/fibonacci-retracement/
#trade #forex #brokervn #fibonacciretracement
0 notes
Text
POST BY CIFDAQ
Today's Teaching Thursday introduces a powerful technical indicator: Fibonacci Retracement. Dive into the article below to understand how it works and how you can apply it to your trading strategy.
Himanshu Maradiya Sheetal Maradiya Rahul Maradiya Jay Hao Krunal Sheth Anil Vasu Ankur Garg Muthuswamy Iyer Shipra Anand Mishra Anuj Barasia
CIFDAQ #CryptoTrading #BlockchainEcosystem #Web3Community #CryptoTradingPlatform #FibonacciRetracement #TradingStrategy
www.cifdaq.com

0 notes