#Handle extracted text based on columns
Explore tagged Tumblr posts
Visit Tumblr Blog
Explore Tumblr blogs with no restrictions, modern design and the best experience.
Last Seen Tumblr Blogs


Fun Fact
The average Tumblr user visits about 67 pages every month.
Text
Top 5 Alternative Data Career Paths and How to Learn Them

The world of data is no longer confined to neat rows and columns in traditional databases. We're living in an era where insights are being unearthed from unconventional, often real-time, sources – everything from satellite imagery tracking retail traffic to social media sentiment predicting stock movements. This is the realm of alternative data, and it's rapidly creating some of the most exciting and in-demand career paths in the data landscape.
Alternative data refers to non-traditional information sources that provide unique, often forward-looking, perspectives that conventional financial reports, market research, or internal operational data simply cannot. Think of it as peering through a new lens to understand market dynamics, consumer behavior, or global trends with unprecedented clarity.
Why is Alternative Data So Critical Now?
Real-time Insights: Track trends as they happen, not just after quarterly reports or surveys.
Predictive Power: Uncover leading indicators that can forecast market shifts, consumer preferences, or supply chain disruptions.
Competitive Edge: Gain unique perspectives that your competitors might miss, leading to smarter strategic decisions.
Deeper Context: Analyze factors previously invisible, from manufacturing output detected by sensors to customer foot traffic derived from geolocation data.
This rich, often unstructured, data demands specialized skills and a keen understanding of its nuances. If you're looking to carve out a niche in the dynamic world of data, here are five compelling alternative data career paths and how you can equip yourself for them.
1. Alternative Data Scientist / Quant Researcher
This is often the dream role for data enthusiasts, sitting at the cutting edge of identifying, acquiring, cleaning, and analyzing alternative datasets to generate actionable insights, particularly prevalent in finance (for investment strategies) or detailed market intelligence.
What they do: They actively explore new, unconventional data sources, rigorously validate their reliability and predictive power, develop sophisticated statistical models and machine learning algorithms (especially for unstructured data like text or images) to extract hidden signals, and present their compelling findings to stakeholders. In quantitative finance, this involves building systematic trading strategies based on these unique data signals.
Why it's growing: The competitive advantage gleaned from unique insights derived from alternative data is immense, particularly in high-stakes sectors like finance where even marginal improvements in prediction can yield substantial returns.
Key Skills:
Strong Statistical & Econometric Modeling: Expertise in time series analysis, causality inference, regression, hypothesis testing, and advanced statistical methods.
Machine Learning: Profound understanding and application of supervised, unsupervised, and deep learning techniques, especially for handling unstructured data (e.g., Natural Language Processing for text, Computer Vision for images).
Programming Prowess: Master Python (with libraries like Pandas, NumPy, Scikit-learn, PyTorch/TensorFlow) and potentially R.
Data Engineering Fundamentals: A solid grasp of data pipelines, ETL (Extract, Transform, Load) processes, and managing large, often messy, datasets.
Domain Knowledge: Critical for contextualizing and interpreting the data, understanding potential biases, and identifying genuinely valuable signals (e.g., financial markets, retail operations, logistics).
Critical Thinking & Creativity: The ability to spot unconventional data opportunities and formulate innovative hypotheses.
How to Learn:
Online Specializations: Look for courses on "Alternative Data for Investing," "Quantitative Finance with Python," or advanced Machine Learning/NLP. Platforms like Coursera, edX, and DataCamp offer relevant programs, often from top universities or financial institutions.
Hands-on Projects: Actively work with publicly available alternative datasets (e.g., from Kaggle, satellite imagery providers like NASA, open-source web scraped data) to build and validate predictive models.
Academic Immersion: Follow leading research papers and attend relevant conferences in quantitative finance and data science.
Networking: Connect actively with professionals in quantitative finance or specialized data science roles that focus on alternative data.
2. Alternative Data Engineer
While the Alternative Data Scientist unearths the insights, the Alternative Data Engineer is the architect and builder of the robust infrastructure essential for managing these unique and often challenging datasets.
What they do: They meticulously design and implement scalable data pipelines to ingest both streaming and batch alternative data, orchestrate complex data cleaning and transformation processes at scale, manage cloud infrastructure, and ensure high data quality, accessibility, and reliability for analysts and scientists.
Why it's growing: Alternative data is inherently diverse, high-volume, and often unstructured or semi-structured. Without specialized engineering expertise and infrastructure, its potential value remains locked away.
Key Skills:
Cloud Platform Expertise: Deep knowledge of major cloud providers like AWS, Azure, or GCP, specifically for scalable data storage (e.g., S3, ADLS, GCS), compute (e.g., EC2, Azure VMs, GCE), and modern data warehousing (e.g., Snowflake, BigQuery, Redshift).
Big Data Technologies: Proficiency in distributed processing frameworks like Apache Spark, streaming platforms like Apache Kafka, and data lake solutions.
Programming: Strong skills in Python (for scripting, API integration, and pipeline orchestration), and potentially Java or Scala for large-scale data processing.
Database Management: Experience with both relational (e.g., PostgreSQL, MySQL) and NoSQL databases (e.g., MongoDB, Cassandra) for flexible data storage needs.
ETL Tools & Orchestration: Mastery of tools like dbt, Airflow, Prefect, or Azure Data Factory for building, managing, and monitoring complex data workflows.
API Integration & Web Scraping: Practical experience in fetching data from various web sources, public APIs, and sophisticated web scraping techniques.
How to Learn:
Cloud Certifications: Pursue certifications like AWS Certified Data Analytics, Google Cloud Professional Data Engineer, or Azure Data Engineer Associate.
Online Courses: Focus on "Big Data Engineering," "Data Pipeline Development," and specific cloud services tailored for data workloads.
Practical Experience: Build ambitious personal projects involving data ingestion from diverse APIs (e.g., social media APIs, financial market APIs), advanced web scraping, and processing with big data frameworks.
Open-Source Engagement: Contribute to or actively engage with open-source projects related to data engineering tools and technologies.
3. Data Product Manager (Alternative Data Focus)
This strategic role acts as the crucial bridge between intricate business challenges, the unique capabilities of alternative data, and the technical execution required to deliver impactful data products.
What they do: They meticulously identify market opportunities for new alternative data products or enhancements, define a clear product strategy, meticulously gather and prioritize requirements from various stakeholders, manage the end-to-end product roadmap, and collaborate closely with data scientists, data engineers, and sales teams to ensure the successful development, launch, and adoption of innovative data-driven solutions. They possess a keen understanding of both the data's raw potential and the specific business problem it is designed to solve.
Why it's growing: As alternative data moves from niche to mainstream, companies desperately need strategists who can translate its complex technical potential into tangible, commercially viable products and actionable business insights.
Key Skills:
Product Management Fundamentals: Strong grasp of agile methodologies, product roadmap planning, user story creation, and sophisticated stakeholder management.
Business Acumen: A deep, nuanced understanding of the specific industry where the alternative data is being applied (e.g., quantitative finance, retail strategy, real estate analytics).
Data Literacy: The ability to understand the technical capabilities, inherent limitations, potential biases, and ethical considerations associated with diverse alternative datasets.
Exceptional Communication: Outstanding skills in articulating product vision, requirements, and value propositions to both highly technical teams and non-technical business leaders.
Market Research: Proficiency in identifying unmet market needs, analyzing competitive landscapes, and defining unique value propositions for data products.
Basic SQL/Data Analysis: Sufficient technical understanding to engage meaningfully with data teams and comprehend data capabilities and constraints.
How to Learn:
Product Management Courses: General PM courses provide an excellent foundation (e.g., from Product School, or online specializations on platforms like Coursera/edX).
Develop Deep Domain Expertise: Immerse yourself in industry news, read analyst reports, attend conferences, and thoroughly understand the core problems of your target industry.
Foundational Data Analytics/Science: Take introductory courses in Python/R, SQL, and data visualization to understand the technical underpinnings.
Networking: Actively engage with existing data product managers and leading alternative data providers.
4. Data Ethicist / AI Policy Analyst (Alternative Data Specialization)
The innovative application of alternative data, particularly when combined with AI, frequently raises significant ethical, privacy, and regulatory concerns. This crucial role ensures that data acquisition and usage are not only compliant but also responsible and fair.
What they do: They meticulously develop and implement robust ethical guidelines for the collection, processing, and use of alternative data. They assess potential biases inherent in alternative datasets and their potential for unfair outcomes, ensure strict compliance with evolving data privacy regulations (like GDPR, CCPA, and similar data protection acts), conduct comprehensive data protection and impact assessments, and advise senior leadership on broader AI policy implications related to data governance.
Why it's growing: With escalating public scrutiny, rapidly evolving global regulations, and high-profile incidents of data misuse, ethical and compliant data practices are no longer merely optional; they are absolutely critical for maintaining an organization's reputation, avoiding severe legal penalties, and fostering public trust.
Key Skills:
Legal & Regulatory Knowledge: A strong understanding of global and regional data privacy laws (e.g., GDPR, CCPA, etc.), emerging AI ethics frameworks, and industry-specific regulations that govern data use.
Risk Assessment & Mitigation: Expertise in identifying, analyzing, and developing strategies to mitigate ethical, privacy, and algorithmic bias risks associated with complex data sources.
Critical Thinking & Bias Detection: The ability to critically analyze datasets and algorithmic outcomes for inherent biases, fairness issues, and potential for discriminatory impacts.
Communication & Policy Writing: Exceptional skills in translating complex ethical and legal concepts into clear, actionable policies, guidelines, and advisory reports for diverse audiences.
Stakeholder Engagement: Proficiency in collaborating effectively with legal teams, compliance officers, data scientists, engineers, and business leaders.
Basic Data Literacy: Sufficient understanding of how data is collected, stored, processed, and used by AI systems to engage meaningfully with technical teams.
How to Learn:
Specialized Courses & Programs: Look for postgraduate programs or dedicated courses in Data Ethics, AI Governance, Technology Law, or Digital Policy, often offered by law schools, public policy institutes, or specialized AI ethics organizations.
Industry & Academic Research: Stay current by reading reports and white papers from leading organizations (e.g., World Economic Forum), academic research institutions, and major tech companies' internal ethics guidelines.
Legal Background (Optional but Highly Recommended): A formal background in law or public policy can provide a significant advantage.
Engage in Professional Forums: Actively participate in discussions and communities focused on data ethics, AI policy, and responsible AI.
5. Data Journalist / Research Analyst (Alternative Data Focused)
This captivating role harnesses the power of alternative data to uncover compelling narratives, verify claims, and provide unique, data-driven insights for public consumption or critical internal strategic decision-making in sectors like media, consulting, or advocacy.
What they do: They meticulously scour publicly available alternative datasets (e.g., analyzing satellite imagery for environmental impact assessments, tracking social media trends for shifts in public opinion, dissecting open government data for policy analysis, or using web-scraped data for market intelligence). They then expertly clean, analyze, and, most importantly, effectively visualize and communicate their findings through engaging stories, in-depth reports, and interactive dashboards.
Why it's growing: The ability to tell powerful, evidence-based stories from unconventional data sources is invaluable for modern journalism, influential think tanks, specialized consulting firms, and even for robust internal corporate communications.
Key Skills:
Data Cleaning & Wrangling: Expertise in preparing messy, real-world data for analysis, typically using tools like Python (with Pandas), R (with Tidyverse), or advanced Excel functions.
Data Visualization: Proficiency with powerful visualization tools such as Tableau Public, Datawrapper, Flourish, or programming libraries like Matplotlib, Seaborn, and Plotly for creating clear, impactful, and engaging visual narratives.
Storytelling & Communication: Exceptional ability to translate complex data insights into clear, concise, and compelling narratives that resonate with both expert and general audiences.
Research & Investigative Skills: A deep sense of curiosity, persistence in finding and validating diverse data sources, and the analytical acumen to uncover hidden patterns and connections.
Domain Knowledge: A strong understanding of the subject matter being investigated (e.g., politics, environmental science, consumer trends, public health).
Basic Statistics: Sufficient statistical knowledge to understand trends, interpret correlations, and draw sound, defensible conclusions from data.
How to Learn:
Data Journalism Programs: Some universities offer specialized master's or certificate programs in data journalism.
Online Courses: Focus on courses in data visualization, storytelling with data, and introductory data analysis on platforms like Coursera, Udemy, or specific tool tutorials.
Practical Experience: Actively engage with open data portals (e.g., data.gov, WHO, World Bank), and practice analyzing, visualizing, and writing about these datasets.
Build a Portfolio: Create a strong portfolio of compelling data stories and visualizations based on alternative data projects, demonstrating your ability to communicate insights effectively.
The landscape of data is evolving at an unprecedented pace, and alternative data is at the heart of this transformation. These career paths offer incredibly exciting opportunities for those willing to learn the specialized skills required to navigate and extract profound value from this rich, unconventional frontier. Whether your passion lies in deep technical analysis, strategic product development, ethical governance, or impactful storytelling, alternative data provides a fertile ground for a rewarding and future-proof career.
0 notes
Text
Convert PDF to Excel: A Smarter Way to Handle Data
Managing data trapped inside PDF documents can be frustrating, especially when you need to analyze or edit it in Excel. Whether you’re working with invoices, statements, tables, or reports, the ability to convert PDF to Excel helps turn static files into dynamic spreadsheets you can work with freely.
In this article, we’ll explore why this conversion matters, how to do it, and best practices to ensure accuracy.
Why Convert PDF to Excel?
PDFs are great for preserving layout and design—but they aren’t made for editing. Excel, on the other hand, is designed for data handling. Converting PDF to Excel brings several key advantages:
Editability: Easily update or restructure data
Data Analysis: Use formulas, charts, and filters to gain insights
Speed: Avoid retyping information manually
Accuracy: Minimize errors when transferring tabular data
Automation: Integrate with workflows that rely on Excel format
Common Use Cases
Professionals across industries regularly need to convert PDF files to Excel. Some common situations include:
Finance teams extracting transaction tables or reports
Accountants working with invoices and balance sheets
Logistics departments processing shipment and delivery data
Sales teams tracking leads and performance metrics
Administrators managing structured lists like employee data or attendance
Methods to Convert PDF to Excel
There are several ways to approach this conversion, depending on the document type and tools available:
1. Copy and Paste (Manual Method)
Useful for small, simple tables. However, formatting often breaks, and it can be time-consuming.
2. PDF Software with Export Features
Some professional PDF tools allow you to export directly to Excel. This can retain more formatting and save time.
3. OCR (Optical Character Recognition)
For scanned or image-based PDFs, OCR technology detects text and tables, turning them into editable content. Make sure your tool supports OCR if you’re working with scanned files.
4. Batch Conversion Tools
Businesses dealing with large volumes of data benefit from tools that support batch conversions, saving hours of repetitive work.
Best Practices for Clean Conversions
To get the best results when converting PDF to Excel, keep these tips in mind:
Use high-quality PDF files: Clean, structured layouts convert more accurately
Check formatting: Review column alignment, merged cells, and number formats after conversion
Split complex tables: Break large tables into smaller sections if necessary
Clean unnecessary data: Remove headers, footers, and non-tabular elements before or after conversion
Final Thoughts
Learning how to convert PDF to Excel effectively can streamline your workflow, save time, and reduce manual errors. Whether you’re handling a few files or processing large volumes of data, the right method and tools make all the difference.
By turning static PDFs into editable spreadsheets, you gain the freedom to manipulate, analyze, and use your data in ways that drive better decisions and results.
1 note
·
View note
Text
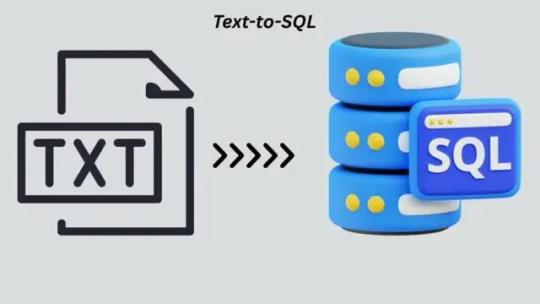
Text to SQL LLM: What is Text to SQL And Text to SQL Methods
SQL LLM text
How text-to-SQL approaches help AI write good SQL
SQL is vital for organisations to acquire quick and accurate data-driven insights for decision-making. Google uses Gemini to generate text-to-SQL from natural language. This feature lets non-technical individuals immediately access data and boosts developer and analyst productivity.
How is Text to SQL?
A feature dubbed “text-to-SQL” lets systems generate SQL queries from plain language. Its main purpose is to remove SQL code by allowing common language data access. This method maximises developer and analyst efficiency while letting non-technical people directly interact with data.
Technology underpins
Recent Text-to-SQL improvements have relied on robust large language models (LLMs) like Gemini for reasoning and information synthesis. The Gemini family of models produces high-quality SQL and code for Text-to-SQL solutions. Based on the need, several model versions or custom fine-tuning may be utilised to ensure good SQL production, especially for certain dialects.
Google Cloud availability
Current Google Cloud products support text-to-SQL:
BigQuery Studio: available via Data Canvas SQL node, SQL Editor, and SQL Generation.
Cloud SQL Studio has “Help me code” for Postgres, MySQL, and SQLServer.
AlloyDB Studio and Cloud Spanner Studio have “Help me code” tools.
AlloyDB AI: This public trial tool connects to the database using natural language.
Vertex AI provides direct access to Gemini models that support product features.
Text-to-SQL Challenges
Text-to-SQL struggles with real-world databases and user queries, even though the most advanced LLMs, like Gemini 2.5, can reason and convert complex natural language queries into functional SQL (such as joins, filters, and aggregations). The model needs different methods to handle critical problems. These challenges include:
Provide Business-Specific Context:
Like human analysts, LLMs need a lot of “context” or experience to write appropriate SQL. Business case implications, semantic meaning, schema information, relevant columns, data samples—this context may be implicit or explicit. Specialist model training (fine-tuning) for every database form and alteration is rarely scalable or cost-effective. Training data rarely includes semantics and business knowledge, which is often poorly documented. An LLM won't know how a cat_id value in a table indicates a shoe without context.
User Intent Recognition
Natural language is less accurate than SQL. An LLM may offer an answer when the question is vague, causing hallucinations, but a human analyst can ask clarifying questions. The question “What are the best-selling shoes?” could mean the shoes are most popular by quantity or revenue, and it's unclear how many responses are needed. Non-technical users need accurate, correct responses, whereas technical users may benefit from an acceptable, nearly-perfect query. The system should guide the user, explain its decisions, and ask clarifying questions.
LLM Generation Limits:
Unconventional LLMs are good at writing and summarising, but they may struggle to follow instructions, especially for buried SQL features. SQL accuracy requires careful attention to specifications, which can be difficult. The many SQL dialect changes are difficult to manage. MySQL uses MONTH(timestamp_column), while BigQuery SQL uses EXTRACT(MONTH FROM timestamp_column).
Text-to-SQL Tips for Overcoming Challenges
Google Cloud is constantly upgrading its Text-to-SQL agents using various methods to improve quality and address the concerns identified. These methods include:
Contextual learning and intelligent retrieval: Provide data, business concepts, and schema. After indexing and retrieving relevant datasets, tables, and columns using vector search for semantic matching, user-provided schema annotations, SQL examples, business rule implementations, and current query samples are loaded. This data is delivered to the model as prompts using Gemini's long context windows.
Disambiguation LLMs: To determine user intent by asking the system clarifying questions. This usually involves planning LLM calls to see if a question can be addressed with the information available and, if not, to create follow-up questions to clarify purpose.
SQL-aware Foundation Models: Using powerful LLMs like the Gemini family with targeted fine-tuning to ensure great and dialect-specific SQL generation.
Verification and replenishment: LLM creation non-determinism. Non-AI methods like query parsing or dry runs of produced SQL are used to get a predicted indication if something crucial was missed. When provided examples and direction, models can typically remedy mistakes, thus this feedback is sent back for another effort.
Self-Reliability: Reducing generation round dependence and boosting reliability. After creating numerous queries for the same question (using different models or approaches), the best is chosen. Multiple models agreeing increases accuracy.
The semantic layer connects customers' daily language to complex data structures.
Query history and usage pattern analysis help understand user intent.
Entity resolution can determine user intent.
Model finetuning: Sometimes used to ensure models supply enough SQL for dialects.
Assess and quantify
Enhancing AI-driven capabilities requires robust evaluation. Although BIRD-bench and other academic benchmarks are useful, they may not adequately reflect workload and organisation. Google Cloud has developed synthetic benchmarks for a variety of SQL engines, products, dialects, and engine-specific features like DDL, DML, administrative requirements, and sophisticated queries/schemas. Evaluation uses offline and user metrics and automated and human methods like LLM-as-a-judge to deliver cost-effective performance understanding on ambiguous tasks. Continuous reviews allow teams to quickly test new models, prompting tactics, and other improvements.
#SQLLLM#TexttoSQLLLM#TexttoSQL#VertexAI#TexttoSQLMethods#ChallengesofTexttoSQL#technology#technews#news#technologynews#technologytrends#govindhtech
0 notes
Text
Data Lake Services
Understanding Data Lake Services: A Comprehensive Guide
In today’s data-driven world, businesses are increasingly relying on vast amounts of data to make informed decisions. As data becomes more complex, diverse, and voluminous, traditional data storage and management solutions can struggle to keep up. This is where data lakes come into play. Data lake services provide a scalable, flexible, and cost-efficient approach to storing and processing large volumes of structured, semi-structured, and unstructured data.
In this blog, we’ll take a deep dive into the concept of data lakes, explore their benefits, and look at some of the leading data lake services available today.
What is a Data Lake?
At its core, a data lake is a centralized repository that allows businesses to store all their data, both raw and processed, at scale. Unlike traditional data warehouses that store structured data (think tables and columns), a data lake can accommodate all kinds of data formats – whether it's text, images, video, audio, or sensor data. The key advantage of a data lake is its ability to ingest data from a variety of sources and store it without the need to preprocess or transform it.
In simpler terms, think of a data lake as an expansive, deep reservoir where companies can dump all types of data, and the lake's contents can later be queried, analyzed, and processed as needed.
Key Features of Data Lakes
Scalability: Data lakes are designed to scale horizontally, meaning they can handle massive amounts of data and grow with the organization’s needs.
Flexibility: They support all types of data – structured, semi-structured (like JSON, XML), and unstructured (such as images, audio, and videos).
Cost-Efficiency: Because of their ability to store raw data, data lakes can be much more affordable compared to traditional storage solutions like data warehouses.
Real-Time Analytics: Data lakes enable the integration of real-time data streams, making them ideal for applications requiring up-to-the-minute insights.
Advanced Analytics & Machine Learning: With all your data stored in one place, data lakes facilitate sophisticated analysis using tools for machine learning, artificial intelligence, and data mining.
Benefits of Data Lake Services
Consolidated Data Storage: A data lake enables organizations to consolidate data from disparate systems and sources, offering a single view of all the organization’s information. This makes it easier for teams to access, analyze, and extract meaningful insights without sifting through various databases.
Faster Decision-Making: Storing all the data in its raw form gives organizations the flexibility to apply various analytics techniques without being restricted by predefined data models. Data scientists can perform advanced analytics and uncover patterns, enabling faster and more accurate decision-making.
Improved Data Access: Since data lakes are often built on open-source frameworks, users can leverage a wide range of programming languages, such as Python, R, and SQL, to interact with the data. This empowers users from different departments to extract insights that are crucial for their specific functions.
Future-Proofing: As data grows in complexity and volume, data lakes provide the scalability needed to accommodate this growth. Whether it's an influx of new data sources or the increasing need for sophisticated analytics, data lakes ensure businesses can adapt to future challenges.
Cost-Effective Storage: Data lakes typically use cloud storage solutions, which can be a fraction of the cost of traditional data warehousing services. This makes data lakes a viable option for startups and enterprises alike.
Leading Data Lake Services
There are several cloud-based data lake services offered by leading providers. These services come with various features and integrations that help organizations seamlessly store, manage, and analyze their data.
1. Amazon S3 (Simple Storage Service)
Amazon Web Services (AWS) is one of the pioneers in the cloud computing space, and its Amazon S3 is a widely used service for building data lakes. AWS allows businesses to store any amount of data in any format. With services like AWS Glue for data transformation and Amazon Athena for querying data directly from S3, Amazon S3 is a go-to service for companies looking to build a scalable and flexible data lake.
Key Features:
Extremely scalable storage
Built-in security with encryption and access controls
Easy integration with AWS analytics tools
Data lifecycle management
2. Azure Data Lake Storage (ADLS)
Microsoft Azure offers its Azure Data Lake Storage as part of its broader cloud data ecosystem. ADLS is built specifically for analytics workloads and integrates seamlessly with Azure analytics tools like Azure Synapse Analytics and Azure Databricks.
Key Features:
Hierarchical namespace for better organization
Security features like role-based access control (RBAC)
Optimized for large-scale analytics
Integration with machine learning and artificial intelligence services
3. Google Cloud Storage (GCS)
Google Cloud’s Google Cloud Storage offers a simple and reliable object storage service that can serve as the foundation for building data lakes. The platform’s native integration with tools like BigQuery for data analytics and Google Dataproc for processing large-scale datasets makes it a strong contender for organizations looking to leverage big data.
Key Features:
High availability and durability
Strong security features, including encryption
Integration with BigQuery for data analytics
Scalable infrastructure with seamless expansion
4. IBM Cloud Object Storage
IBM’s Cloud Object Storage is another enterprise-grade solution for building data lakes. IBM focuses on providing flexible storage options that can handle unstructured data while providing high scalability and security. The service integrates with various AI and machine learning tools, allowing businesses to leverage their data for advanced analytics.
Key Features:
Built-in artificial intelligence and machine learning capabilities
Robust data security and compliance features
Flexible storage with multiple tiers to manage costs
Support for diverse data formats
Best Practices for Using Data Lakes
Data Governance: Even though data lakes allow you to store raw data, it’s essential to establish data governance policies. This includes setting up clear processes for data validation, ensuring quality control, and defining data access protocols to prevent data silos and misuse.
Data Organization: While a data lake is flexible, maintaining some level of structure is necessary. Using metadata, tagging, and categorization will make it easier to search and retrieve the relevant data when needed.
Data Security: Security is paramount in any data storage solution. Use encryption, access control policies, and authentication mechanisms to ensure that only authorized personnel can access sensitive data.
Integration with Analytics Tools: A data lake is only as valuable as the tools used to analyze the data within it. Integrating your data lake with advanced analytics tools such as Apache Spark, Hadoop, or machine learning platforms is key to unlocking its full potential.
Conclusion
Data lakes offer organizations a flexible, scalable, and cost-effective solution to store vast amounts of diverse data. As businesses embrace the power of big data, data lakes enable them to harness that power for deeper insights, faster decision-making, and greater innovation. With leading cloud providers offering robust data lake services, businesses can easily build a data lake tailored to their needs. By following best practices, companies can ensure they get the most value from their data lake and stay ahead in today’s data-driven world.
0 notes
Text
What are HarmonyOS NEXT-StyleDecorator:@Styles and @Extend?
HarmonyOS NEXT - Style Decorator: If the style of each component needs to be set separately, there will be a large amount of code repeating style settings during the development process. Although it can be copied and pasted, for the sake of code simplicity and easy maintenance in the future, @ Styles, a decorator that can extract common styles for reuse, has been introduced.
@Styles decorator can extract multiple style settings into one method, which can be called directly at the location of the component declaration. @Styles decorator allows for quick definition and reuse of custom styles.
@Styles Decorator: Define Component Reuse Styles @Styles decorator can extract multiple style settings into one method, which can be called directly at the location of the component declaration. @Styles decorator allows for quick definition and reuse of custom styles.
Disadvantages of @Styles Decorators: @Styles only supports universal properties and universal events. @Styles method does not support parameters
@Styles Decorator Restrictions: @Styles method cannot have parameters, and an error will be reported during compilation, reminding developers that the @ Styles method does not support parameters. @Styles method does not support the use of logical components, and properties within logical components do not take effect.
@Extend is used to extend native component styles [code] @Extend(UIComponentName) function functionName { … } [/code] @Extend only supports global definition and does not support definition within components The method of @Extend decoration supports parameters
@Extend Usage Rules ·@Extend supports encapsulating private properties, private events, and globally defined methods of specified components. ·The @Extend decoration method supports parameters, and developers can pass parameters when calling, following the TS method for value passing calls. ·The parameter of the @Extend decoration method can be a function, which serves as a handle for the Event event. ·The parameter of @Extend can be a state variable, and when the state variable changes, the UI can be refreshed and rendered normally.
@Extend Restrictions @Extend only supports global definition and does not support definition within components.
Code Examples [code] @Entry @Component struct StylesPage { @State message: string = '@Styles And @Extend';
@Styles reuseStyle(){ .backgroundColor(Color.Orange) .width(200) .margin(10) // .fontSize(20) }
build() { Column() { Text(this.message) .fontSize(20) .fontWeight(FontWeight.Bold) Text('1').reuseStyle() Text('2').reuseStyle() Text('3').reuseStyle() Text('a').textStyle(100) Text('b').textStyle(150) Text('c').textStyle(200) } .height('100%') .width('100%')
} }
@Extend(Text) function textStyle(w:number){ .width(w) .backgroundColor(Color.Green) .margin(10) .fontSize(20) } [/code]
Combining @Styles and stateStyles @Styles is only used for style reuse on static pages, stateStyles can quickly set different styles based on the internal state of components. Code Examples [code] @Entry @Component struct MyComponent { @Styles normalStyle() { .backgroundColor(Color.Gray) }
@Styles pressedStyle() { .backgroundColor(Color.Red) }
build() { Column() { Text('Text1') .fontSize(50) .fontColor(Color.White) .stateStyles({ normal: this.normalStyle, pressed: this.pressedStyle, }) } } } [/code]
StateStyles can bind regular and state variables within a component through this [code] @Entry @Component struct CompWithInlineStateStyles { @State focusedColor: Color = Color.Red; normalColor: Color = Color.Green
build() { Column() { Button('clickMe').height(100).width(100) .stateStyles({ normal: { .backgroundColor(this.normalColor) }, focused: { .backgroundColor(this.focusedColor) } }) .onClick(() => { this.focusedColor = Color.Pink }) .margin('30%') } } } [/code]
0 notes
Text

Feature Construction and Feature Splitting in Machine Learning
Feature engineering is one of the most important parts of the machine learning process. It helps improve the performance of models by modifying and optimizing the data. In this article, we’ll focus on two crucial feature engineering techniques: feature construction and feature splitting. Both are beginner-friendly and can significantly improve the quality of your dataset.
Let’s break it down into a simple, list-based structure to make it easy to follow.
1. Feature Construction
What is Feature Construction?
Feature construction is the process of creating new features from raw data or combining existing ones to provide better insights for a machine learning model.
For example:
From a Date column, we can construct features like Year, Month, or Day.
For a Price column, you can create a Price_Per_Unit feature by dividing the price by the number of units.
Why is Feature Construction Important?
1. Improves Accuracy: New features often capture hidden patterns in the data.
2. Simplifies Relationships: Some models work better when data is transformed into simpler relationships.
3. Handles Missing Information: Constructed features can sometimes fill gaps in the dataset.
Techniques for Feature Construction
1. Date Feature Construction
Extract components like year, month, day, or even day of the week from date columns.
Helps analyze trends or seasonality.
2. Mathematical Transformations
Create new features using arithmetic operations.
Example: If you have Length and Width, construct an Area = Length × Width feature.
3. Text Feature Construction
Extract features like word count, average word length, or even sentiment from text data.
4. Polynomial Features
Generate interaction terms or powers of numerical features to capture non-linear relationships.
Example: X1^2, X1 * X2.
Python Code for Feature Construction
Example 1: Constructing Features from Dates
import pandas as pd
# Sample dataset
data = {'date': ['2023-01-01', '2023-03-10', '2023-07-20']}
df = pd.DataFrame(data)
# Convert to datetime
df['date'] = pd.to_datetime(df['date'])
# Construct new features
df['year'] = df['date'].dt.year
df['month'] = df['date'].dt.month
df['day_of_week'] = df['date'].dt.dayofweek
df['is_weekend'] = df['day_of_week'].apply(lambda x: 1 if x >= 5 else 0)
print(df)
Example 2: Creating Polynomial Features
from sklearn.preprocessing import PolynomialFeatures
import pandas as pd
# Sample dataset
data = {'X1': [2, 3, 5], 'X2': [4, 6, 8]}
df = pd.DataFrame(data)
# Generate polynomial features
poly = PolynomialFeatures(degree=2, include_bias=False)
poly_features = poly.fit_transform(df)
# Convert to DataFrame
poly_df = pd.DataFrame(poly_features, columns=poly.get_feature_names_out(['X1', 'X2']))
print(poly_df)
for more read click here https://datacienceatoz.blogspot.com/2025/01/feature-construction-and-feature.html
#datascince #machinelearnings #data #science
#coding#science#skills#programming#bigdata#books#machinelearning#artificial intelligence#python#machine learning
1 note
·
View note
Text
Advanced SAS Functions for Data Transformation: Unlocking the Power of SAS Programming
Data transformation is one of the most fundamental aspects of data analysis, and mastering SAS functions for transforming data is essential for those seeking to take their analysis to the next level. SAS Tutorials introduce basic data manipulation techniques, but as your proficiency in SAS Programming Tutorial grows, it becomes important to explore more advanced techniques. This guide will highlight some of the most powerful SAS functions that can help you unlock the full potential of your data.
Overview of Data Transformation in SAS
Data transformation refers to changing the structure or values in a dataset to make it more suitable for analysis. Common transformations include converting variables, creating new variables, and reshaping data formats. In SAS Tutorial Online, the DATA Step is frequently used for these transformations, offering a high degree of flexibility and control over how data is handled.
Using PROC TRANSPOSE for Data Reshaping
One of the most commonly used SAS functions for reshaping data is PROC TRANSPOSE. This function allows you to convert data from wide to long format and vice versa. For example, if you have a dataset with multiple measurements for each subject in separate columns, PROC TRANSPOSE can be used to stack these values into a single column for analysis.
This process is particularly helpful when you want to aggregate data or perform statistical analysis on time-series data. Using SAS Programming Tutorial to learn the ins and outs of PROC TRANSPOSE enables you to apply this powerful function to a variety of datasets.
Mastering the DATA Step for Advanced Data Manipulation
The DATA Step is one of the most powerful tools in SAS, and learning to use it effectively for data transformation is key to unlocking advanced techniques. With the DATA Step, you can manipulate variables, create new calculated columns, and merge datasets based on specific conditions.
For example, if you need to apply a condition to a specific column based on another column's value, you can use conditional logic within the DATA Step. This allows you to clean and modify data according to your exact specifications. For more complex tasks, the SAS Programming Tutorial provides detailed examples on how to perform such transformations using simple code.
Leveraging SAS Functions for Variable Transformation
SAS provides a wealth of built-in functions for transforming individual variables. These include text manipulation functions like SUBSTR and UPCASE, numerical functions like ROUND and INT, and date functions like MDY. Understanding how to leverage these functions in your DATA Step can drastically simplify the process of cleaning and transforming data.
For example, you can use SUBSTR to extract part of a string or UPCASE to convert all text to uppercase for consistency in your dataset. Advanced users often combine these functions within DATA Steps to apply transformations across entire datasets efficiently.
Conclusion
Advanced SAS functions provide the tools you need to manipulate and transform data in powerful ways. Whether reshaping data with PROC TRANSPOSE, using the DATA Step for conditional transformations, or leveraging built-in functions for variable manipulation, mastering these techniques is crucial for advanced SAS users. By learning these transformation functions, you can enhance your data analysis and unlock new insights that would otherwise remain hidden.
0 notes
Text
Power BI Training | Power BI Online Training
Power BI Training: What Types of Data Can Power BI Handle?

Power BI Training equips individuals and businesses with the skills to transform raw data into actionable insights. One of the primary reasons Power BI has gained immense popularity in recent years is its unparalleled ability to handle a wide variety of data types. Whether you’re analyzing financial reports, visualizing customer trends, or integrating cloud data sources, Power BI is a versatile tool that supports diverse data formats and systems. With the growing demand for Power BI Online Training, users can now easily master the techniques to utilize its capabilities and integrate data from multiple sources seamlessly.
In this article, we will explore the types of data that Power BI can handle and highlight how the tool empowers users to extract value from various data streams. From relational databases to real-time cloud data, understanding Power BI's compatibility with different data formats is essential for both beginners and advanced users.
Relational Databases: The Foundation of Business Insights
Relational databases are among the most commonly used data sources in businesses. Power BI connects seamlessly with relational databases such as SQL Server, MySQL, Oracle Database, and PostgreSQL. These databases store structured data in tables, making them ideal for generating reports and dashboards. Power BI Training emphasizes leveraging these connections to perform efficient data modeling, create calculated columns, and design measures using DAX (Data Analysis Expressions).
By utilizing Power BI's built-in data connectors, users can import large volumes of structured data without compromising performance. Whether it’s sales data, inventory records, or employee metrics, Power BI empowers users to uncover insights through its interactive dashboards.
Excel and CSV Files: Simplicity Meets Functionality
Power BI is widely known for its compatibility with Excel and CSV files, making it a favourite tool among professionals who work with these formats. Many organizations rely on spreadsheets for budgeting, forecasting, and reporting. Power BI allows users to directly import and transform this data into visually appealing reports.
With Power BI Online Training, users can also learn how to automate the refresh of data from Excel files stored on One Drive or SharePoint. This ensures that reports and dashboards remain up-to-date without manual intervention. Its drag-and-drop interface simplifies the process of merging multiple datasets, enabling users to create comprehensive views of their business operations.
Cloud Data Sources: Real-Time Data at Your Fingertips
As businesses transition to cloud-based platforms, the ability to analyze real-time data has become critical. Power BI supports a wide range of cloud-based data sources, including Azure SQL Database, Google BigQuery, Amazon Redshift, and Salesforce. This capability allows users to connect to live datasets and monitor key performance indicators (KPIs) in real time.
Power BI Training often covers best practices for working with cloud data, including configuring gateways and optimizing queries for faster performance. This is particularly useful for businesses that rely on SaaS (Software as a Service) applications for their day-to-day operations. Real-time analytics in Power BI can drive immediate decision-making, helping businesses stay competitive in dynamic markets.
Unstructured Data: Making Sense of Complexity
While structured data is easy to analyze, unstructured data presents a unique challenge. Unstructured data includes formats like text files, PDFs, social media content, and multimedia files. With the help of tools like Power BI and its integration with Azure Cognitive Services, users can analyze and visualize unstructured data effectively.
For example, sentiment analysis can be performed on customer reviews or social media posts, providing businesses with valuable insights into consumer behaviour. Advanced Power BI Online Training delves into techniques for handling unstructured data, including natural language processing (NLP) and custom visualizations.
Big Data: Harnessing Volume, Variety, and Velocity
In the era of big data, organizations must process large datasets that often come from diverse sources. Power BI integrates seamlessly with big data platforms like Hadoop, Apache Spark, and Azure Data Lake. These integrations enable users to analyze massive datasets without requiring extensive technical expertise.
During Power BI Training, participants learn how to use DirectQuery and import modes to optimize big data workflows. DirectQuery allows users to query large datasets without importing them into Power BI, which is particularly useful for businesses dealing with high-volume data streams. These capabilities make Power BI an essential tool for industries such as finance, healthcare, and retail.
APIs and Custom Data Sources: Flexibility Redefined
Power BI's ability to connect with APIs (Application Programming Interfaces) opens up a world of possibilities for developers and data analysts. APIs allow Power BI to pull data from custom sources, including proprietary systems and third-party applications. By configuring API connections, users can create custom dashboards tailored to their specific needs.
Through Power BI Online Training, users can learn how to set up and manage these custom integrations. This feature is particularly beneficial for organizations that rely on niche software solutions for their operations. With Power BI, even the most complex data sources can be visualized and shared across teams.
IoT Data: Driving Innovation with Real-Time Insights
The Internet of Things (IoT) has revolutionized industries by providing real-time data from sensors, devices, and machines. Power BI supports IoT data integration through Azure IoT Hub, enabling users to monitor equipment performance, track energy consumption, or analyze logistics operations in real time.
Participants in Power BI Training gain hands-on experience in working with IoT data, learning how to build dynamic dashboards that capture and visualize live data streams. These capabilities are critical for industries like manufacturing, transportation, and energy, where timely insights can prevent downtime and improve efficiency.
Conclusion
Power BI's versatility lies in its ability to handle a wide range of data types, from structured and unstructured datasets to real-time IoT and big data sources. By integrating with relational databases, spreadsheets, cloud services, and APIs, Power BI has established itself as a comprehensive tool for data analysis and visualization.
For professionals and organizations looking to harness the full potential of this tool, Power BI Training provides the foundation needed to master its features. Whether you're a beginner or an experienced analyst, Power BI Online Training ensures that you can work efficiently with various data formats and create impactful reports. With Power BI, the possibilities for data-driven decision-making are virtually limitless.
Visualpath is the Leading and Best Institute for learning in Hyderabad. We provide Power BI Course Online. You will get the best course at an affordable cost.
Attend Free Demo
Call on – +91-9989971070
Blog: https://visualpathblogs.com/
What’s App: https://www.whatsapp.com/catalog/919989971070/
Visit: https://www.visualpath.in/powerbi-training.html
#Power BI Training#Power BI Online Training#Power BI Course Online#Power BI Training in Hyderabad#Power BI Training in Ameerpet#Power BI Training Institute in Hyderabad#Power BI Online Training Hyderabad#Power BI Course in Hyderabad
1 note
·
View note
Text
Mastering Data Organization: An In-Depth Look at Sorting Tools and Sorting Utilities
In the age of information, data is the new gold. The ability to organize, sort, and retrieve data efficiently is crucial for individuals and organizations alike. Whether you're managing a small personal project or handling massive datasets for a business, sorting tools and sorting utilities play a pivotal role in making sense of your data. In this blog, we will delve into the world of sorting tools and sorting utilities, exploring their importance, types, and how to choose the right ones for your needs.

Understanding the Importance of Sorting Tools and Sorting Utilities
Sorting is a fundamental operation in data processing. It involves arranging data in a particular order, which can be ascending, descending, alphabetical, or based on other criteria. This organization makes it easier to analyze, visualize, and extract meaningful insights from the data.
Efficiency and Performance: Properly sorted data can significantly enhance the efficiency of search operations. For instance, a sorted list allows for faster binary searches, which is much more efficient than linear searches.
Data Analysis: Sorting is often a preliminary step in data analysis. It helps in identifying patterns, trends, and outliers, which are critical for making informed decisions.
Data Presentation: In many cases, sorted data is more presentable and easier to understand. For example, financial reports often sort transactions by date or amount to provide a clearer picture of financial activities.
Types of Sorting Tools and Sorting Utilities
There is a wide range of sorting tools and sorting utilities available, each designed to cater to different types of data and user needs. These can be broadly categorized into:
1. Built-in Sorting Functions in Software Applications
Most software applications, such as spreadsheets (Excel, Google Sheets) and database management systems (MySQL, PostgreSQL), come with built-in sorting functions. These tools are user-friendly and sufficient for basic sorting tasks.
- Excel and Google Sheets: Both offer simple sorting options that allow you to sort data in columns or rows with just a few clicks. You can sort alphabetically, numerically, or by custom criteria.
- SQL Databases: SQL provides powerful sorting capabilities using the `ORDER BY` clause. This is especially useful for sorting large datasets stored in databases.
2. Programming Language Libraries
For more complex sorting tasks, especially when dealing with large datasets or custom sorting logic, programming languages provide robust libraries and functions.
- Python: The `sorted()` function and the `sort()` method in Python’s standard library are versatile and efficient. Libraries like Pandas offer even more powerful sorting capabilities for data frames.
- JavaScript: The `sort()` method in JavaScript is commonly used for sorting arrays. It can handle basic alphanumeric sorting as well as more complex custom sorting functions.
- Java: Java’s Collections Framework includes the `Collections.sort()` method and the `Arrays.sort()` method for sorting lists and arrays, respectively.
3. Specialized Sorting Utilities
There are also specialized sorting utilities designed for specific tasks or industries. These tools often offer advanced features not available in general-purpose applications or libraries.
- GNU Sort: Part of the GNU Core Utilities, this command-line utility is extremely powerful for sorting text files and can handle very large files efficiently.
- Apache Hadoop: For big data applications, Hadoop’s MapReduce framework includes sorting as a key step in the data processing pipeline. It’s designed to handle vast amounts of data distributed across many machines.
- Excel Add-ins: Various add-ins extend Excel’s sorting capabilities, offering more advanced and customizable sorting options.
Choosing the Right Sorting Tools and Sorting Utilities
The choice of sorting tools and sorting utilities depends on several factors, including the size of the dataset, the complexity of the sorting criteria, and the specific requirements of the task at hand.
1. Dataset Size
- Small to Medium Datasets: For datasets that fit comfortably into memory, built-in functions in applications like Excel or basic sorting functions in programming languages are usually sufficient.
- Large Datasets: For very large datasets, especially those that don’t fit into memory, specialized tools like GNU Sort or distributed systems like Hadoop are more appropriate.
2. Sorting Complexity
- Simple Sorting: If you need to sort data by a single criterion (e.g., alphabetical order), built-in functions in software applications or simple programming language methods will do the job.
- Complex Sorting: For multi-criteria sorting or custom sorting logic, programming libraries offer greater flexibility. Python’s Pandas library, for instance, allows sorting by multiple columns with different sorting orders for each.
3. Specific Requirements
- Real-time Sorting: If you need real-time or interactive sorting, such as in a web application, JavaScript’s `sort()` method is ideal.
- Batch Sorting: For batch processing of large files, command-line utilities like GNU Sort are highly efficient.
Best Practices for Using Sorting Tools and Sorting Utilities
To make the most of sorting tools and sorting utilities, consider the following best practices:
1. Understand Your Data: Before sorting, ensure you understand the structure and characteristics of your data. This helps in choosing the right sorting criteria and tools.
2. Optimize for Performance: For large datasets, consider the time complexity of the sorting algorithm. Efficient algorithms like QuickSort, MergeSort, and TimSort can make a significant difference in performance.
3. Handle Special Cases: Be aware of special cases such as duplicate values, null values, and different data types. Ensure your sorting logic can handle these appropriately.
4. Leverage Advanced Features: Explore advanced features of sorting utilities. For example, GNU Sort offers options for numerical sorting, reverse sorting, and specifying delimiters.
5. Test Thoroughly: Always test your sorting operations with different subsets of your data to ensure they work correctly under various conditions.
Conclusion
Sorting tools and sorting utilities are indispensable in the world of data management. From simple built-in functions in software applications to powerful specialized utilities and programming libraries, there’s a wide range of options available to suit different needs. By understanding the strengths and limitations of these tools, you can choose the right ones to efficiently organize and make sense of your data. Whether you’re dealing with a small spreadsheet or a massive big data project, mastering sorting tools and sorting utilities will enhance your data processing capabilities and help you unlock valuable insights.
0 notes
Text
Unleash the Power of Your Scanned Documents: An Introduction to Optical Character Recognition (OCR)

Introduction:
Millions of documents pile up in businesses and homes alike. Whether you're an individual drowning in receipts or a company managing mountains of paperwork, finding the information you need can be a time-consuming hassle. Optical Character Recognition (OCR) technology offers a solution by transforming scanned documents and images into editable and searchable digital files.
What is Optical Character Recognition (OCR)?
Simply put, OCR is the magic behind converting images into text that your computer can understand. Imagine taking a picture of a handwritten recipe or a printed document and instantly having the text editable on your computer! OCR software analyzes the image, recognizes the letters and shapes, and then converts them into digital text.
Benefits of OCR for Everyone:
Boost Productivity: No more wasting time manually retyping information from scanned documents. OCR lets you quickly extract text and edit it electronically, saving you valuable time and effort.
Reduce Costs: Eliminate the need for physical storage and simplify document retrieval. Digital documents are easier to manage, share, and access, saving you on printing and storage expenses.
Enhance Data Management: OCR empowers you to organize your digital documents efficiently. Search for keywords within scanned documents to find the information you need instantly, improving your workflow.
While OCR is a powerful tool, it's important to understand its limitations:
Accuracy: OCR technology has come a long way, but it's not perfect. Factors like poor image quality, unusual fonts, or handwritten text can lead to errors. Proofreading the extracted text is often necessary.
Complex Layouts: OCR software might struggle with documents containing complex layouts, tables, or multiple columns. These elements might require additional processing or manual intervention.
Exploring Feature-Rich OCR Solutions:
While basic OCR can handle simple documents, some tasks require more advanced capabilities. Here's where feature-rich OCR solutions come in. These tools go beyond simple text extraction, offering functionalities like:
Handwritten Text Recognition: Accurately extract text from handwritten documents like receipts or forms.
Table Extraction: Convert tables within scanned documents into editable spreadsheets, preserving data integrity.
Intelligent Data Extraction: Identify specific data points like key-value pairs, checkboxes, or signatures, making information readily accessible.
Flexible Export Options: Export extracted data in various formats like CSV, XML, or Excel, or integrate seamlessly with your accounting software.
Popular options include Docsumo, Nanonets, Docparser and AlgoDocs. AlgoDocs stands out for its cloud-based AI platform, offering features like those mentioned above. It boasts advanced capabilities like handwriting recognition, table extraction, and intelligent data extraction. Additionally, AlgoDocs provides a free tier with 50 pages processed monthly, making it an attractive option for users with moderate needs.

Conclusion:
OCR technology bridges the gap between physical documents and the digital world. By converting scanned documents into searchable and editable files, OCR empowers you to streamline workflows, boost productivity, and improve data management. Whether you're a busy professional or someone looking to organize your personal documents, OCR can be a valuable tool in your digital arsenal.
#AlgoDocs#TableExtraction#OCRAlgorithms#AIHandwritingRecognition ✍️#AlgoDocsOCRRevolution 🔄🔍#ImageToExcel#PdfToExcel
0 notes
Text
ETL Processing in the Era of Unstructured Data

In the modern data landscape, the volume and variety of data generated have grown exponentially, with a significant portion being unstructured or semi-structured. This includes data from sources such as social media feeds, sensor readings, emails, documents, images, and more. Extracting insights from this diverse range of data requires advanced techniques and tools. Enter ETL (Extract, Transform, Load) processing, which has evolved to accommodate the challenges posed by unstructured data, offering organizations the ability to harness its potential for valuable insights and informed decision-making.
The Challenge of Unstructured Data
Unstructured data lacks a predefined data model and does not fit neatly into traditional relational databases. This poses a significant challenge for organizations looking to derive value from their data assets. Unlike structured data, which is organized into rows and columns, unstructured data comes in various formats, making it difficult to analyze using conventional methods. However, within this challenge lies an opportunity for organizations to unlock valuable insights and gain a competitive edge.
Extracting Insights from Unstructured Data
ETL processing plays a crucial role in unlocking the insights hidden within unstructured data. The "Extract" phase involves retrieving data from disparate sources, including text documents, images, audio files, and more. This may involve web scraping, file parsing, or connecting to APIs to collect data from social media platforms, IoT devices, or other sources. Advanced techniques such as natural language processing (NLP) and computer vision are often employed to extract meaningful information from text and image data, respectively.
Transforming Unstructured Data into Actionable Insights
Once the unstructured data is extracted, the next step is to transform it into a structured format that can be analyzed and used for decision-making. This transformation process involves cleaning, enriching, and organizing the data to ensure its accuracy, consistency, and relevance. For example, text data may undergo sentiment analysis to categorize it as positive, negative, or neutral, while image data may be processed to extract features or identify patterns using machine learning algorithms. By transforming unstructured data into a structured format, organizations can derive actionable insights and make informed decisions based on a comprehensive understanding of their data.
Loading Process and Integration
The final phase of ETL processing involves loading the transformed data into a target system, such as a data warehouse, data lake, or analytical database, where it can be accessed and analyzed by business users. Integration with existing data infrastructure is critical to ensure seamless access to insights across the organization. Data from unstructured sources may be combined with structured data to provide a holistic view of business operations, customer behavior, market trends, and more.
Challenges and Considerations
While ETL processing enables organizations to leverage unstructured data for actionable insights, several challenges must be addressed. These include data quality issues, scalability concerns, and the need for specialized skills and technologies to handle diverse data formats effectively. Additionally, privacy and compliance considerations must be taken into account when processing sensitive information from unstructured sources.
Future Trends and Opportunities
Looking ahead, the era of unstructured data presents immense opportunities for organizations willing to embrace advanced analytics and data-driven decision-making. Innovations in artificial intelligence, machine learning, and big data technologies continue to drive advancements in ETL processing, enabling organizations to extract insights from unstructured data at scale and in real-time. As the volume and variety of data continue to grow, ETL processing will remain a critical tool for organizations seeking to unlock the full potential of their data assets and gain a competitive edge in the digital age.
0 notes
Text
AWS Data Engineering Training Ameerpet | Data Analytics Course Training
Data Preparation for Analysis
Data analytics involves the systematic exploration, interpretation, and modelling of raw data to extract meaningful insights, patterns, and trends. Through various statistical and computational techniques, data analytics transforms unstructured or structured data into valuable information, aiding decision-making processes in diverse fields such as business, science, and technology. Data preparation is a crucial step in the data analysis process. It involves cleaning, organizing, and transforming raw data into a format that is suitable for analysis. Here are some key steps in data preparation for analysis
AWS Data Engineering Online Training

Data Collection:
Gather all relevant data from various sources, such as databases, spreadsheets, text files, or APIs.
Data Cleaning:
Identify and handle missing data: Decide how to handle missing values, either by imputing them or removing rows/columns with missing values.
Remove duplicate data: Eliminate identical rows to avoid duplication bias.
Correct inaccuracies: Address any errors, outliers, or inaccuracies in the data.
Data Transformation:
Convert data types: Ensure that variables are in the correct format (e.g., numerical, categorical, date).
Standardize/normalize data: Scale numerical variables to a consistent range for better comparisons.
Create derived variables: Generate new features that might enhance analysis.
Handle outliers: Decide whether to remove, transform, or keep outliers based on the analysis goals. - AWS Data Engineering Training
Data Exploration:
Explore the distribution of variables.
Generate summary statistics (mean, median, mode, standard deviation, etc.).
Create visualizations (histograms, box plots, scatter plots) to understand patterns and relationships.
Data Integration:
Combine data from different sources if necessary.
Ensure consistency in variables and units.
Handling Categorical Data:
Convert categorical variables into numerical representations (one-hot encoding, label encoding) if needed.
Explore and understand the distribution of categorical variables.
- Data Engineer Course in Ameerpet
Data Splitting:
Divide the dataset into training and testing sets for model evaluation (if applicable).
Feature Scaling:
Normalize or standardize numerical features to ensure that they contribute equally to the analysis.
Handling Time-Series Data:
If working with time-series data, ensure proper time ordering.
Extract relevant temporal features. - Data Analyst Course in Hyderabad
Documentation:
Document all the steps taken during data preparation, including any decisions made or assumptions.
Data Security and Privacy:
Ensure compliance with data protection regulations.
Anonymize or pseudonymize sensitive information.
Version Control:
Establish version control for datasets to track changes made during the preparation process.
Remember that the specific steps may vary based on the nature of your data and the goals of your analysis. The key is to understand the characteristics of your data and make informed decisions to ensure the quality and reliability of your analysis.
Visualpath is the Leading and Best Institute for AWS Data Engineering Online Training, Hyderabad. We AWS Data Engineering Training provide you will get the best course at an affordable cost.
Attend Free Demo
Call on - +91-9989971070.
Visit : https://www.visualpath.in/aws-data-engineering-with-data-analytics-training.html
#AWS Data Engineering Online Training#AWS Data Engineering#Data Engineer Training in Hyderabad#AWS Data Engineering Training in Hyderabad#Data Engineer Course in Ameerpet#AWS Data Engineering Training Ameerpet#Data Analyst Course in Hyderabad#Data Analytics Course Training
0 notes
Text
50 Big Data Concepts Every Data Engineer Should Know

Big data is the primary force behind data-driven decision-making. It enables organizations to acquire insights and make informed decisions by utilizing vast amounts of data. Data engineers play a vital role in managing and processing big data, ensuring its accessibility, reliability, and readiness for analysis. To succeed in this field, data engineers must have a deep understanding of various big data concepts and technologies.
This article will introduce you to 50 big data concepts that every data engineer should know. These concepts encompass a broad spectrum of subjects, such as data processing, data storage, data modeling, data warehousing, and data visualization.
1. Big Data
Big data refers to datasets that are so large and complex that traditional data processing tools and methods are inadequate to handle them effectively.
2. Volume, Velocity, Variety
These are the three V’s of big data. Volume refers to the sheer size of data, velocity is the speed at which data is generated and processed, and variety encompasses the different types and formats of data.
3. Structured Data
Data that is organized into a specific format, such as rows and columns, making it easy to query and analyze. Examples include relational databases.
4. Unstructured Data
Data that lacks a predefined structure, such as text, images, and videos. Processing unstructured data is a common challenge in big data engineering.
5. Semi-Structured Data
Data that has a partial structure, often in the form of tags or labels. JSON and XML files are examples of semi-structured data.
6. Data Ingestion
The process of collecting and importing data into a data storage system or database. It’s the first step in big data processing.
7. ETL (Extract, Transform, Load)
ETL is a data integration process that involves extracting data from various sources, transforming it to fit a common schema, and loading it into a target database or data warehouse.
8. Data Lake
A centralized repository that can store vast amounts of raw and unstructured data, allowing for flexible data processing and analysis.
9. Data Warehouse
A structured storage system designed for querying and reporting. It’s used to store and manage structured data for analysis.
10. Hadoop
An open-source framework for distributed storage and processing of big data. Hadoop includes the Hadoop Distributed File System (HDFS) and MapReduce for data processing.
11. MapReduce
A programming model and processing technique used in Hadoop for parallel computation of large datasets.
12. Apache Spark
An open-source, cluster-computing framework that provides in-memory data processing capabilities, making it faster than MapReduce.
13. NoSQL Databases
Non-relational databases designed for handling unstructured and semi-structured data. Types include document, key-value, column-family, and graph databases.
14. SQL-on-Hadoop
Technologies like Hive and Impala that enable querying and analyzing data stored in Hadoop using SQL-like syntax.
15. Data Partitioning
Dividing data into smaller, manageable subsets based on specific criteria, such as date or location. It improves query performance.
16. Data Sharding
Distributing data across multiple databases or servers to improve data retrieval and processing speed.
17. Data Replication
Creating redundant copies of data for fault tolerance and high availability. It helps prevent data loss in case of hardware failures.
18. Distributed Computing
Computing tasks that are split across multiple nodes or machines in a cluster to process data in parallel.
19. Data Serialization
Converting data structures or objects into a format suitable for storage or transmission, such as JSON or Avro.
20. Data Compression
Reducing the size of data to save storage space and improve data transfer speeds. Compression algorithms like GZIP and Snappy are commonly used.
21. Batch Processing
Processing data in predefined batches or chunks. It’s suitable for tasks that don’t require real-time processing.
22. Real-time Processing
Processing data as it’s generated, allowing for immediate insights and actions. Technologies like Apache Kafka and Apache Flink support real-time processing.
23. Machine Learning
Using algorithms and statistical models to enable systems to learn from data and make predictions or decisions without explicit programming.
24. Data Pipeline
A series of processes and tools used to move data from source to destination, often involving data extraction, transformation, and loading (ETL).
25. Data Quality
Ensuring data accuracy, consistency, and reliability. Data quality issues can lead to incorrect insights and decisions.
26. Data Governance
The framework of policies, processes, and controls that define how data is managed and used within an organization.
27. Data Privacy
Protecting sensitive information and ensuring that data is handled in compliance with privacy regulations like GDPR and HIPAA.
28. Data Security
Safeguarding data from unauthorized access, breaches, and cyber threats through encryption, access controls, and monitoring.
29. Data Lineage
A record of the data’s origins, transformations, and movement throughout its lifecycle. It helps trace data back to its source.
30. Data Catalog
A centralized repository that provides metadata and descriptions of available datasets, making data discovery easier.
31. Data Masking
The process of replacing sensitive information with fictional or scrambled data to protect privacy while preserving data format.
32. Data Cleansing
Identifying and correcting errors or inconsistencies in data to improve data quality.
33. Data Archiving
Moving data to secondary storage or long-term storage to free up space in primary storage and reduce costs.
34. Data Lakehouse
An architectural approach that combines the benefits of data lakes and data warehouses, allowing for both storage and structured querying of data.
35. Data Warehouse as a Service (DWaaS)
A cloud-based service that provides on-demand data warehousing capabilities, reducing the need for on-premises infrastructure.
36. Data Mesh
An approach to data architecture that decentralizes data ownership and management, enabling better scalability and data access.
37. Data Governance Frameworks
Defined methodologies and best practices for implementing data governance, such as DAMA DMBOK and DCAM.
38. Data Stewardship
Assigning data stewards responsible for data quality, security, and compliance within an organization.
39. Data Engineering Tools
Software and platforms used for data engineering tasks, including Apache NiFi, Talend, Apache Beam, and Apache Airflow.
40. Data Modeling
Creating a logical representation of data structures and relationships within a database or data warehouse.
41. ETL vs. ELT
ETL (Extract, Transform, Load) involves extracting data, transforming it, and then loading it into a target system. ELT (Extract, Load, Transform) loads data into a target system before performing transformations.
42. Data Virtualization
Providing a unified view of data from multiple sources without physically moving or duplicating the data.
43. Data Integration
Combining data from various sources into a single, unified view, often involving data consolidation and transformation.
44. Streaming Data
Data that is continuously generated and processed in real-time, such as sensor data and social media feeds.
45. Data Warehouse Optimization
Improving the performance and efficiency of data warehouses through techniques like indexing, partitioning, and materialized views.
46. Data Governance Tools
Software solutions designed to facilitate data governance activities, including data cataloging, data lineage, and data quality tools.
47. Data Lake Governance
Applying data governance principles to data lakes to ensure data quality, security, and compliance.
48. Data Curation
The process of organizing, annotating, and managing data to make it more accessible and valuable to users.
49. Data Ethics
Addressing ethical considerations related to data, such as bias, fairness, and responsible data use.
50. Data Engineering Certifications
Professional certifications, such as the Google Cloud Professional Data Engineer or Microsoft Certified: Azure Data Engineer, that validate expertise in data engineering.
Elevate Your Data Engineering Skills
Data engineering is a dynamic field that demands proficiency in a wide range of concepts and technologies. To excel in managing and processing big data, data engineers must continually update their knowledge and skills.
If you’re looking to enhance your data engineering skills or start a career in this field, consider enrolling in Datavalley’s Big Data Engineer Masters Program. This comprehensive program provides you with the knowledge, hands-on experience, and guidance needed to excel in data engineering. With expert instructors, real-world projects, and a supportive learning community, Datavalley’s course is the ideal platform to advance your career in data engineering.
Don’t miss the opportunity to upgrade your data engineering skills and become proficient in the essential big data concepts. Join Datavalley’s Data Engineering Course today and take the first step toward becoming a data engineering expert. Your journey in the world of data engineering begins here.
#datavalley#data engineering#dataexperts#data analytics#data science course#data analytics course#data science#business intelligence#dataexcellence#power bi#data engineering roles#online data engineering course#data engineering training#data#data visualization
1 note
·
View note
Text
Essential Excel Skills Every Data Analyst Should Master

Excel is a cornerstone tool in the world of data analysis. Its versatility, combined with powerful features, makes it invaluable for professionals working with data every day. If you want to thrive as a data analyst, developing strong Excel skills is not just beneficial — it’s essential.
Whether you’re just starting or looking to level up your expertise, focusing on the right Excel capabilities can make your work faster, more accurate, and insightful.
In this article, we’ll explore the key Excel skills data analysts classes should master, along with practical tips on how to apply them effectively.
Data Import and Cleaning: Preparing Your Data for Analysis
Before you can analyze data, you need to get it into Excel and ensure it’s clean and reliable. Data import involves bringing information from various sources — CSV files, databases, web pages, or other software — into your workbook.
Once imported, cleaning the data is crucial. This means handling missing values by deciding whether to fill, ignore, or remove them. Removing duplicates keeps your dataset accurate, while correcting errors like inconsistent formatting or typos prevents misleading results.
Using Excel’s built-in features such as Text to Columns, Find & Replace, and Data Validation can speed up this process and improve data quality.
Data Transformation: Shaping Your Data to Tell a Story
Raw data often isn’t ready for analysis. You’ll need to transform it by manipulating and reshaping to answer your questions better. Excel functions like CONCATENATE help you combine text fields, while LEFT and RIGHT extract specific parts of strings, such as area codes from phone numbers.
VLOOKUP is a classic function for merging data from different tables, but learning INDEX-MATCH can give you more flexibility and reliability.
PivotTables allow you to pivot your data, meaning you can rearrange rows and columns quickly to summarize and explore your data from multiple angles.
Data Analysis Functions: Extracting Meaning from Numbers
A solid understanding of Excel’s data analysis functions is a must. Functions like SUMIFS and COUNTIFS let you sum or count data conditionally — for example, calculating total sales for a particular region or counting customers by segment.
AVERAGEIFS works similarly, enabling you to find average values based on multiple criteria. MAX and MIN help identify extremes, while SUMPRODUCT allows for weighted calculations that can combine multiple arrays logically.
Logical functions such as IF, AND, and OR help create dynamic formulas that change results based on conditions, essential for scenario analysis and decision-making.
Data Visualization: Making Your Insights Visible
Numbers tell a story, but visualizing those numbers makes the story easier to understand. Creating charts like bar charts, line charts, or scatter plots helps reveal trends, comparisons, and outliers.
Excel’s chart customization options allow you to adjust colors, add labels, titles, and legends, and format axes for clarity and appeal. Well-designed charts make reports more engaging and accessible to stakeholders.
Statistical Analysis: Unlocking Deeper Insights
For more advanced data work, Excel offers statistical functions to calculate measures like mean, median, and standard deviation quickly. These descriptive statistics give you a snapshot of your data’s distribution and variability.
Excel’s Data Analysis ToolPak adds capabilities for hypothesis testing, regression, and ANOVA, allowing you to perform basic statistical analysis without needing separate software.
Advanced Formulas: Taking Your Analysis Further
Once you’re comfortable with basics, exploring advanced formulas can dramatically enhance your efficiency. Array formulas, for example, perform calculations on multiple values at once, reducing the need for repetitive tasks.
The combination of INDEX and MATCH is a powerful alternative to VLOOKUP, especially for large datasets where performance and flexibility matter.
Data Validation and Error Handling: Keeping Your Data Reliable
To ensure the integrity of your data, learn to implement data validation rules. These rules restrict inputs to expected formats or ranges, preventing incorrect or inconsistent data from entering your sheets.
Equally important is setting up error handling within formulas using IFERROR or ISERROR functions, which help manage and display meaningful messages instead of cryptic error codes. This practice makes spreadsheets more user-friendly and trustworthy.
Time Series Analysis: Working with Dates and Trends
If your data involves dates, mastering Excel’s date and time functions will help you analyze trends over time effectively. Calculating moving averages smooths out fluctuations, highlighting underlying trends.
You can also explore seasonality by comparing data across different time periods, helping businesses plan better and forecast accurately.
Quick Recap: Key Excel Skills for Data Analysts
Import and clean data from diverse sources to ensure quality
Transform and manipulate data using functions like CONCATENATE and VLOOKUP
Use conditional functions such as SUMIFS and IF to analyze data effectively
Visualize data with charts for clear, impactful storytelling
Apply statistical tools for deeper data understanding
Build advanced formulas including array functions and INDEX-MATCH
Maintain data integrity with validation and error handling
Analyze time-based data for trend and seasonality insights
Conclusion
Excel remains a fundamental skill for any data analyst aiming to deliver actionable insights. From importing raw data to creating advanced visualizations and statistical analysis, mastering these core Excel skills will boost your confidence and effectiveness.
Start by practicing with your own datasets, experiment with the features highlighted here, and seek out tutorials or courses to deepen your knowledge. With steady practice, Excel will become your trusted partner in turning data into decisions.
If you want recommendations for beginner-friendly Excel courses or project ideas to get hands-on experience, feel free to ask.
0 notes
Text
Exploring New Excel Formulas in 2019: Boosting Your Spreadsheet Skills
Microsoft Excel is a powerhouse tool for data analysis, financial modeling, and day-to-day office tasks. In 2019, Microsoft introduced some exciting new features and formulas that further empowered users to streamline their work and make data-driven decisions. In this article, we'll explore some of the most notable Excel formulas introduced in 2019 and how they can enhance your spreadsheet skills.
CONCAT and TEXTJOIN Concatenating text has always been a common task in Excel, and in 2019, Microsoft introduced two new functions, CONCAT and TEXTJOIN, to simplify this process. CONCAT allows you to combine text from different cells into one, making it easier to create custom labels or descriptions. TEXTJOIN takes this a step further by allowing you to specify a delimiter, such as a comma or space, to separate the text.
Example:
CONCAT: =CONCAT(A1, " - ", B1) combines the contents of cells A1 and B1 with a hyphen in between. TEXTJOIN: =TEXTJOIN(", ", TRUE, A1:A3) combines the values in cells A1 to A3 with a comma and space as the delimiter.

IFS and SWITCH The IFS and SWITCH functions introduced in 2019 help simplify complex logical tests and make your formulas more readable. IFS allows you to evaluate multiple conditions and return the result for the first true condition. SWITCH, on the other hand, is particularly handy when you have multiple options and want to select one based on a given value.
Example:
IFS: =IFS(A1>90, "A", A1>80, "B", A1>70, "C", TRUE, "D") assigns grades based on the value in cell A1.
SWITCH: =SWITCH(A1, "Apple", 1, "Banana", 2, "Cherry", 3) returns a numeric code for the fruit in cell A1.
XLOOKUP XLOOKUP simplifies the process of searching for and retrieving data from a table or range. It can perform both horizontal and vertical lookups and handle multiple criteria elegantly. With its ability to return arrays, XLOOKUP is a powerful replacement for VLOOKUP and HLOOKUP.
Example:
=XLOOKUP("Apples", A1:A5, B1:B5) searches for "Apples" in column A and returns the corresponding value from column B.
UNIQUE and FILTER The UNIQUE and FILTER functions allow you to extract unique values from a range and filter data based on specific criteria without the need for complex array formulas. This is particularly useful when dealing with large datasets.
Example:
UNIQUE: =UNIQUE(A1:A10) returns a list of unique values from cells A1 to A10. FILTER: =FILTER(A1:B10, B1:B10 > 50) filters the data in range A1:B10 to include only rows where the value in column B is greater than 50.
SEQUENCE The SEQUENCE function simplifies the task of creating sequences of numbers or dates. You can generate a series of values with specific step sizes, starting points, and lengths, making it useful for generating row or column headers.
Example:
=SEQUENCE(5, 1, 10, 2) creates a sequence of 5 numbers starting from 10 with a step size of 2.
Excel's new formulas in 2019 have expanded the capabilities of this indispensable tool. Whether you're a financial analyst, a data scientist, or a casual user, these formulas can help you work more efficiently and effectively with your data. By incorporating CONCAT, TEXTJOIN, IFS, SWITCH, XLOOKUP, UNIQUE, FILTER, and SEQUENCE into your spreadsheet skills repertoire, you can take your Excel proficiency to the next level and unlock new possibilities for data analysis and manipulation.
For More Info:-
new excel formulas 2019
Advanced Excel Course Online Southern Africa
0 notes
Text
Unlocking the Power of SAP HANA: Key Features That Drive Real-Time Innovation

In today’s fast-moving business landscape, data is more than just information — it’s the foundation of smart decision-making and strategic growth. To keep up with growing data demands, businesses need a platform that can deliver speed, flexibility, and real-time insights. That’s where SAP HANA (High-Performance Analytic Appliance) shines.
SAP HANA is not just a high-speed database; it’s a full-fledged in-memory computing platform that combines transactional and analytical data processing in one system. With a wide range of innovative features, SAP HANA helps businesses modernize their IT infrastructure and unlock new opportunities through advanced analytics and real-time decision-making.
In this blog, we’ll explore the key features of SAP HANA training in Chandigarh and explain how they help organizations streamline operations, improve performance, and gain deeper insights from their data.
1. In-Memory Computing: The Engine Behind High Performance
At the heart of SAP HANA is its in-memory computing architecture. Unlike traditional databases that store data on disk and retrieve it when needed, SAP HANA stores data directly in RAM (Random Access Memory).
Why It Matters:
Storing data in memory drastically reduces the time it takes to read or write information. This means businesses can access their data almost instantly, even when performing complex queries or processing large datasets.
For example, a company running sales reports can generate real-time insights without waiting hours for data to load. This is a game-changer for industries where time-sensitive decisions are critical, such as finance, retail, or healthcare.
2. Columnar Storage: Optimized for Speed and Efficiency
Traditional relational databases use row-based storage, which is fine for transactional workloads but inefficient for analytical queries. SAP HANA, on the other hand, uses columnar storage, organizing data in columns instead of rows.
Key Benefits:
Faster Query Performance: Since only the relevant columns are accessed during a query, performance is significantly improved.
Better Data Compression: Similar data types stored in a column compress more effectively, reducing memory usage.
Efficient Aggregations: Calculations like sums and averages are processed faster in a columnar format.
3. Parallel Processing: Accelerated Workload Management
Speed isn’t just about memory — it’s also about how efficiently a system can process multiple tasks. SAP HANA leverages parallel processing to distribute tasks across multiple CPU cores and processors.
What This Means:
Multiple operations can run simultaneously, dramatically speeding up data processing. Whether you're loading data, running analytics, or executing complex calculations, parallel processing ensures SAP HANA can handle heavy workloads with ease.
For enterprises with high-volume transactions or real-time reporting needs, this feature helps maintain performance even during peak usage times.
4. Advanced Analytics: Turning Data into Actionable Intelligence
SAP HANA goes far beyond just storing and retrieving data. It includes built-in support for advanced analytics, enabling businesses to extract deeper insights directly from the database.
Included Analytical Tools:
Predictive Modeling: Use historical data to forecast future trends.
Machine Learning: Identify patterns and make intelligent recommendations.
Text Analysis: Extract meaning and sentiment from unstructured data such as emails, reviews, or social media.
Graph Processing: Analyze relationships and networks within data — ideal for fraud detection, social networking, or logistics.
5. Real-Time Data Processing: Insights Without Delay
With SAP HANA, you don’t have to wait for batch processing to get the latest data. Its architecture supports real-time data processing, meaning data is available for analysis as soon as it’s created.
Use Cases Include:
Live dashboards for monitoring operations.
Real-time alerts for critical business events.
Instant reporting for finance, sales, or supply chain metrics.
6. Unified Data Integration: A 360-Degree View of Your Business
Businesses often deal with data scattered across different systems — from ERPs and CRMs to spreadsheets and cloud services. SAP HANA supports data integration from a wide variety of sources, creating a unified view of the organization’s data landscape.
Benefits:
Eliminate data silos by bringing data together in one platform.
Simplify data management and ensure consistency.
Enable cross-functional analytics for better collaboration and decision-making.
7. Efficient Data Storage: Reduced Footprint, Lower Costs
Thanks to its columnar storage and advanced compression techniques, SAP HANA significantly reduces the amount of memory and disk space required to store data.
Why It Matters:
Lower storage costs.
Faster backups and recoveries.
Reduced infrastructure overhead.
Conclusion
SAP HANA brings together speed, intelligence, and real-time processing into one unified platform. Its innovative features — from in-memory computing and parallel processing to advanced analytics and data integration — empower businesses to work faster, make better decisions, and drive innovation.
Whether you’re running complex analytics, building intelligent applications, or transforming your enterprise systems, SAP HANA provides the scalable, high-performance foundation needed to succeed in a data-driven world.
If you're considering a move to SAP HANA or exploring how to make the most of its capabilities, now is the time to act. With the right strategy, SAP HANA can unlock game-changing value for your organization.
1 note
·
View note