#Data Analyst
Explore tagged Tumblr posts
Visit Tumblr Blog
Explore Tumblr blogs with no restrictions, modern design and the best experience.
Last Seen Tumblr Blogs


Fun Fact
69% of Tumblr users are millennials.
Text
American statistics enthusiasts RISE UP. These next few days aren’t going to be about the results of the election, they’re about watching our boy Kornacki go crazy in front of that touch screen in khakis. Blessed be this data analyst freak that they put on the national 24 hour news cycle. Godspeed Steve🫡

#America#kornacki#steve kornacki#election#2024 presidential election#2024#presidential debate#nbc#also he’s gay so that’s cool too I guess#khaki pants#khaki#data analyst#statistics#data#data analytics#election data#politics
14 notes
·
View notes
Text
The kind of insane thing about being a data analyst is that every company in the freaking world defines "data analyst" differently and sometimes has jobs that are data analytics jobs labeled as a completely different thing (I'm looking at you, Pinterest). Like, in my time as a data professional, I've done kind of generic data analytics work, but I've also performed data quality work (both finding and correcting data issues as well as improving and developing data capture and auditing processes and tools in order to reduce the number of corrections that are necessary in the first place), I've participated in developing data governance standards as both a SME and a data steward, and acted as the head of a data governance steering committee. The stuff I enjoy is actually the data quality/data governance stuff, but, depending on the company, these things might have their own titles or they might be lumped in under the "data analyst" title, and there is no way to actually know until you read through a job listing.
In other news, I will hopefully need a new job come October 1 (long story; who knows, maybe I'll tell it someday, but suffice it to say I have been waiting for this day since last October), so I've started to look for possible opportunities, and the whole job hunting process so far has been a bit of a slog because I never know if I will be wildly unqualified for a Senior Data Analyst position or not.
13 notes
·
View notes
Text
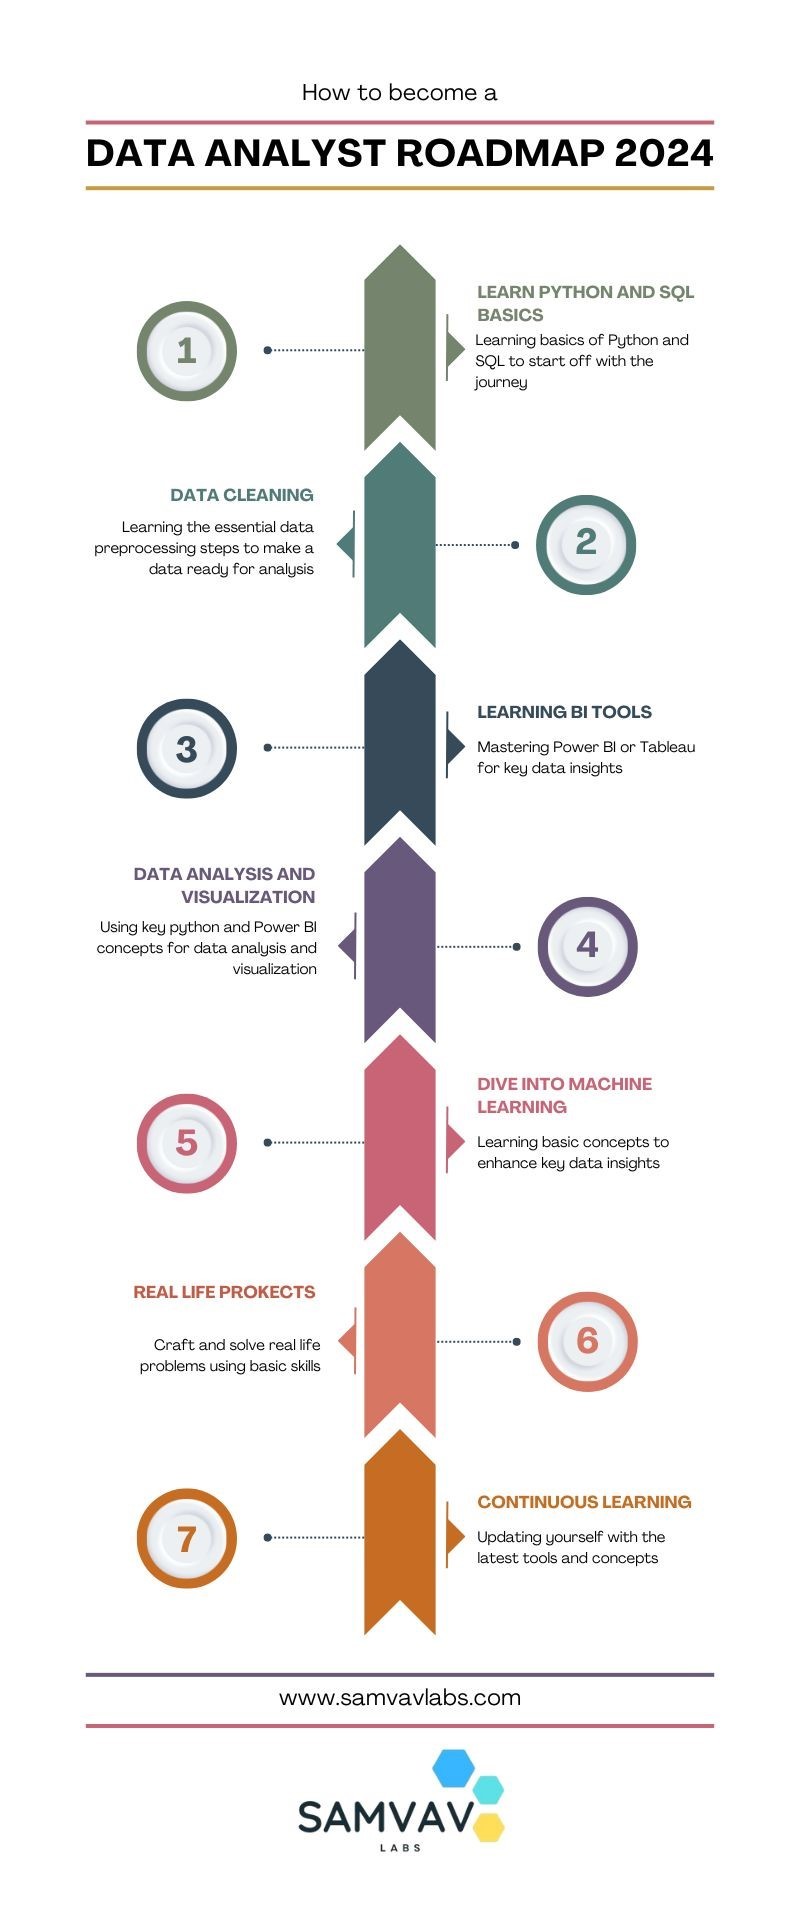
Data Analyst Roadmap for 2024!
Cracking the Data Analyst Roadmap for 2024! Kick off your journey by mastering and delving into Python for data manipulation magic, and dazzle stakeholders with insights using PowerBi or Tableau. Don't forget, that SQL proficiency and hands-on projects refine your skillset, but never overlook the importance of effective communication and problem-solving. Are you checking off these milestones on your path to success? 📌 For more details, visit our website: https://www.samvavlabs.com . . . #DataAnalyst2024 #CareerGrowth #roadmap #DataAnalyst #samvavlabs #roadmap2024 #dataanalystroadmap #datavisualization
#business analytics#data analytics#data analyst#machinelearning#data visualization#datascience#deep learning#data analyst training#dataanalystcourseinKolkata#data analyst certification#data analyst course#data science course#business analyst
11 notes
·
View notes
Text
High demand and high paying jobs.
2 notes
·
View notes
Text


3/13/2024 - Started my final semester of my computer science masters degree (I hope).
5 notes
·
View notes
Text
Unlock diverse career opportunities with a full-time Business Analytics course. Explore roles like Business Analyst, Data Analyst, Financial Analyst, Market Analyst, and Supply Chain Analyst. Elevate your skills and secure a rewarding future.
#globsyn business school#globsynbusinessschool#globsyn#gbs#gbs kolkata#gbskolkata#pgdm in business analytics#pgdm business analytics#business analytics#business analytics courses#full time business analytics#business analyst#data analyst#data analyst course#financial analyst#market analyst#supply chain analyst
3 notes
·
View notes
Text
Alright I'm Fine with the Hand shaped Cookie but not when its filled with Greek Salad like no! But hey its your creation...

#Neo-Cannolialist#Data Analyst#Trans#Trans?#Transgender#Non Gender Specifics#Twitter#X#Foods#Food Photo#Food Stuff#The Kings Hand#M&M's#M&M's Cookie#Greek Salad#Salad#Ughhhh#2020#Lockdown Period#Photo#Photograph#Live Action#Words#Just Words#Wikipedia#Wikipedia Entry
63K notes
·
View notes
Text
Data Visualization: Best Practices for Analysts
In the evolving landscape of data analytics, it’s not enough to simply analyze data—how you present it matters just as much. Data visualization serves as the link that connects complex data to meaningful, actionable insights. It empowers stakeholders to grasp patterns, detect trends, and make informed decisions swiftly. Whether in business, government, or academia, visualizing data effectively is a must-have skill for every analyst.
Why Data Visualization Matters
Raw data, no matter how comprehensive, is often difficult to interpret at first glance. This is where data visualization proves invaluable—converting spreadsheets into visual formats such as charts, graphs, and dashboards. When done effectively, it reveals insights that might otherwise stay buried within raw data.
Analysts use visual tools not just for aesthetics but to communicate findings clearly and concisely. In fast-paced work environments, decision-makers rely on visuals to quickly digest information and act accordingly. As a result, effective data visualization plays a crucial role in strategic communication.
Best Practices in Data Visualization
Know Your Audience Understanding your audience is the first step toward effective visualization. A dashboard for a CEO will look different from one meant for a data science team. Tailoring your visuals based on audience preferences and their level of technical expertise ensures relevance and clarity.
Choose the Right Chart Type Each dataset has a story, and it’s crucial to pick a visual that best tells it. Bar charts are ideal for comparing different categories, line graphs effectively illustrate trends over time, and pie charts—when used selectively—can highlight proportional relationships. A mismatched visual can confuse rather than clarify.
Simplify for Impact Cluttered visuals distract from the message. Remove unnecessary elements—avoid excessive colors, decorative effects, and complex labels. Clean and simple visuals allow your data to speak for itself. Use gridlines and axes thoughtfully, and highlight what truly matters.
Use Color Purposefully Color should enhance understanding, not overwhelm it. Use consistent palettes to categorize data and highlight key information. Ensure visual accessibility by choosing colorblind-friendly schemes and maintaining contrast for readability.
Tell a Story Visualization isn’t just about charts—it’s storytelling. Good visuals guide viewers through a narrative, leading them from the problem to the insight and finally to the solution. Titles, annotations, and data labels play a critical role in building this narrative.
Building Visualization Skills Through Structured Learning
While many visualization tools are user-friendly, mastering data storytelling requires structured training and practice. Analysts must look beyond just using tools and develop a solid understanding of design principles and effective communication techniques.
A strong foundation can be built through enrolling in one of the best data analyst courses in Dehradun. These programs often include in-depth training on tools like Tableau, Power BI, and Excel, along with modules that emphasize visualization theory, best practices, and real-world application.
Practical, hands-on training is vital for truly mastering the art of data visualization. It helps learners identify the right visuals for various scenarios, apply business logic, and think from the user’s perspective.
Offline Learning: A Local Advantage
Though online courses offer convenience, many learners benefit from offline, classroom-based training—especially when mastering creative and interactive skills like data visualization. Offline training allows for face-to-face mentorship, real-time problem-solving, and collaborative group activities.
Choosing a data analyst institute offline in Dehradun can provide learners with a practical learning environment. These sessions often include group projects, case studies, and exposure to real business data—bridging the gap between theory and practice.
Offline classes also offer a structured approach to learning, ideal for those who prefer discipline and direct guidance over self-paced study.
DataMites Institute: A Trusted Name in Data Analytics Education
Among the most recognized training providers in India is DataMites, known for its commitment to excellence in analytics education.
Recognized by IABAC and NASSCOM FutureSkills, DataMites Institute courses are structured to align with international industry benchmarks. Students benefit from expert mentorship, practical project experience, internship opportunities, and robust placement support.
DataMites Institute also offers offline classroom training in key cities such as Mumbai, Pune, Hyderabad, Chennai, Delhi, Coimbatore, and Ahmedabad—ensuring flexible learning options across India. For those located in Pune, DataMites Institute offers an excellent opportunity to gain expertise in Python and succeed in today’s highly competitive tech landscape.
What truly sets DataMites Institute apart is its practical approach to skill-building. The curriculum is designed to make learners job-ready, with strong focus areas including data visualization, analytics tools, and real-time business applications. For students in Dehradun, DataMites Institute offers online programs that blend flexibility with live mentorship and practical training, making it a top choice among the best data analyst courses in Dehradun.
Effective data visualization blends creativity with analytical precision, making it an essential skill for anyone aiming to thrive in the field of analytics. By applying best practices and investing in the right training, analysts can turn complex data into compelling stories that drive impact. For learners in Dehradun, the path to mastering visualization starts with quality education, and institutes like DataMites are paving the way with comprehensive, real-world training experiences.
0 notes
Text
Data Analyst / Business Intelligence Analyst (Lagos – Full‑Time)
Company: PalmPay Limited Location: Lagos, Nigeria Employment Type: Full‑Time, Mid‑Senior Level Experience: 3+ years (Fintech preferred) 📊 Key Responsibilities Collect, clean & manage data from banking & mobile platforms. Analyze customer behavior, loan performance, deposits & risk trends. Build/maintain daily, weekly & monthly dashboards. Deliver insights to support credit, product & marketing…
0 notes
Text
Just finished the 4th course for my data analyst certificate! Halfway done with it now!
3 notes
·
View notes
Text
So, I've been a data analyst for like five years and I'm currently working on a degree in data analytics which is...a mixed bag as far as experiences go, but once I get the piece of paper saying I went to school for a thing I already do, they have to give me more money (and my company is paying for most of it), so I'm doing the thing. Anyway, I am currently working on this project for a data quality and validation class, which is quite literally my job, and it is driving me insane.
The project is all about cleaning data to prepare it to be loaded into an existing system due to a company merger, something I happen to be uniquely qualified to do due to personal experience -- more so than even many of my colleagues. That's all fine and good. Except the "existing system", which is straight-up referred to as a "database", is just another tab on the Excel spreadsheet, and nowhere have I seen the clarification "look, we're doing it this way because it's easily accessible, but in no universe should you store a database's worth of information on a spreadsheet, nor is this tab actually a database."
And considering how many "databases" people like to keep on spreadsheets much to the chagrin of every data professional in existence, I just want to talk to whoever wrote this curriculum.
24 notes
·
View notes
Text
Data Analyst Interview Questions: A Comprehensive Guide
Preparing for an interview as a Data Analyst is difficult, given the broad skills needed. Technical skill, business knowledge, and problem-solving abilities are assessed by interviewers in a variety of ways. This guide will assist you in grasping the kind of questions that will be asked and how to answer them.

By mohammed hassan on Pixabay
General Data Analyst Interview Questions
These questions help interviewers assess your understanding of the role and your basic approach to data analysis.
Can you describe what a Data Analyst does? A Data Analyst collects, processes, and analyzes data to help businesses make data-driven decisions and identify trends or patterns.
What are the key responsibilities of a Data Analyst? Responsibilities include data collection, data cleaning, exploratory data analysis, reporting insights, and collaborating with stakeholders.
What tools are you most familiar with? Say tools like Excel, SQL, Python, Tableau, Power BI, and describe how you have used them in past projects.
What types of data? Describe structured, semi-structured, and unstructured data using examples such as databases, JSON files, and pictures or videos.
Technical Data Analyst Interview Questions
Technical questions evaluate your tool knowledge, techniques, and your ability to manipulate and interpret data.
What is the difference between SQL's inner join and left join? The inner join gives only the common rows between tables, whereas a left join gives all rows of the left table as well as corresponding ones of the right.
How do you deal with missing data in a dataset? Methods are either removing rows, mean/median imputation, or forward-fill/backward-fill depending on context and proportion of missing data.
Can you describe normalization and why it's significant? Normalization minimizes data redundancy and enhances data integrity by structuring data effectively between relational tables.
What are some Python libraries that are frequently used for data analysis? Libraries consist of Pandas for data manipulation, NumPy for numerical computations, Matplotlib/Seaborn for data plotting, and SciPy for scientific computing.
How would you construct a query to discover duplicate values within a table? Use a GROUP BY clause with a HAVING COUNT(*) > 1 to find duplicate records according to one or more columns.
Behavioral and Situational Data Analyst Interview Questions
These assess your soft skills, work values, and how you deal with actual situations.
Describe an instance where you managed a challenging stakeholder. Describe how you actively listened, recognized their requirements, and provided insights that supported business objectives despite issues with communication.
Tell us about a project in which you needed to analyze large datasets. Describe how you broke the dataset down into manageable pieces, what tools you used, and what you learned from the analysis.
Read More....
0 notes
Text
What is the role of a data analyst in a company?

In today’s data-driven world, companies are flooded with information. But raw data alone doesn’t help. It needs to be cleaned, organized, and understood.
That’s where a data analyst steps in. Many people hear the term “data analyst” and imagine someone crunching numbers all day. While numbers are part of the job, the role of a data analyst training goes far beyond spreadsheets. They turn data into clear, actionable insights that help companies make better decisions.
This article explores the role of a data analyst in a company, common challenges businesses face without one, and how data analysts solve real business problems.
Understanding the Basics of a Data Analyst's Role
A data analyst is responsible for collecting, organizing, analyzing, and interpreting data. Their main goal is to help a company make informed decisions by identifying trends, patterns, and problems. They often work closely with departments like marketing, sales, finance, and operations to help guide strategies.
Key Responsibilities
Data Collection: Gathering data from internal systems like sales databases or external sources such as customer surveys.
Data Cleaning: Removing errors, duplicates, or irrelevant data to ensure accurate analysis.
Data Analysis: Applying statistical methods or using software tools to draw insights.
Reporting: Presenting findings through dashboards, graphs, or written summaries.
Decision Support: Recommending strategies based on data-driven insights.
Why Companies Need Data Analysts
Without data analysis, businesses are often operating in the dark. They might rely on assumptions, outdated trends, or gut feelings to make decisions. This approach can be risky, especially in competitive markets.
For example, a retail company may notice a drop in sales but not know why. A data analyst would look at customer feedback, transaction data, and competitor trends to pinpoint the cause—whether it's pricing, product quality, or market shifts.
Real-World Scenario
Imagine an e-commerce company launching a new product line. The marketing team runs multiple ad campaigns but doesn’t know which ones perform best. A data analyst evaluates ad performance metrics—click-through rates, conversions, bounce rates—and identifies the most successful campaigns. This allows the company to focus its budget where it gets the best returns.
Common Problems Businesses Face Without Data Analysts
1. Poor Decision-Making
Businesses may make critical choices based on assumptions. For example, launching a product in a new market without understanding customer needs can result in losses.
2. Wasted Resources
Without data-backed planning, marketing and sales budgets can be misallocated. Companies may spend heavily on the wrong strategies or audiences.
3. Missed Opportunities
Trends often emerge from subtle shifts in data. Without someone monitoring these patterns, companies can miss opportunities for growth or innovation.
How Data Analysts Solve These Problems
1. Turning Raw Data Into Actionable Insights
Instead of giving managers complex spreadsheets, data analysts summarize key insights that directly answer business questions. For instance, “Which region had the highest sales last quarter and why?”
2. Predicting Trends and Customer Behavior
Using historical data, analysts can help predict future patterns. For example, an analyst might discover that customers tend to buy winter clothing two months earlier in colder regions—information that can guide inventory and marketing plans.
3. Optimizing Operations
From reducing delivery delays to lowering production costs, data analysts study process performance. Their findings can streamline operations and improve efficiency.
Skills and Tools a Data Analyst Uses
While the job doesn’t always require coding or advanced math, data analysts typically use a few key tools:
Spreadsheets (e.g., Excel): For basic data handling.
SQL (Structured Query Language): To retrieve data from databases.
Data Visualization Tools (e.g., Tableau, Power BI): For creating easy-to-understand dashboards.
Statistical Tools (e.g., Python, R): For more complex analyses.
They also need strong communication skills to explain technical findings to non-technical teams.
How Data Analysts Support Different Departments
Marketing
They help track campaign performance, understand customer segments, and determine which products perform well in which markets.
Sales
Data analysts can identify high-value customers, sales patterns, and seasonal buying behavior to help set realistic sales targets.
Finance
They assist in budgeting, forecasting, and identifying financial risks or irregularities.
HR
Analysts can study employee turnover, satisfaction surveys, and hiring trends to improve workplace policies.
Antithesis: Is Data Analysis Always Necessary?
Some argue that experience and industry intuition should drive decisions. While intuition is valuable, it can be biased. Data supports or challenges assumptions with evidence. However, relying solely on data without context can also mislead. For instance, a spike in website traffic may look good, but if it's due to accidental clicks or bots, it has no real value.
The best approach is a balance—pairing human judgment with data analysis.
The Evolution of the Role
The data analyst role is evolving. In the past, analysts were mainly seen as report creators. Today, they are strategic partners in planning and growth. Many companies now involve analysts early in the decision-making process, not just after-the-fact reporting.
Additionally, the lines between data analysts, data scientists, and business analysts are blurring. While data scientists focus more on advanced machine learning and predictions, data analysts specialize in understanding past and present trends to inform future decisions.
How to Work Effectively with a Data Analyst
For companies to benefit fully, team collaboration is key. Business leaders should:
Clearly define goals and questions they want answered.
Ensure data analysts have access to quality, up-to-date data.
Include analysts in strategy discussions, not just post-analysis.
Meanwhile, data analysts should communicate clearly, use visuals effectively, and align their work with business objectives.
Conclusion
The role of a data analyst in a company is more than just number-crunching—it’s about storytelling with data, solving problems, and enabling smarter decisions. By transforming raw data into meaningful insights, data analysts play a vital role in the success and growth of a business.
In an era where competition is tight and margins are narrow, data analysts help ensure that every decision is informed, strategic, and effective.
0 notes
Text

Join a Data Analyst course in Delhi and become job ready in 6 months. Learn data tools and real skills to secure your future. A job assured program designed to help you grow in your career with confidence.
0 notes
Text
I was laid off in January from my job as a data analyst. I just finished my portfolio and I'm so excited!
0 notes
Text
📊 𝐆𝐥𝐨𝐛𝐚𝐥 𝐃𝐚𝐭𝐚 𝐀𝐧𝐚𝐥𝐲𝐭𝐢𝐜𝐬 𝐌𝐚𝐫𝐤𝐞𝐭: 𝐏𝐨𝐰𝐞𝐫𝐢𝐧𝐠 𝐭𝐡𝐞 𝐍𝐞𝐱𝐭 𝐄𝐫𝐚 𝐨𝐟 𝐃𝐞𝐜𝐢𝐬𝐢𝐨𝐧-𝐌𝐚𝐤𝐢𝐧𝐠 🌐
Market Size and Overview:
In 2024, the global data analytics market surged past USD 64.9 billion, driven by over 70% of enterprises adopting analytics for smarter decision-making. With 60% of workloads shifting to cloud-based platforms and 55%+ enterprises integrating AI and ML, businesses are reporting up to 25% operational cost savings and 18–22% revenue lift from data-backed strategies. The healthcare, BFSI, and retail sectors are leading adoption in 2025, seeking real-time insights, predictive forecasting, and customer personalization. This report unpacks ROI-impacting metrics—pricing, segmentation, AI integration, regional opportunities, and market entry strategies—making it a must-have for stakeholders ready to act now.
➡️ 𝐃𝐨𝐰𝐧𝐥𝐨𝐚𝐝 𝐒𝐚𝐦𝐩𝐥𝐞: @ https://tinyurl.com/49tvdr78
The Data Analytics market has emerged as a critical pillar of digital transformation across industries, empowering organizations to make faster, smarter, and data-driven decisions. With the exponential growth of structured and unstructured data generated from various sources such as IoT devices, social media, business operations, and cloud applications, the need for advanced analytics tools has never been greater. Data analytics solutions are enabling businesses to extract valuable insights, forecast trends, understand customer behavior, and enhance operational efficiency. From healthcare and finance to retail and manufacturing, enterprises are adopting analytics platforms powered by artificial intelligence (AI), machine learning (ML), and big data technologies to stay competitive in a rapidly evolving digital economy.
Key Market Insights:
The adoption of data analytics tools has surged globally, with over 70% of organizations now using analytics to support business decision-making. Companies across industries are increasingly relying on data insights to improve operational efficiency, reduce costs, and drive innovation. This shift reflects a growing awareness of the competitive advantage that data-driven strategies provide in today’s fast-paced business environment.
Cloud-based analytics solutions are gaining strong momentum, with more than 60% of analytics workloads now being processed on cloud platforms. The flexibility, scalability, and cost-effectiveness of cloud environments make them ideal for handling large volumes of data and enabling real-time insights. Organizations are moving away from legacy systems to adopt cloud-native analytics tools that support remote access and integration with other cloud applications.
Artificial intelligence and machine learning are becoming integral to modern data analytics, with over 55% of enterprises integrating AI-driven analytics for predictive modeling and automation. These technologies enhance the accuracy and speed of data interpretation, allowing businesses to anticipate trends, personalize customer experiences, and automate complex decision-making processes.
Data Analytics Market Drivers:
The exponential growth of data generation is pushing organizations to adopt analytics solutions
In today’s digital economy, businesses are generating vast volumes of structured and unstructured data from diverse sources such as IoT devices, e-commerce platforms, CRM systems, social media, and mobile applications. This explosion of data has created a pressing need for tools that can collect, manage, and analyze it efficiently. Data analytics solutions empower organizations to convert raw data into actionable insights, enabling better forecasting, resource optimization, and faster decision-making, which are essential for maintaining a competitive edge in any industry.
The rising demand for real-time decision-making is accelerating the use of advanced analytics
Modern enterprises operate in highly dynamic environments where real-time decisions can make or break business outcomes. Data analytics platforms with real-time processing capabilities help monitor ongoing operations, detect anomalies instantly, and respond proactively. From fraud detection in financial services to demand forecasting in retail, real-time analytics is becoming a crucial enabler of agility and responsiveness, allowing organizations to react to changes as they happen.
The integration of artificial intelligence and machine learning is enhancing analytics capabilities
AI and ML are transforming the data analytics landscape by enabling systems to learn from data patterns and improve over time without explicit programming. These technologies enhance predictive and prescriptive analytics, uncover hidden patterns, and automate routine tasks, thereby saving time and reducing errors. Their integration into analytics platforms is helping businesses achieve smarter automation, targeted marketing, and deeper customer understanding with minimal human intervention.
The growing emphasis on personalized customer experiences is fueling analytics adoption
Customer-centric strategies have become a top priority for businesses looking to increase retention and loyalty. Data analytics allows companies to understand customer behavior, preferences, and feedback at a granular level. By leveraging these insights, businesses can personalize offers, optimize user journeys, and improve customer satisfaction. In sectors such as e-commerce, healthcare, and banking, the ability to deliver tailored experiences through data insights is becoming a vital driver of growth and innovation.
➡️ 𝐁𝐮𝐲 𝐍𝐨𝐰 @ https://tinyurl.com/5e2ufcys
Data Analytics Market Restraints and Challenges:
Data privacy concerns and skill shortages remain key restraints in the analytics market
Despite the rising adoption of data analytics, several challenges continue to hinder its full potential. One of the primary concerns is data privacy and regulatory compliance, as organizations must ensure that sensitive information is securely handled and aligned with frameworks such as GDPR and HIPAA. Additionally, the shortage of skilled professionals with expertise in data science, AI, and machine learning remains a major barrier. Many companies struggle to hire and retain talent capable of extracting meaningful insights from complex datasets. Integration complexities, high implementation costs, and data quality issues further complicate analytics deployments, particularly for small and mid-sized enterprises.
Data Analytics Market Opportunities:
The data analytics market presents significant opportunities driven by the growing adoption of advanced technologies such as AI, machine learning, and big data across industries. As businesses increasingly seek to harness the power of data for competitive advantage, there's a growing demand for user-friendly, scalable analytics platforms that offer real-time insights and predictive capabilities. Emerging markets are also witnessing a surge in digital transformation efforts, opening new avenues for analytics providers. Additionally, the integration of analytics with IoT, edge computing, and cloud services offers innovative use cases in sectors like healthcare, manufacturing, retail, and finance, creating a fertile ground for growth and differentiation.
Data Analytics Market Segmentation:
Market Segmentation: By Component:
o Software Data Management Tools Data Mining & Machine Learning Tools Data Visualization Tools Predictive and Prescriptive Analytics Platforms Business Intelligence Platforms Others (ETL, Data Preparation Tools) o Services Managed Services Professional Services Consulting Deployment & Integration Support & Maintenance
The software segment in the data analytics market is dominated by a variety of tools aimed at enhancing data management and analysis. Among these, data management tools are essential for structuring and organizing vast volumes of data to ensure its integrity. Data mining and machine learning tools play a crucial role in uncovering patterns and insights from complex datasets, helping organizations make informed decisions. Data visualization tools make it easier to interpret and communicate data insights, while predictive and prescriptive analytics platforms enable businesses to forecast trends and optimize strategies. Business intelligence platforms are key for turning raw data into actionable insights, allowing decision-makers to make timely and accurate business choices.
The services segment of the market is also expanding, with companies seeking expert help for various analytics needs. Managed services are essential for organizations that want to outsource the ongoing operation and optimization of their analytics systems. Professional services such as consulting, deployment & integration, and support & maintenance are critical to ensure smooth and efficient analytics implementation. With the growing complexity of data ecosystems, businesses are increasingly relying on specialized service providers to manage data integration and system maintenance, making this segment a significant driver of market growth.
Market Segmentation: By Deployment Mode:
o On-Premises o Cloud Public Cloud Private Cloud Hybrid Cloud
The deployment mode of data analytics solutions plays a key role in how organizations manage and access their data. On-premises deployment is traditionally preferred by companies that require complete control over their infrastructure and data security. This mode is often used by enterprises with strict compliance or regulatory requirements, as it allows for a more hands-on approach to managing sensitive data.
On the other hand, cloud deployment has been gaining traction due to its flexibility, scalability, and cost-effectiveness. The public cloud option enables businesses to leverage shared infrastructure, reducing costs and complexity. Leading cloud providers offer powerful analytics solutions on these platforms, enabling companies to access real-time insights from anywhere. Private cloud solutions offer more security and control, as the infrastructure is dedicated to a single organization, making it suitable for enterprises that need a higher level of privacy and data protection. Finally, hybrid cloud solutions combine the benefits of both public and private clouds, allowing businesses to store sensitive data on private servers while leveraging public cloud resources for scalability and cost efficiency.
Market Segmentation: By Analytics Type:
o Descriptive Analytics o Diagnostic Analytics o Predictive Analytics o Prescriptive Analytics
The analytics type segment in the data analytics market consists of several key categories, each focusing on a different aspect of data analysis. Descriptive analytics is the foundation of data analysis, summarizing historical data to identify trends, patterns, and key metrics. It provides insights into what has happened in the past, offering businesses a clear view of past performance and outcomes. Building on this, diagnostic analytics takes a deeper dive to understand the reasons behind observed trends and events. By uncovering the root causes of specific patterns or anomalies, diagnostic analytics helps organizations improve their decision-making and address underlying issues.
Moving into more advanced analytics, predictive analytics leverages historical data and machine learning techniques to forecast future trends and behaviors, allowing organizations to anticipate outcomes and make data-driven predictions. It is particularly useful in areas such as customer behavior analysis and demand forecasting. The most advanced form of analytics, prescriptive analytics, goes beyond prediction by offering actionable recommendations based on the forecasted results. It suggests the best courses of action to achieve optimal outcomes, optimizing business processes and driving more effective strategic decisions.
Market Segmentation: By Organization Size:
o Small and Medium-sized Enterprises (SMEs) o Large Enterprises
The organization size segment in the data analytics market is categorized into small and medium-sized enterprises (SMEs) and large enterprises, each with distinct needs and capabilities when it comes to data analytics adoption. SMEs are increasingly leveraging data analytics tools to enhance operational efficiency, gain competitive insights, and make data-driven decisions without the extensive resources of larger companies. As technology becomes more affordable and user-friendly, SMEs are adopting cloud-based analytics solutions that offer scalability and flexibility without the need for significant upfront investments.
On the other hand, large enterprises typically have more complex data ecosystems and require more sophisticated analytics capabilities. With significant resources at their disposal, large organizations invest in advanced data analytics tools and infrastructure to gain deeper insights into their operations, supply chains, and customer behaviors. These enterprises often adopt on-premises or hybrid cloud analytics solutions to handle large volumes of data while maintaining greater control over data security and compliance. The need for real-time insights, predictive analytics, and advanced decision-making models drives large enterprises to seek out tailored solutions that can scale and integrate with their existing enterprise systems.
➡️ Enquire Before Buying @ https://tinyurl.com/shnewewm
Market Segmentation: By End-Use Application:
o Banking, Financial Services, and Insurance (BFSI) Risk Management Fraud Detection Customer Analytics o Retail and E-commerce Customer Behavior Analysis Inventory and Supply Chain Optimization o Healthcare and Life Sciences Clinical Data Analysis Patient Management Analytics o Manufacturing Predictive Maintenance Process Optimization o Transportation and Logistics Fleet Management Analytics Route Optimization o Energy and Utilities Smart Grid Analytics Consumption Forecasting o Government and Public Sector Public Safety Analytics Citizen Service Analytics o IT and Telecom Network Optimization Analytics Customer Churn Analytics o Media and Entertainment Audience Analytics Content Recommendation Analytics o Education Learning Analytics Institutional Performance Analytics o Others (Hospitality, Real Estate, Agriculture, etc.)
In the data analytics market, the dominant end-use application is in the banking, financial services, and insurance (BFSI) sector. Analytics plays a crucial role in risk management, where financial institutions analyze vast amounts of data to identify potential risks and prevent financial crises. Fraud detection also heavily relies on data analytics, with advanced algorithms that can detect irregular transactions in real-time, preventing significant losses. Additionally, customer analytics enables BFSI companies to better understand customer needs and preferences, allowing them to personalize services and strengthen customer loyalty. Given the constant need for security, efficiency, and customer satisfaction in BFSI, it remains the dominant sector in terms of analytics adoption.
The fastest-growing end-use application is in the healthcare and life sciences sector. This industry is rapidly adopting data analytics for clinical data analysis, where healthcare providers can extract insights from vast medical records to improve treatment plans and patient outcomes. Patient management analytics is also growing fast, with solutions that help in optimizing patient care and streamlining hospital operations. As the healthcare sector becomes more data-driven, with the rise of digital health records, wearable devices, and AI-powered diagnostics, the need for data analytics solutions is increasing at an impressive rate. The ability to improve efficiency, reduce costs, and enhance patient care makes healthcare one of the fastest-growing applications for data analytics in the market.
Market Segmentation: Regional Analysis:
• North America • Asia-Pacific • Europe • South America • Middle East and Africa
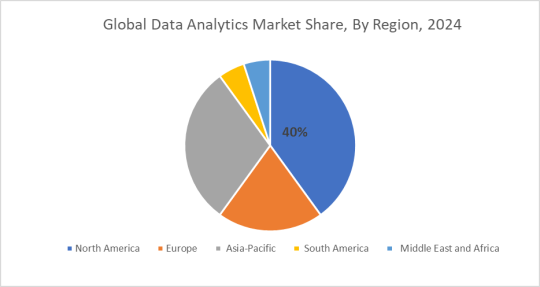
The dominant region in the data analytics market is North America, accounting for a significant share of 40%. This dominance is fueled by the high concentration of technology companies, strong digital infrastructure, and widespread adoption of data analytics across diverse industries, including banking, financial services, healthcare, and retail. North America’s focus on data-driven decision-making, coupled with significant investments in artificial intelligence and machine learning, continues to position the region as the leader in the global data analytics market.
The fastest-growing region is Asia-Pacific, contributing 30% to the market. This region is experiencing rapid growth due to its accelerating digital transformation efforts. Countries like China, India, and Japan are investing heavily in data analytics technologies to enhance business operations, improve customer experiences, and optimize supply chains. The growth in sectors like manufacturing, e-commerce, and government initiatives, along with an increasing focus on smart cities and smart infrastructure, is driving the adoption of data analytics at an impressive rate in Asia-Pacific.
0 notes