#Head and Shoulders Chart Pattern in Technical Analysis
Explore tagged Tumblr posts
Visit Tumblr Blog
Explore Tumblr blogs with no restrictions, modern design and the best experience.
Last Seen Tumblr Blogs


Fun Fact
When “GIF” was named word of the year in 2012, Oxford Dictionaries U.S.A. credited Tumblr for pushing the word.
Text
Head and Shoulders Chart Pattern in Stock Trading

The Head and Shoulders pattern is a chart formation that often signals a reversal in the trend of a financial asset like stocks, commodities, or currencies. Traders use this pattern to spot when a market is about to shift from an upward trend to a downward trend (or vice versa), making it an essential tool for both beginners and experienced investors. This pattern has three peaks with the centre peak shaped like a ‘head’ supported by the two ‘shoulders’ or smaller peaks on either side which gives the pattern its name.
Read Full Blog Post: Head and Shoulders Pattern in Technical Analysis
#Head and Shoulders Chart Pattern in Technical Analysis#How to Trade using Head and Shoulders Pattern#Different Types of Head and Shoulders Pattern#Head And Shoulders Pattern In Stock Trading#Inverse head and shoulders pattern
0 notes
Video
youtube
Trade Like a Pro Unleashing the Profiteadeveloper Price Action Edge
#youtube#Price Action Analysis Strategy#Head and Shoulder Pattern#Trading Strategy#Price Charts#Price Charts Market Trends#Entry and Exit Points#Risk Management#Profit Maximization#Technical Analysis forex#forextrading
0 notes
Text
Forex Trading
Forex trading, or foreign exchange trading, involves buying and selling currencies to profit from changes in exchange rates. Here’s a detailed guide to get you started:
1. Understanding Forex Trading
Currency Pairs: Forex trading always involves trading one currency for another. Currencies are quoted in pairs (e.g., EUR/USD, GBP/JPY). The first currency is the base currency, and the second is the quote currency.
Pips: The smallest unit of movement in a currency pair’s exchange rate. For most pairs, a pip is 0.0001.
Leverage: Allows you to control a large position with a relatively small amount of money. While leverage can amplify profits, it also increases risk.
2. Setting Up Your Forex Trading
Choose a Reliable Broker: Select a forex broker that offers a user-friendly trading platform, competitive spreads, and good customer service. Look for brokers with a solid reputation and proper regulatory oversight (e.g., regulated by the Financial Conduct Authority (FCA) or the Commodity Futures Trading Commission (CFTC)).
Open a Trading Account: After selecting a broker, open a trading account. Many brokers offer demo accounts where you can practice trading without real money.
Deposit Funds: Fund your trading account with an amount you’re comfortable with. Remember, forex trading can be risky, so only invest money you can afford to lose.
3. Develop a Trading Strategy
Technical Analysis: Uses historical price data and charts to forecast future price movements. Key tools include indicators (like Moving Averages, RSI, MACD) and chart patterns (like head and shoulders, flags).
Fundamental Analysis: Involves analyzing economic indicators, news events, and other factors that might impact currency values. Key indicators include GDP, interest rates, inflation, and employment data.
Risk Management: Set stop-loss and take-profit orders to manage risk and protect your capital. Determine how much you’re willing to risk on each trade.
4. Executing Trades
Place Orders: Use your broker’s trading platform to place trades. You can choose from various order types, such as market orders, limit orders, and stop orders.
Monitor and Adjust: Keep track of your trades and the market conditions. Adjust your strategies and positions as needed based on market movements and your trading plan.
5. Continuous Learning and Improvement
Stay Informed: Follow financial news, economic reports, and market analyses to stay up-to-date with factors affecting currency markets.
Review and Reflect: Regularly review your trades to understand what worked and what didn’t. Learning from past trades helps improve your strategy.
Adapt: Forex markets are dynamic and can change quickly. Be ready to adapt your strategies to new market conditions.
6. Avoiding Common Pitfalls
Overleveraging: Using high leverage can lead to significant losses. Start with lower leverage until you gain more experience.
Emotional Trading: Avoid making decisions based on emotions. Stick to your trading plan and strategy.
Lack of Research: Ensure you conduct thorough research and analysis before making trading decisions.
Resources for Learning Forex Trading
Books: “Trading in the Zone” by Mark Douglas, “Currency Trading for Dummies” by Brian Dolan and Kathleen Brooks.
Online Courses: Platforms like Coursera, Udemy, and Babypips offer courses on forex trading.
Websites: Follow financial news on websites like Bloomberg, CNBC, and Reuters.
business, forex, art, usbiz, usa art, fine art, trading, forex trading
12 notes
·
View notes
Text
Chart Chaser: A Trader’s Obsession with Technical Analysis on MintCFD

In the realm of online trading, a “Chart Chaser” is a trader who relies heavily on technical analysis. These traders obsessively study charts, patterns, and indicators to identify the optimal entry and exit points for their trades. While some traders focus on market news or economic fundamentals, Chart Chasers believe that the key insights lie within the patterns and trends shown in the data itself. For users on MintCFD, adopting the Chart Chaser approach can be rewarding, especially given the wide range of tools and various trading chart patterns available on the platform.
The Allure of Following Trends in Charts
Chart Chasers are drawn to technical analysis because it offers a visual and data-driven way to understand market behavior. By studying price movements, volume, and indicators, they look for recurring patterns, such as Double Bottoms, Head and Shoulders, and Moving Averages, which they believe can predict future price action. With the MintCFD trading app, traders have access to advanced charting tools that make it easy to become a Chart Chaser, allowing for in-depth analysis and strategy development.
Key Tools on the MintCFD Platform for Chart Chasers
MintCFD’s platform is rich with tools tailored for those who take a technical approach. Here are some essentials for the dedicated Chart Chaser:
Real-Time Charting Tools: MintCFD offers detailed, real-time charts that provide instant insights into price movements. For a Chart Chaser, these charts are invaluable as they capture every shift and trend in the market, allowing them to act quickly based on the latest data.
Diverse Chart Patterns: From Candlestick charts to Line charts, MintCFD provides several options, enabling traders to switch between patterns based on their trading style. For instance, Candlestick patterns are often favored by Chart Chasers because they reveal price action in detail, helping traders identify trends and reversals.
Technical Indicators: Popular indicators, such as the RSI (Relative Strength Index), MACD (Moving Average Convergence Divergence), and Bollinger Bands, are available on MintCFD to help Chart Chasers confirm their hypotheses. These indicators can signal overbought or oversold conditions, momentum changes, and potential trend reversals.
Custom Alerts: MintCFD’s alert system lets Chart Chasers set notifications based on specific price movements, helping them act on technical signals even if they’re not actively monitoring their screens. This way, they never miss a crucial trade opportunity based on their analysis.
Benefits and Pitfalls of Being a Chart Chaser
For those who love data, becoming a Chart Chaser offers unique advantages, but it also comes with some potential pitfalls. Here’s how to manage both on the MintCFD Platform:
Benefits: Technical analysis is highly data-driven, meaning decisions are based on objective data rather than emotional responses. By relying on chart patterns and indicators, Chart Chasers can create highly structured strategies with specific entry and exit points. With MintCFD’s intuitive tools, they can continuously refine their methods and explore different indicators.
Pitfalls: Focusing solely on technical analysis can lead to “analysis paralysis,” where a trader over-analyzes and hesitates to act. Additionally, ignoring market news and economic factors may leave a Chart Chaser blind to important influences. MintCFD offers market news and insights alongside technical tools, helping Chart Chasers balance their analysis with a broader context.
Master the Market on MintCFD Trading App: Stop Over-Analyzing and Start Thriving as a Chart Chaser
To succeed as a Chart Chaser without getting caught in a loop of over-analysis, it’s essential to have a plan and set clear criteria for entering and exiting trades. MintCFD’s watchlists and alert systems can help keep track of multiple assets without overwhelming yourself with constant analysis. Having a set of “go-to” indicators and patterns also helps prevent information overload.
Final Thoughts
For traders who thrive on technical data, becoming a Chart Chaser can be an exciting and rewarding journey. MintCFD is an ideal platform for these traders, with its robust charting tools, real-time indicators, and customizable alerts. While it’s easy to get caught up in the details, the best Chart Chasers know when to step back and trust their analysis. By balancing data with a disciplined approach, MintCFD users can make the most of their technical strategies and succeed in the dynamic world of trading.
Take control of your trading journey with the MintCFD Trading App
#mintcfd#cfdtrading#cryptotrading#onlinetrading#tradingstrategy#tradingsignals#forextrading#forexstrategies#cryptoinvesting#stockmarket
2 notes
·
View notes
Text
Some common techniques and concepts used in technical analysis.

Trend analysis: Identifying the direction of the overall market or a specific stock's price trend, such as uptrend, downtrend, or sideways movement.
Support and resistance levels: Levels where the price tends to find support or encounter resistance, indicating potential buying or selling opportunities.
Chart patterns: Recognizing specific patterns on price charts, such as head and shoulders, double tops/bottoms, triangles, and flags, which may indicate future price movements.
Moving averages: Calculating and analyzing average prices over a specific period of time to identify trend reversals or confirm existing trends.
Oscillators: Indicators that oscillate between certain levels to identify overbought or oversold conditions, helping traders determine when a price may be due for a reversal.
It's important to note that technical analysis is subjective, and different analysts may interpret the same data differently. Critics argue that technical analysis relies on historical data and patterns, which may not always be reliable indicators of future price movements. Therefore, it is often used in conjunction with fundamental analysis, which focuses on the underlying financials and prospects of a company.
Visit for more Stock Market news And Article.
3 notes
·
View notes
Text
Master Technical Analysis Chart Patterns: Spot Trades Before They Happen
Understanding technical analysis chart patterns is key to predicting market moves with precision. This course is designed to help traders recognize high-probability setups using patterns like Head & Shoulders, Double Tops, Flags, and Triangles. Ideal for anyone looking to boost accuracy in entries and exits.
Key Highlights:
Learn top reversal and continuation patterns
Real-market examples with live charts
Build confidence in trade timing and direction
Suitable for intraday, swing, and positional traders
🔴 Decode price action—Learn chart patterns and trade like a pro today! 🔴
0 notes
Text
5 Best Technical Analysis Course Online in India
Technical analysis is one of the most effective methods traders use to predict future price movements by analyzing past market data, primarily price and volume. The stock market’s complexities can be unraveled with the right knowledge and tools. This article highlights the 5 best technical analysis courses online in India, focusing on key aspects like Dow Theory in technical analysis, Nifty technical analysis, chart patterns, and the fundamental vs. technical analysis debate.
We’ll also explore how ISMT Institute of Stock Market Training excels in providing top-notch in technical analysis course.
About Technical Analysis Course
Technical Analysis Course is a technique used to assess and gauge the future value developments of financial instruments, like stocks, wares, monetary forms, and files, in light of verifiable value information and exchanging volume. Not at all like fundamental analysis, which looks at an organization’s monetary wellbeing and characteristic worth, technical analysis centers exclusively around cost and volume examples to go with exchanging choices.
Advantages & Disadvantages Of Technical Analysis Course
Advantages of Technical Analysis Course
Timing: Helps traders identify precise entry and exit points for trades.
Versatility: Applicable to various financial instruments, including stocks, commodities, forex, and indices.
Simplicity: Relies on price charts and technical indicators, making it easier to learn and apply compared to fundamental analysis.
Quick Analysis: Allows for rapid decision-making, which is particularly useful for short-term trading strategies.
Disadvantages of Technical Analysis Course
Short-Term Focus: Primarily used for short to medium-term trading, which may not be suitable for long-term investments.
Market Noise: Can be influenced by short-term market fluctuations and false signals.
Over-Reliance on Patterns: Solely relying on technical analysis can lead to ignoring fundamental factors that impact price movements.
Key Concepts, Tools and Techniques & Common Strategies In Technical Analysis Course Online
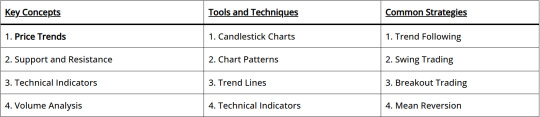
Technical Analysis Chart Patterns
Technical analysis chart patterns are vital tools for traders and investors, helping to predict future price movements by analyzing historical price data. These patterns are formed by the price movements of a stock or index over time and are used to identify potential market trends and reversals. This guide covers some of the most important chart patterns in technical analysis, their significance, and how to use them effectively.
Using Chart Patterns Effectively
Confirm the Pattern: Ensure the pattern is fully formed before acting on it. Prematurely acting on incomplete patterns can lead to false signals.
Volume Analysis: Volume should confirm the pattern. For example, in a head and shoulders pattern, volume should decrease during the formation of the head and increase on the breakout.
Set Target Prices: Measure the height of the pattern and project it from the breakout point to set target prices. For instance, in a double top pattern, the height from the peak to the support level can be projected downward from the breakout point to estimate the price target.
Use Stop-Loss Orders: Protect your capital by setting stop-loss orders at strategic points. For example, place a stop-loss just above the right shoulder in a head and shoulders pattern.
Combine with Other Indicators: Use other technical indicators, such as moving averages, RSI, and MACD, to confirm the signals provided by chart patterns.
Key Patterns
Dow Theory in Technical Analysis Course
Dow Theory in technical analysis course is one of the foundational concepts of technical analysis, developed by Charles Dow, the co-founder of Dow Jones & Company and the creator of the Wall Street Journal. Dow Theory in technical analysis provides a framework for understanding market trends and is based on the observation of market behavior through indices. This theory remains highly relevant and is widely used by traders and investors to predict market movements.
Key Principles of Dow Theory In Technical Analysis
Dow Theory consists of six tenets that form the basis of its market analysis approach:
1. The Market Discounts Everything
This principle asserts that all known information, including earnings, future prospects, and market news, is already reflected in stock prices. According to Dow, the market quickly assimilates information, and price movements are a result of the collective actions of investors.
2. The Market Has Three Trends
Dow Theory Technical Analysis Course identifies three types of market trends:
Primary Trend: It can be a bull market (upward trend) or a bear market (downward trend).
Secondary Trend: It represent corrections within a primary trend.
Minor Trend: It often influenced by day-to-day market fluctuations and noise.
3. Primary Trends Have Three Phases
Each primary trend is broken down into three phases:
Accumulation Phase: In a bear market, it’s the phase when these investors start selling, anticipating a downturn.
Public Participation Phase: This phase is typically supported by improving or deteriorating market conditions.
Excess Phase: The final phase usually sees the highest levels of activity and marks the culmination of the primary trend.
4. The Averages Must Confirm Each Other
According to Dow Theory Technical Analysis Course, for a trend to be considered valid, the movement of one market index must be confirmed by another. Originally, Dow used the Dow Jones Industrial Average (DJIA) and the Dow Jones Transportation Average (DJTA). The idea is that if one average moves in a certain direction, the other should follow, reflecting a broad market consensus.
5. Volume Confirms the Trend
Volume should increase in the direction of the primary trend. In a bull market, higher volumes should accompany upward movements, while in a bear market, increased volumes should accompany downward movements. This principle asserts that volume is a secondary but essential indicator of the strength of a price movement.
6. A Trend Is Assumed to Be in Effect Until It Gives Definite Signals of Reversal
This principle is akin to Newton’s first law of motion, suggesting that a trend will continue in its existing direction until a clear reversal signal is observed. This means that traders should assume a trend remains in place until the weight of evidence suggests otherwise.
Nifty Technical Analysis Course
Nifty technical analysis course involves examining the Nifty 50 index’s historical price data to forecast future price movements. The Nifty 50 index comprises the top 50 companies listed on the National Stock Exchange (NSE) of India, making it a vital indicator of the Indian stock market’s overall health.
Importance of Nifty Technical Analysis
Market Sentiment: Nifty technical analysis helps traders gauge the market sentiment and identify potential bullish or bearish trends.
Risk Management: By analyzing historical data and patterns, traders can set stop-loss levels and manage their risks effectively.
Entry and Exit Points: Technical analysis provides insights into optimal entry and exit points, helping traders maximize their profits.
Key Concepts in Nifty Technical Analysis
1. Dow Theory in Technical Analysis Course
Dow Theory, developed by Charles Dow, is a foundational concept in technical analysis course. It consists of six tenets that help traders understand market trends:
Market Discounts Everything: All information, including news and events, is reflected in the stock prices.
Three Market Trends: The market has three trends – primary (long-term), secondary (medium-term), and minor (short-term).
Primary trends have three phases: Accumulation, public participation, and distribution phases.
Indices Confirm Each Other: For a trend to be valid, it should be confirmed by other market indices.
Volume Confirms Trends: Volume should increase in the direction of the trend.
Trends Persist Until a Clear Reversal: A trend remains in effect until there are clear signals of its reversal.
2. Nifty Technical Indicators
Technical indicators are mathematical calculations based on historical price, volume, or open interest data. Popular indicators used in Nifty in technical analysis course include:
Moving Averages: Help smooth out price data to identify the trend direction. Common types include Simple Moving Average (SMA) and Exponential Moving Average (EMA).
Relative Strength Index (RSI): Measures the speed and change of price movements, indicating overbought or oversold conditions.
MACD (Moving Average Convergence Divergence): Shows the relationship between two moving averages and helps identify momentum and trend strength.
Bollinger Bands: Consist of a moving average with two standard deviation lines, indicating volatility and potential price reversals.
Applying Dow Theory to Nifty In Technical Analysis Course
When applying Dow Theory to the Nifty 50 index, traders can use the same principles to analyze market trends. Here’s how these principles can be practically applied:
Analyzing Market Trends
Primary Trends: Identify long-term trends in the Nifty 50. Look for price patterns that indicate whether the market is in a bullish or bearish phase.
Secondary Trends: Observe corrections within the primary trend. Use secondary trends to identify buying or selling opportunities.
Volume Analysis: Check if volume supports the observed price movements. Higher volumes during upward or downward movements confirm the strength of the trend.
Confirmation with Other Indices: Compare movements in the Nifty 50 with other indices like the Nifty Next 50 or sectoral indices. Confirmation across multiple indices strengthens the trend analysis.
Benefits of Dow Theory in Technical Analysis Course
Framework for Trend Identification: Dow Theory provides a clear framework for identifying and understanding market trends, essential for making informed trading decisions.
Improved Timing of Trades: By recognizing different phases of a trend, traders can better time their entry and exit points.
Enhanced Risk Management: Understanding market phases and volume trends helps traders manage their risk more effectively.
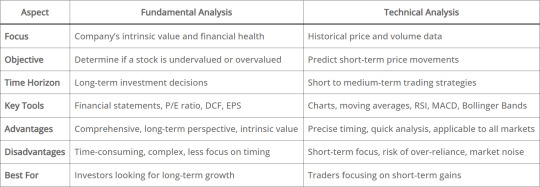
Difference Between Fundamental Analysis and Technical Analysis
In the world of stock market investing and trading, two primary methodologies are used to analyze securities and make investment decisions: fundamental analysis and technical analysis. Both approaches offer unique insights and are often employed by different types of investors depending on their investment goals and strategies. Here’s a comprehensive look at the differences between fundamental analysis and technical analysis:
Fundamental Analysis vs Technical Analysis
Investors and traders in the stock market employ various strategies to make informed decisions about buying and selling securities. Two primary approaches are fundamental analysis and technical analysis. Each method offers unique insights and tools, and understanding their differences can help investors choose the best approach for their investment goals.
Fundamental Analysis
Advantages
Long-Term Perspective: Helps in identifying long-term investment opportunities.
Intrinsic Value Focus: Provides a basis for comparing the stock’s market price to its intrinsic value.
Comprehensive Analysis: Involves a thorough examination of all aspects of a company’s performance and external factors affecting it.
Disadvantages
Time-Consuming: Requires detailed analysis and continuous monitoring of various factors.
Complex: Involves understanding financial statements and valuation models.
Less Focus on Timing: Not particularly useful for short-term trading due to its emphasis on long-term value.
Technical Analysis
Advantages
Timing: Helps in identifying precise entry and exit points for trades.
Quick Analysis: Less time-consuming compared to fundamental analysis.
Applicable to Any Security: Can be used for stocks, commodities, forex, and other trading instruments.
Disadvantages
Short-Term Focus: May not be effective for long-term investment decisions.
Risk of Over-Reliance: Solely relying on technical analysis can lead to ignoring fundamental aspects that affect price movements.
Market Noise: Can be influenced by short-term market noise and false signals.
Comparing Fundamental and Technical Analysis
ISMT Institute of Stock Market Training
The ISMT Institute of Stock Market Training is renowned for offering comprehensive technical analysis courses. These courses are designed to equip traders with the necessary skills to analyze the Nifty index and make informed trading decisions.
Comprehensive Curriculum: Covers key aspects of technical analysis, including Dow Theory, Nifty Technical Analysis, chart patterns, and technical indicators.
Flexible Learning: Offers both in-person and online classes, allowing students to learn at their own pace.
Expert Instructors: Classes are conducted by industry experts with extensive experience in stock market trading.
Practical Training: Provides hands-on training with real-time market data to ensure practical understanding and application.
Ongoing Support: Offers mentorship and support even after the course completion, helping students navigate the stock market with confidence.
CONCLUSION
Choosing the right technical analysis course can significantly impact your trading success. Each of the highlighted courses offers unique advantages, catering to different learning preferences and professional needs. The ISMT Institute of Stock Market Training stands out with its comprehensive curriculum, expert faculty, and flexible online classes, making it a top choice for aspiring traders.
Whether you prefer a structured certification course like those offered by NSE and NIFM or the flexible, self-paced learning options from Coursera and Udemy, these top five technical analysis courses in India provide excellent opportunities to enhance your trading skills and market knowledge. By understanding and applying technical analysis, traders can make more informed decisions and navigate the complexities of the stock market with greater confidence.
By ENQUIRE in a reputable ISMT Best Stock Market Course In India (Varanasi) provides both Online & Offline courses to gain knowledge and skills in the world of trading and investment.

#technicalanalysis#tradingcourse#learnstocktrading#indianstockmarket#onlinetradingcourse#financialeducation#stockmarketindia#stocktraderlife#onlinecoursesindia#technicalindicators#ismtinstitute#ismt#learnfromismt
0 notes
Text
AI Chart Analysis: Decoding Market Trends with Precision
Technical analysis has long been a cornerstone of successful trading, but recent advancements in artificial intelligence have taken this discipline to new heights. Enter AI chart analysis—a method that uses machine learning and data science to interpret market charts more accurately and efficiently than ever before.
Traditional chart analysis relies heavily on human interpretation of patterns like head-and-shoulders, support and resistance, or moving averages. While effective, this approach is limited by human bias and the inability to process massive data streams simultaneously. AI chart analysis removes these barriers by scanning thousands of charts, identifying complex patterns, and generating insights in real time.
This technology is especially valuable for traders seeking to gain an edge in volatile or fast-moving markets. AI can detect micro-trends that escape the human eye and react to them instantly. This kind of responsiveness can significantly improve entry and exit timing, ultimately enhancing profitability.
Platforms offering ai chart analysis make these capabilities available to a broader audience. They deliver powerful visual tools and predictive models that not only highlight opportunities but also explain the reasoning behind each suggestion. This helps traders build confidence in their strategies and learn from the AI's interpretations.
Despite its strengths, AI chart analysis is not a magic bullet. It should be viewed as a complement to, rather than a replacement for, a comprehensive trading strategy. Understanding market fundamentals, managing risk, and maintaining discipline are still crucial components of successful investing.
In essence, AI chart analysis is transforming how traders approach technical data. By providing clearer signals and deeper insights, it empowers investors to make faster, smarter, and more confident decisions. As this technology continues to evolve, it’s likely to become a standard feature in every serious trader's toolkit.
0 notes
Text
Trading Chart Patterns PDF Guide & Algo Tools
Mastering Market Moves: The Ultimate Guide to Trading Chart Patterns Book PDF
Introduction
Have you ever looked at a stock chart and thought, “What am I even looking at?” You’re not alone! Deciphering those zig-zagging lines can feel like trying to read an alien language. But what if I told you that those shapes — those patterns — actually tell a story? And once you understand that story, you could make smarter trading decisions. That’s where a trading chart patterns book PDF becomes your secret weapon.
In this article, we'll break down trading chart patterns in a friendly, no-nonsense way. We'll also explore how combining this knowledge with algorithmic trading software — especially the best algo trading software in India — can supercharge your trading game.
Download the best trading chart patterns book PDF. Learn how chart patterns, algorithmic trading software, and the best algo trading software in India help you win.
What Are Trading Chart Patterns?
Think of chart patterns like footprints in the snow. They show you where traders have been — and sometimes where they might go next. A chart pattern is just a visual formation on a price chart that helps traders make predictions. Whether it’s a triangle, a head and shoulders, or a double bottom — these shapes can signal buying or selling opportunities.
Why Use a Trading Chart Patterns Book PDF?
Let’s be real — the internet is loaded with scattered info. But a trading chart patterns book PDF puts everything in one place. It’s your go-to guide, available offline, structured, and perfect for both beginners and seasoned traders. Plus, you can refer to it anytime — even during a coffee break.
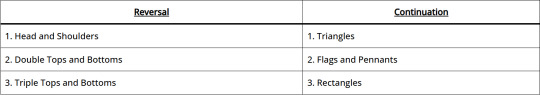
The 3 Main Types of Chart Patterns
Just like in movies, there are three main types of chart patterns:
Reversal Patterns: These hint that the trend is about to change.
Continuation Patterns: These suggest the trend will likely continue.
Bilateral Patterns: They could go either way — like a cliffhanger ending.
Understanding these gives you the power to react smartly, not emotionally.
Top Reversal Patterns Explained
Reversal patterns are like plot twists. They tell you the story is changing.
Head and Shoulders: Think of it like a person slumping. It often signals a shift from up to downtrend.
Double Top and Bottom: These patterns look like the letter ‘M’ or ‘W’. They scream, “Change is coming!”
Learning to spot these can save you from a bad trade — or help you enter just in time.
Key Continuation Patterns You Should Know
Continuation patterns keep the story flowing in the same direction.
Triangles (Ascending, Descending, Symmetrical): Imagine price compressing like a spring — ready to break out.
Flags and Pennants: These are like pit stops in a rally. The price pauses, then zooms off again.
Master these, and you’ll catch trends before others even notice.
How to Read Patterns Like a Pro
Reading chart patterns is part art, part science. Here’s how to get good at it:
Use candlestick charts for clarity.
Watch volume — it tells you how strong a move is.
Use support and resistance lines like guardrails.
It’s like learning to read music — confusing at first, but magical once you get it.
Common Mistakes Traders Make
Even the best traders mess up. Here are common traps:
Forcing patterns: If it doesn’t fit, don’t force it.
Ignoring volume: Patterns without strong volume are weak.
Overtrading: Don’t jump into every “almost” pattern.
Remember: Quality over quantity wins the game.
Best Resources for Chart Pattern PDFs
Here are some great places to find your next trading chart patterns book PDF:
Chart Patterns & Technical Indicators by Edward Dobson
Technical Analysis of the Financial Markets by John Murphy
Online libraries like Scribd, Academia, and even Reddit threads
Official broker platforms often offer free downloads
Just make sure you pick one with charts and examples, not just theory.
How Algorithmic Trading Software Helps
This is where things get exciting. Algorithmic trading software uses computer code to place trades. It can recognize patterns faster than any human. When you combine this with your knowledge of chart patterns, you’ve got a winning formula.
It’s like pairing Sherlock Holmes (your pattern spotting) with Watson (your algo software). Together, unbeatable!
Best Algo Trading Software in India
If you’re in India, here are some top-rated options:
Quanttrix – Known for speed and user-friendly interface.
Zerodha Streak – Drag-and-drop logic for non-coders.
AlgoTrader India – Offers institutional-grade automation.
Each has features like backtesting, live execution, and real-time analysis — ideal for traders who want results.
Using Chart Patterns in Algorithmic Strategies
Good algorithmic traders don’t just rely on numbers. They bake in pattern recognition rules:
Code to detect head and shoulders
Alerts for double tops
Algorithms that track breakout triangles
These strategies can be coded in platforms like MetaTrader, Python scripts, or even Streak.
Getting Started With a Chart Pattern Book
Here’s how to start:
Download a recommended trading chart patterns book PDF.
Start with 3-5 basic patterns.
Print a cheat sheet.
Look at real charts daily.
Journal what you see.
Consistency is key — don’t expect overnight success.
Tips to Practice Pattern Recognition
Think of pattern spotting like facial recognition. The more faces (charts) you see, the better you get.
Use trading simulators
Join trader communities
Quiz yourself using historical charts
Mark up charts manually
This hands-on practice boosts your confidence and instincts.
Mobile Apps & Tools for Chart Learning
Want to learn on the go? Try these:
TradingView: Mobile-friendly and packed with features.
Investing.com App: Clean charts and lots of news.
ChartSchool by StockCharts: A mini chart encyclopedia.
These help reinforce what you read in your chart pattern PDF.
Final Thoughts
Trading isn’t magic — it’s mastery. Understanding chart patterns gives you a serious edge. And when paired with powerful algorithmic trading software, especially the best algo trading software in India, you can turn insights into intelligent action.
So go ahead. Download that trading chart patterns book PDF, open up a demo account, and start seeing the market with new eyes. The journey from confusion to clarity starts with one pattern.
FAQs
What is the best trading chart patterns book PDF for beginners? “Technical Analysis for Dummies” and “Chart Patterns Explained” are great PDFs for those starting out.
Can I use chart patterns with algorithmic trading software? Yes! Many algorithmic tools allow you to code or automate pattern recognition and trading rules.
Which is the best algo trading software in India? Quanttrix and Zerodha Streak are widely recommended due to their user-friendly tools and performance.
Are trading chart patterns reliable for predicting markets? They’re not perfect, but when combined with volume and confirmation signals, they greatly improve your odds.
Where can I practice chart pattern recognition for free? Websites like TradingView and platforms like MetaTrader offer free tools and demo accounts.
0 notes
Text
Demystifying Technical Analysis: A Beginner’s Guide to Chart Patterns and Indicator
Demystifying Technical Analysis: A Beginner’s Guide to Chart Patterns and Indicators” offers an accessible entry point into the world of technical analysis, providing novice traders with the foundational knowledge needed to interpret charts and indicators effectively. This blog series breaks down complex concepts into simple, easy-to-understand terms, empowering beginners to make informed trading decisions based on technical analysis. From recognizing common chart patterns such as head and shoulders or triangles to understanding the significance of key indicators like moving averages and relative strength index (RSI), this guide equips traders with the essential tools for analyzing market trends and identifying potential entry and exit points.
Through practical examples and step-by-step tutorials, this series demystifies technical analysis, giving beginners the confidence to incorporate these powerful tools into their trading strategies. Whether you’re looking to enhance your understanding of price action or gain insights into market sentiment, mastering technical analysis is a crucial step towards becoming a successful trader. By equipping yourself with the knowledge and skills outlined in this guide, you’ll be better prepared to navigate the complexities of the financial markets and embark on your trading journey with clarity and confidence.
0 notes
Text
Exploring the ZigZag Arrow Indicator for MT4

Introduction to Technical Analysis Tools
Technical analysis tools are vital for traders aiming to navigate the complexities of financial markets. Among these, the ZigZag indicator is renowned for simplifying price action by filtering out minor fluctuations. The ZizgZag arrow indicator for MT4 enhances this functionality by marking key turning points with arrows, making it easier to identify trends and reversals on the MetaTrader 4 platform.
What is the ZigZag Arrow Indicator?
The ZigZag arrow indicator is a variation of the standard ZigZag tool, which connects significant price highs and lows to highlight major market movements. Unlike the basic ZigZag, the arrow version places visual markers (arrows) at pivot points, indicating potential trend changes or continuation patterns. This indicator is not built into MT4, so traders often download the ZigZag arrow indicator for MT4 from external sources or trading communities to integrate it into their charts.
The indicator uses parameters like depth, deviation, and backstep to determine the significance of price swings, allowing customization to suit different trading styles and timeframes.
Benefits of Using the ZigZag Arrow Indicator
The ZigZag arrow indicator for MT4 offers several advantages:
Trend Identification: By connecting major highs and lows, the indicator helps traders visualize the overall market direction, filtering out noise.
Reversal Signals: Arrows mark potential reversal points, aiding traders in spotting entry or exit opportunities.
Pattern Recognition: The indicator simplifies the identification of chart patterns like head and shoulders, double tops, or Elliott Wave structures.
By choosing to download the ZigZag arrow indicator for MT4, traders can access enhanced features like customizable arrow styles, alerts, or multi-timeframe compatibility, improving decision-making efficiency.
How to Download and Install the Indicator
To use the ZigZag arrow indicator in MT4, follow these steps:
Find the Indicator: Search for the indicator on trusted platforms, such as trading forums, MT4 marketplaces, or developer websites. Ensure the file is in .mq4 or .ex4 format.
Download and Install: Save the file to the “MQL4” > “Indicators” folder in MT4’s data directory. Restart MT4 to load the indicator in the “Navigator” panel.
Apply to Chart: Drag the indicator onto a chart, then adjust settings like depth (minimum bars between pivots), deviation (percentage price change), and backstep (bars to confirm a pivot). Customize arrow colors or sizes for clarity.
Analyze Signals: Look for arrows indicating swing highs or lows. An upward arrow suggests a potential bullish reversal, while a downward arrow signals a bearish shift.
Always verify the source when you download the ZigZag arrow indicator for MT4 to avoid unreliable or malicious files.
Practical Applications
The indicator is versatile across trading strategies:
Trend Following: Use arrows to confirm trend direction alongside moving averages or trendlines.
Swing Trading: Enter trades at arrow signals, targeting the next pivot point.
Pattern Trading: Identify harmonic patterns or Fibonacci retracement levels using ZigZag pivot points.
Tips for Effective Use
To optimize the indicator’s performance:
Combine with other tools, like RSI or Bollinger Bands, to confirm signals and reduce false positives.
Adjust parameters to match the asset’s volatility and timeframe (e.g., higher depth for daily charts, lower for intraday).
Test the indicator on a demo account to refine settings before live trading.
Conclusion
The ZigZag arrow indicator for MT4 is a powerful tool for traders seeking to simplify price action analysis. By marking key pivot points with arrows, it enhances trend identification, reversal detection, and pattern recognition. Traders can easily download the ZigZag arrow indicator for MT4 to customize their charts and improve trading precision. With proper configuration and integration with other tools, this indicator can significantly elevate trading performance in dynamic markets.
0 notes
Text
Decoding Advanced Chart Patterns: Double Tops and Head & Shoulders
Understanding Technical Analysis and Chart Patterns
Technical analysis largely depends on identifying visual indicators that hint at potential market movements. Among the array of tools available, chart patterns, such as the double top formation, remain a steadfast choice. The Double Top and Head & Shoulders patterns are among the most reliable and extensively studied formations. These reversal patterns, including the double bottom, aren't mere shapes on a chart—they symbolize the collective psychology of traders and the ongoing battle between buyers and sellers.
The Role of Double Tops and Head & Shoulders in Trading
This guide delves into the formation of these patterns, how traders can leverage them across various markets, and the common pitfalls to avoid. Whether you're involved in forex, stocks, or crypto trading, mastering the Double Top and Head & Shoulders patterns, as well as other continuation patterns, can provide a structured approach to your trading strategy.
What Makes Reversal Patterns So Powerful?
The Importance of Reversal Patterns in Market Analysis
Reversal patterns indicate a change in market direction. They suggest that the current trend—often bullish reversal—is losing steam and that a shift to bearish momentum may follow. This makes them especially useful for traders looking to time exits from long positions or enter new short setups.
Contextualizing Reversal Patterns for Better Trading Decisions
What separates strong patterns from false alarms is context. A Double Top or Head & Shoulders setup means little if the broader trend, volume, and momentum indicators don’t support the narrative. That’s why seasoned traders treat these patterns as part of a wider toolkit—not a standalone signal.
Psychological Insights from Reversal Patterns
Reversal patterns like the Double Top and Head & Shoulders are common reversal patterns are essential for identifying potential trend reversals. These patterns highlight a change in market sentiment, often signaling that the existing trend is weakening. By recognizing these bullish continuation formations, traders can anticipate shifts in the prevailing trend, allowing them to adjust their strategies accordingly. The psychological aspect of these patterns is crucial, as they reflect the collective emotions of market participants—fear, greed, and indecision—leading to potential market reversals.
The Double Top Pattern Explained
Formation and Mechanics of the Double Top
The Double Top forms when price action rallies to a resistance level, pulls back, then rallies again, only to hit the same resistance and drop. The inability to break the previous high shows fading bullish momentum. Once the neckline (the low between the two peaks) is broken, the pattern confirms, and a potential downtrend may begin.
Psychological Insights and Trading Implications
The psychological takeaway is simple: buyers tried twice to push higher but failed. Sellers begin to dominate, and traders may look to capitalize on the shift. This pattern is a classic example of a bearish reversal pattern. It occurs after an upward trend, signaling that the bullish momentum is weakening. The pattern forms when the price hits a resistance level twice, failing to break through, and subsequently declines. This failure to surpass previous highs indicates that buying pressure is diminishing, making it an opportune moment for traders to consider short positions.
Best Conditions for a Double Top Pattern to Work
Optimal Market Conditions
This pattern performs best after a sustained uptrend. If the price has been ranging or consolidating, a double top may not carry as much weight. For maximum effectiveness, traders should confirm the pattern with volume indicators or a trendline break.
Using Technical Indicators for Confirmation
Some traders use oscillators like the RSI to spot bearish divergence at the second peak, which can strengthen the case for a reversal. For the Double Top bearish pattern to be most effective, it is crucial that it follows a strong upward trend. This context provides the pattern with the necessary momentum to signal a reversal. Additionally, confirming the pattern with volume indicators or trendline breaks enhances its reliability. Traders often look for bearish divergence using technical indicators like the RSI to further validate the pattern's potential for signaling a trend reversal.
The Head & Shoulders Pattern: A Stronger Reversal Indicator?
Structure and Significance
The head and shoulders pattern is often viewed as one of the most reliable reversal signals. With its three-peak structure, it reflects a market that's struggling to maintain upward momentum. The left shoulder marks the first rally and pullback, followed by a stronger push upward to form the head. The final rally—the right shoulder—falls short of previous highs, showing weakness in buying pressure.
Confirmation and Trading Strategy
Once the price breaks below the neckline, the pattern confirms. This typically signals a shift from bullish to bearish sentiment. The Head & Shoulders pattern is revered for its reliability as a bearish reversal chart pattern. Its distinct three-peak structure provides a clear visual representation of waning bullish momentum. The pattern's formation, with the head being higher than the shoulders, signifies a weakening of buying pressure. When the price breaks below the neckline, it confirms the pattern, often leading to a significant downward trend.
What Makes Head & Shoulders Patterns So Reliable?
Psychological and Technical Aspects
Institutional traders often watch this pattern because of its psychological clarity. The inability to create a higher high after the head shows that bullish energy is fading. Volume tends to decrease during the formation and then spike during the neckline break, providing additional confirmation.
Versatility Across Timeframes
These patterns also occur across all timeframes, from 5-minute charts in day trading to weekly charts for swing traders. The reliability of the Head & Shoulders pattern, as well as the symmetrical triangle pattern, lies in its clear depiction of market psychology. Institutional traders, in particular, value this pattern for its ability to highlight the exhaustion of buying pressure. As the pattern forms, volume typically decreases, indicating a lack of conviction among buyers. The subsequent volume spike when the neckline breaks serves as a strong confirmation of the bearish reversal. This pattern's versatility across various timeframes adds to its appeal for traders seeking to identify potential trend changes.
Double Top vs. Head & Shoulders: What's the Difference?
While both patterns are bearish reversal signals, they differ in complexity and interpretation.
Double Top is simpler and quicker to form. It shows resistance at a single level and failure to break it.
Head & Shoulders is more gradual and involves a higher high (the head) before the final failure. It's often seen as more reliable but also requires more patience.
In essence, the Double Top reflects rejection at a known resistance, while the Head & Shoulders shows an exhaustion of buyers across three separate waves.
The key distinction between the Double Top and Head & Shoulders patterns lies in their structure and complexity. The Double Top is a straightforward formation, characterized by two peaks at nearly the same level, indicating a clear resistance point. In contrast, the Head & Shoulders pattern is more intricate, featuring three distinct peaks with the head being higher. This complexity often makes the Head & Shoulders pattern more reliable, as it reflects a more gradual exhaustion of buying pressure. However, it also requires traders to exercise patience in waiting for the pattern to fully develop.
How to Trade the Double Top Pattern Effectively?
To trade the Double Top:
Wait for confirmation with a neckline break.
Place a stop-loss slightly above the second peak.
Measure the height from the peak to the neckline and project it downward to estimate your target.
Volume confirmation is important. Ideally, the second peak should form on lower volume, and the break below the neckline should come with a volume spike.
Trading the Double Top pattern effectively requires patience and discipline. Traders should wait for the trend lines and pattern to confirm with a break below the neckline before entering short positions. Setting a stop-loss slightly above the second peak helps manage risk. To estimate a profit target, measure the height from the peak to the neckline and project it downward. Volume plays a crucial role in confirming the pattern's validity, with a lower volume at the second peak and a volume spike during the neckline break serving as key indicators.
How to Trade the Head & Shoulders Pattern?
With the Head & Shoulders:
Identify the three peaks and draw the neckline.
Wait for the price to break below the neckline before entering.
Place your stop above the right shoulder.
Measure the height from the head to the neckline and subtract that from the breakout point to project your target.
Some traders refine this further by using Fibonacci retracement levels for profit-taking zones.
Trading the Head & Shoulders pattern involves a systematic approach. Traders should first identify the three peaks and draw the neckline. Entry should occur only after the price breaks below the neckline, signaling a confirmed reversal. A stop-loss placed above the right shoulder helps protect against potential losses. To determine a profit target, measure the height from the head to the neckline and subtract it from the breakout point.
In addition to these steps, traders often incorporate technical indicators to enhance their strategy. For instance, using the Relative Strength Index (RSI) can help identify overbought conditions, which may coincide with the formation of the right shoulder, further validating the pattern's bearish reversal potential. Moreover, monitoring volume is crucial; a decrease in volume during the formation of the head and shoulders, followed by a volume spike upon the neckline break, strengthens the case for a trend reversal.
Furthermore, it's essential to consider the broader market context. Patterns that align with existing bearish trends or coincide with key resistance levels tend to be more reliable. By integrating these factors, traders can increase their confidence in the pattern and make more informed decisions.
Advanced traders might also look for confluence with other chart patterns or technical indicators, such as moving averages or Bollinger Bands, to confirm the reversal signal. This multi-faceted approach helps in filtering out false signals and improving the accuracy of trade entries and exits.
Overall, the Head & Shoulders pattern, when combined with a comprehensive market analysis and risk management strategy, can be a powerful tool for identifying potential market tops and optimizing trading outcomes.
Can These Patterns Work in Crypto and Forex?
Absolutely. Double Tops and Head & Shoulders appear across all asset classes, including forex and cryptocurrencies. However, in markets like crypto—where price movements, such as during a double bottom formation, are more volatile—false breakouts can be more frequent. That’s why volume and momentum indicators become even more critical in these environments. Traders often rely on these technical indicators to filter out noise and validate genuine trend reversals, ensuring that their trading strategies are robust against market volatility.
In forex, where liquidity and institutional order flow play a larger role, traders often pair these patterns with tools like moving averages, Bollinger Bands, or the ADX to validate breakouts. These additional tools help traders gauge the strength of the trend and the likelihood of a successful breakout, providing a more comprehensive market analysis.
How Institutions and Advanced Traders Use These Patterns?
Institutional traders rarely rely on patterns alone. Instead, they use them in conjunction with order flow, volume profile analysis, and key support/resistance zones. When large players spot a Double Top or descending triangle forming near a major resistance, they may begin building short positions slowly, causing subtle shifts in price that retail traders can learn to recognize. This strategic approach allows them to anticipate market reversals and position themselves advantageously before the broader market reacts.
This deeper layer of pattern interpretation can help traders avoid false signals and better time their entries. By understanding the underlying market dynamics and integrating multiple technical analysis tools, traders can enhance their decision-making process and improve their trading outcomes.
Should You Rely Solely on Chart Patterns?
Not entirely. While patterns like the Double Top and Head & Shoulders can help guide decisions, they’re not predictive guarantees. Successful traders use a combination of chart patterns, market context, volume confirmation, and strict risk management. This holistic approach ensures that they are not solely dependent on one signal but rather have a comprehensive understanding of market conditions.
Combining patterns with indicators like RSI, MACD, or moving averages can increase confidence. Some also use candlestick patterns—like bearish engulfing or shooting stars—as added confirmation near the peaks. This multifaceted strategy allows traders to cross-verify signals, including bullish reversal patterns, and reduce the likelihood of errors.
Real Market Example (Descriptive Only)
Let’s say a currency pair like EUR/USD climbs steadily over two weeks, topping out at 1.1100. After a pullback to 1.1030, it rallies again to 1.1098 but fails to break higher. Shortly after, the price drops below 1.1030 on rising volume. That’s a textbook Double Top. Such scenarios demonstrate the importance of volume analysis in confirming pattern signals, as rising volume during the breakout reinforces the bearish reversal pattern.
Now, imagine a stock forms a high of $150, drops to $140, climbs to $155, and then fails to get past $150 again before collapsing. If you spot the three-peak structure forming over a month and the neckline breaks below $140, you’re looking at a solid Head & Shoulders setup. Recognizing these formations early allows traders to capitalize on potential downward trends, optimizing their profit targets.
Why Learning These Patterns Still Matters in 2025?
1. Enduring Relevance of Chart Patterns
Even in a world dominated by algorithms and high-frequency trading, human behavior doesn’t change. These patterns reflect hesitation, fear, overconfidence, and loss of momentum—all fundamental aspects of market psychology. Understanding these psychological components can give traders an edge in anticipating market reversals and adjusting their strategies accordingly.
2. Improving Timing and Outcomes
Whether you're an active day trader or building a longer-term swing strategy, learning how to confirm Double Tops with volume or spot a Head & Shoulders setup before the neckline break can significantly improve your timing and outcomes. This knowledge equips traders with the ability to navigate complex market environments with greater precision and confidence.
3. Adaptability Across Markets and Timeframes
In addition to their psychological insights, these patterns remain relevant due to their adaptability across various markets and timeframes. As financial markets continue to evolve, the ability to recognize and interpret chart patterns like Double Tops and Head & Shoulders becomes even more crucial for identifying potential bullish reversals. These patterns, as seen on the price chart, provide traders with a framework for understanding market sentiment and potential trend reversals, regardless of the asset class or trading style.
4. Complementing Modern Analytical Techniques
Moreover, as more traders incorporate advanced technical analysis and machine learning tools into their strategies, the foundational knowledge of chart patterns serves as a valuable complement. By combining traditional pattern recognition with modern analytical techniques, traders can enhance their ability to identify profitable opportunities and manage risks effectively.
5. A Timeless Tool for Future Trading
As we move further into the future, the significance of chart patterns in trading will likely persist, offering traders a timeless tool to decode market dynamics and make informed decisions. Whether you're trading stocks, forex, or cryptocurrencies, mastering these patterns will continue to be a critical component of successful trading strategies in 2025 and beyond.
Enhancing Your Strategy with Pattern Recognition
Using chart patterns isn’t about memorizing shapes. It’s about understanding what the market is telling you. When used with the right tools—volume, support, and resistance, momentum indicators—they become powerful allies, including the bullish flag pattern, in building a more disciplined trading plan. This approach encourages traders to focus on data-driven decisions rather than emotional reactions, ultimately leading to more consistent trading success.
Patterns like the Double Top and Head & Shoulders provide structure, helping you avoid emotional trades and focus on setups with a statistical edge. And in a world where markets move fast, having that structure makes all the difference. By integrating these patterns into a broader trading strategy, traders can enhance their market analysis and improve their overall performance.
0 notes
Text
Bitcoin’s $100K Dream Hangs by a Thread — And Most Investors Are Getting It Wrong

Bitcoin is standing at the edge of a knife. This isn’t just another "healthy pullback." It’s a full-blown battle for Bitcoin’s next identity — and most traders are sleepwalking into it.
At $94,000, Bitcoin isn’t deciding whether to go up or down. It’s deciding whether it still has the power to lead global risk appetite into a new cycle — or whether it will spend the next six months trapped in a brutal sideways purgatory.
Right now, everything hangs on what happens between $94,000 and $99,000. Lose here, and we could see $83,000 faster than most are ready for. Win here, and Bitcoin will be knocking on $125,000’s door sooner than Wall Street expects.
But most retail investors are looking at the wrong signals.
The Great Supply Wall: 1.76 Million BTC Says "Prove It"
You can’t talk about Bitcoin’s future right now without confronting the 1.76 million BTC elephant in the room.
According to IntoTheBlock data, roughly 2.6 million wallets have accumulated Bitcoin in the $94,125–$99,150 range. That’s a gigantic cluster of potentially nervous holders who are near break-even — and itching to sell if price action weakens.
This isn’t a casual ceiling. This is one of the densest sell walls Bitcoin has faced in this entire cycle.
In plain English: The market must show overwhelming strength to bulldoze through $99K — or risk a bloody rejection.
If Bitcoin fails here, expect a sharp flush to $89,000, maybe even $84,000. That’s not doom-mongering — it’s basic liquidity math. There are 678,000 BTC waiting at $93,000 and another 759,150 BTC around $84,000, ready to catch the fall.
History is clear: When Bitcoin meets thick resistance and fails, it doesn’t just dip — it dives.
The Bull Case Isn't Dead — But It's on Life Support
Despite this looming threat, some technical structures still favor the bulls — if they act fast.
The big beacon of hope is the Inverse Head & Shoulders pattern spotted by Titan of Crypto. On the monthly timeframe, Bitcoin has already broken out above the neckline and successfully retested it.
In technical analysis terms, that’s a textbook setup for a massive rally. Measured moves from an H&S breakout put Bitcoin’s next fair target somewhere between $125,000 and $130,000 — a full 30% rally from current levels.
And here’s the thing: Monthly structures don’t fake out easily. Short-term volatility is noise; long-term patterns are destiny.
But — and it’s a big but — even the most beautiful pattern dies if momentum completely collapses at key resistance.
Bitcoin needs to close above $96,600 in the next 1–2 weeks to invalidate this local selling pressure. Fail that, and this dream starts slipping away.
The Dangerous Illusion of Leverage Pumps
One of the biggest risks to Bitcoin right now isn’t fundamentals. It’s overheated leverage.
Data from Maartunn highlights that Bitcoin’s latest rallies have been leverage-driven Easter pumps, adding over $2 billion in open interest within 24 hours.
Leverage-based gains are fake strength. They make charts look explosive, but underneath, the moves are hollow — easy prey for liquidation cascades.
We've seen this movie before:
March 2020 — leverage wiped out 50% of Bitcoin’s price in days.
May 2021 — over-leveraged longs got liquidated into a brutal summer bear market.
If Bitcoin cannot sustain organic spot buying to support these levels, the downside risk isn’t a 5% dip — it’s a violent 10–20% correction.
The illusion of strength is far more dangerous than obvious weakness.
The $83K Scenario: A Brutal, Necessary Cleansing
If Bitcoin fails to reclaim momentum here, I’m betting on a swift correction toward $83,000–$85,000.
Why that zone? Because that’s where real organic demand still exists — where conviction buyers, not speculators, are waiting.
Swissblock’s analysts agree:
$89,000–$90,000 is minor support (first landing pad)
$83,000–$85,000 is the real floor (where serious bids are stacked)
Think of it this way: A drop to $83K isn’t Bitcoin dying. It’s Bitcoin shedding dead weight before launching higher.
In fact, historically, Bitcoin’s strongest rallies often follow sharp, painful flushes. Clear out weak hands → reset leverage → real buyers step in → next leg higher.
It’s brutal, but it’s healthy.
The Macro Tailwind Few Are Talking About
While short-term technicals are messy, the macro backdrop quietly favors Bitcoin’s long-term strength.
Paul Atkins, the newly appointed SEC Chairman, is pro-crypto and already hinting at broader ETF approvals.
The U.S. dollar continues to show relative weakness, supporting Bitcoin’s narrative as a "digital safe haven."
Spot Bitcoin ETFs are raking in billions, cementing Bitcoin’s place in institutional portfolios.
When you zoom out, this is no longer the 2017 retail casino. This is Bitcoin’s first cycle as a mainstream macro asset.
Corrections are not only survivable — they’re investment opportunities for the brave.
Short-Term Pain, Long-Term Glory
Here’s where I’m planting my flag:
Bitcoin likely faces one more sharp correction toward $83,000–$85,000 in the next 30 days.
This will be painful, ugly, and drive fear headlines.
Smart money will be loading the dip, not panic selling.
By late 2025, Bitcoin will not only reclaim $100,000 — it will sprint past it toward $125,000 and beyond.
If you’re scared now, you’re looking too close. Zoom out. The future is already written — you just have to survive the turbulence.
Buckle Up
Bitcoin isn’t dying. It’s battling for its next chapter.
The $94,000–$99,000 zone is no joke. Fail here, and the next few weeks will be rough — but ultimately necessary.
If you can’t handle the volatility, Bitcoin has a simple message for you: This asset was never for the faint of heart.
And if you can? You’re about to witness history.
🔥 Like what you're reading? We don't lock our content behind paywalls — everything we publish is free for the community. If you find value in our work and want to support independent crypto journalism, consider buying us a coffee ☕ on Ko-Fi! Every donation, big or small, helps us keep creating bold, data-driven content. 👉https://ko-fi.com/thedailydecrypt
© 2025 InSequel Digital. ALL RIGHTS RESERVED. This article may not be reproduced, distributed, or transmitted in any form without prior written permission.
0 notes
Text
Why Every Trader Should Learn Multiple Charts Pattern Analysis

In the dynamic world of trading, patterns are more than just lines and shapes on a chart—they are visual representations of market psychology, a roadmap to potential price movement. For traders looking to enhance their market analysis and decision-making skills, learning Multiple Charts Pattern analysis is not just beneficial—it’s essential.
Whether you're new to trading or a seasoned market participant, understanding various chart patterns can dramatically improve your success rate. This article explores why every trader should learn Multiple Charts Pattern analysis and how this skill forms the foundation of profitable trading strategies.
The Power of Patterns in Trading
Each chart pattern captures the interplay of buyer and seller psychology, offering a glimpse into market sentiment. These patterns, when correctly interpreted, can signal whether the market is likely to continue its current direction or reverse course. Patterns such as head and shoulders, double tops and bottoms, triangles, flags, and wedges provide traders with clear entry and exit signals.
However, relying on just one or two familiar patterns can limit your potential. The complexity of markets is reflected in the diverse and intricate patterns they produce. That’s why it’s important to learn Multiple Charts Pattern analysis—to broaden your perspective and increase your adaptability in different market conditions.
What is Multiple Charts Pattern Analysis?
Multiple Charts Pattern Analysis is the practice of studying and recognizing a wide range of technical chart patterns across various timeframes and market scenarios. Rather than focusing solely on one chart type or timeframe, traders analyze different patterns from candlestick charts, bar charts, line charts, and more. They also explore these patterns across daily, weekly, and intraday time frames to get a comprehensive view of market behavior.
This approach helps traders spot potential setups with greater accuracy, avoid false signals, and align their trades with the broader market trend.
Benefits of Learning Multiple Charts Pattern Analysis
Improved Decision Making: When you learn Multiple Charts Pattern techniques, you gain a structured way to interpret market data. This leads to better, faster decision-making and increased confidence in your trades.
Greater Flexibility in Trading Strategies: Not all markets move the same way. By mastering different chart patterns, you can adapt your trading strategy to suit trending, ranging, or volatile markets.
Reduced Emotional Trading: Fear and greed can cloud judgment, leading traders to act on impulse rather than logic. A solid understanding of chart patterns adds discipline to your trading, helping you rely on logic and analysis instead of gut feelings.
Enhanced Risk Management: Most chart patterns come with well-defined areas for placing stop-loss and take-profit orders. This clarity allows for better risk-reward setups, keeping losses small and maximizing potential gains.
How to Start Learning Multiple Charts Pattern Analysis?
With the growing availability of trading courses online, mastering this skill is more accessible than ever. With structured guidance, practical demonstrations, and community support, online courses help traders go from beginner to advanced level at their own pace.
When looking to learn trading online, make sure the course includes:
A wide variety of chart patterns
Real-world trading examples
Practice charts and quizzes
Access to mentors or peer groups
The best online trading course will not only teach you the patterns but also show you how to apply them in live market scenarios.
Why Traders Prefer Online Learning?
More traders today are turning to online trading courses due to their accessibility, flexibility, and cost-effectiveness. Instead of spending hours sifting through scattered resources, these courses offer a streamlined path with expert insights and practical tips.
At Chart Monks, for example, our online trading course is designed specifically to help you learn Multiple Charts Pattern analysis in a structured and engaging way. From beginner-level basics to advanced strategies, our course modules guide you through every step of the journey with clarity and confidence.
Real-World Application of Multiple Chart Patterns
Consider a situation where a head and shoulders pattern develops on the daily chart, while a bullish flag takes shape on the 15-minute timeframe. A trader who understands both patterns can make a more informed decision—perhaps waiting for the intraday breakout to align with the longer-term trend reversal before entering a trade.
This kind of multi-pattern, multi-timeframe approach allows for:
Stronger confirmation before trade execution
Precision in entry and exit points
Reduced risk due to enhanced clarity
Such insights are only possible when you've committed the time to learn Multiple Charts Pattern analysis thoroughly.
Final Thoughts
To keep up with the ever-changing markets, your trading game must keep improving. Limiting yourself to a handful of patterns may provide short-term success, but if you're aiming for long-term consistency, mastering Multiple Charts Pattern Analysis is crucial.
With the right online trading course, dedication, and practice, any trader can develop this vital skill. So if you’re serious about leveling up your trading game, it’s time to learn Multiple Charts Pattern analysis and turn uncertainty into opportunity.
Ready to start your journey? Take the next step in your trading journey by visiting Chart Monks and exploring our expert-led online courses. Learn at your own pace, sharpen your skills, and become a more confident and consistent trader.
#Learn Multiple Charts Pattern#Multiple Charts Pattern Analysis#Learn Trading Online#Online Trading Course#Trading Courses Online#Chart Monk
0 notes
Text
What Makes Technical Stocks So Effective in Fast Markets?
In a world of rapid market fluctuations and data-driven strategies, Technical Stocks remain a central focus for short-term traders and tactical investors. These stocks are evaluated through price action and trading patterns, not just earnings or revenue. As markets evolve with increased volatility and liquidity, technical analysis continues to offer practical, real-time insights into stock behavior.
Breaking Down the Basics of Technical Analysis
The foundation of analyzing Technical Stocks lies in understanding historical price movements, volume, and recurring chart patterns. Instead of relying on company fundamentals, this approach uses technical indicators to identify trends, reversals, and breakout levels. Traders use candlestick charts, support and resistance zones, and trendlines to make actionable decisions in fast-moving markets.
Whether the goal is scalping small intraday movements or capturing multi-day trends, these tools offer a clear roadmap for timing entries and exits.
Core Indicators That Drive Trading Decisions
To evaluate Technical Stocks, traders depend on a range of technical indicators. Moving averages like the 50-day and 200-day provide insight into momentum and long-term trends. Meanwhile, tools such as the Relative Strength Index (RSI), Bollinger Bands, and MACD help identify overbought or oversold conditions.
Each indicator offers a unique perspective. When combined, they enhance the accuracy of market signals, allowing traders to refine their approach and reduce risk exposure.
How Emotions and Psychology Shape Technical Moves
Market psychology is a key element behind price movements in Technical Stocks. Fear, greed, and uncertainty often drive rapid shifts in sentiment, especially around earnings announcements, geopolitical events, or economic data releases. Technical analysis captures this behavior in chart formations like head-and-shoulders, double tops, and bullish flags.
Understanding these patterns allows traders to anticipate reactions and adjust their strategies accordingly—an essential skill when navigating emotionally charged markets.
The Double-Edged Sword of Technical Trading
Volatility is both a challenge and an opportunity when it comes to Technical Stocks. These stocks often experience significant price swings, which can create short-term profit potential. However, high volatility also increases the risk of losses if trades are not managed carefully.
Using tools like Average True Range (ATR) and volatility bands, traders can set stop losses, adjust position sizes, and manage trades with discipline—ensuring volatility is leveraged strategically rather than reactively.
Timeframes and Strategy Short-Term vs. Swing Trading
While technical analysis is often associated with day trading, it also supports longer-term strategies. Scalpers might focus on one-minute charts, whereas swing traders analyzing Technical Stocks might rely on daily or weekly setups. The time horizon influences everything from chart selection to indicator settings and risk tolerance.
Having a clearly defined trading plan tailored to your chosen timeframe is crucial for success. It ensures consistent decision-making and reduces emotional interference in trade execution.
Tech-Driven Tools Changing the Game
Technology has revolutionized how traders analyze Technical Stocks. Platforms now offer algorithmic trading, AI-powered alerts, and real-time charting features. Machine learning models can scan multiple securities simultaneously, identify pattern breakouts, and suggest high-probability setups.
These tools enhance speed and efficiency, helping traders react to market changes in seconds. For those seeking a competitive edge, integrating technology with a solid technical foundation is a game-changer.
Risk Management: Protecting Capital with Precision
The key to surviving and thriving in volatile markets lies in managing downside risk. Traders focused on Technical Stocks must know how to place stop-loss orders, set realistic profit targets, and determine the ideal trade size relative to portfolio value.
Tools such as risk-reward ratios, position-sizing calculators, and drawdown metrics allow traders to structure positions methodically—protecting gains while minimizing exposure to large losses.
News, Events, and the Unexpected
Although technical analysis is rooted in price and volume, external factors like earnings reports, central bank decisions, and geopolitical developments often trigger major moves in Technical Stocks. These events can invalidate patterns or cause false breakouts.
Successful technical traders stay aware of the macro calendar, using event timing as a backdrop when planning trades. Combining market awareness with technical setups results in more informed decisions and fewer surprises.
The Future of Technical Trading
As more investors adopt quantitative approaches, the importance of real-time analysis and adaptability is growing. The role of Technical Stocks is expected to expand as automation becomes more prevalent. Traders will need to continue learning, testing strategies, and integrating new tools to maintain an edge.
Staying updated on platform innovations, learning from past trades, and continuously refining entry/exit strategies are critical habits in the modern technical trader’s toolkit.
Technical Stocks as a Tactical Asset Class
Whether you're a day trader or a long-term trend follower, Technical Stocks offer a powerful way to capitalize on market behavior. By mastering indicators, understanding trader psychology, managing risk, and embracing tech innovations, investors can navigate short-term volatility with greater confidence.
As markets remain unpredictable, technical strategies provide the structure and discipline needed to respond effectively. For those willing to study the charts and respect the patterns, Technical Stocks offer opportunity, flexibility, and tactical advantage in today’s complex trading landscape.
0 notes
Text
Mastering Technical Analysis: The Key to Smarter Trading

Technical analysis plays a crucial role in professional trading by helping traders understand market trends, price movements, and potential trade opportunities. By analyzing historical price data, chart patterns, and technical indicators, traders can make informed decisions and manage risks effectively. Those looking to deepen their expertise often enroll in an Advanced Technical Analysis Course, which covers advanced strategies and market dynamics.
Understanding Technical Analysis
Unlike fundamental analysis, which focuses on financial statements and business performance, technical analysis relies solely on price action and market behavior. It operates on the premise that all relevant information is already reflected in the price and that patterns tend to repeat over time.
Key Components of Technical Analysis
Price Charts: Different types of charts, such as line charts, bar charts, and candlestick charts, visually represent market movements.
Support and Resistance Levels: These are critical price points where buying or selling pressure typically causes the market to stall or reverse.
Trend Analysis: Identifying trends (uptrend, downtrend, or sideways) helps traders align their trades with market momentum.
Technical Indicators: Popular indicators like Moving Averages, RSI, MACD, and Bollinger Bands assist in analyzing market conditions.
Chart Patterns: Recognizable patterns like Head and Shoulders, Double Tops, and Triangles indicate potential price reversals or continuations.
Application in Professional Trading
Technical analysis serves as the foundation of professional trading by helping traders identify optimal entry and exit points, manage risks, and make data-driven decisions. It is also widely used in algorithmic trading, where automated systems execute trades based on technical signals. Understanding advanced concepts such as Fibonacci retracements, Elliott Wave Theory, and volatility-based strategies can enhance a trader's market insights. Many traders refine these skills through an Advanced Technical Analysis Course, which provides hands-on training for real-world trading scenarios.
Limitations of Technical Analysis
While technical analysis is a powerful tool, it is not foolproof. Market conditions can change due to external factors such as economic news, geopolitical events, and sudden shifts in investor sentiment. False signals are common, which is why many traders combine technical analysis with other research methods to improve decision-making accuracy.
Conclusion
Technical analysis is an essential skill for traders, providing a systematic approach to analyzing price movements and market trends. Mastering advanced techniques can help traders refine their strategies and navigate complex market conditions with confidence. For those seeking in-depth knowledge, Money Plant Trading Academy offers an Advanced Technical Analysis Course in Ahmedabad, designed to enhance trading skills and market understanding.
0 notes