#bollinger bands
Explore tagged Tumblr posts
Visit Tumblr Blog
Explore Tumblr blogs with no restrictions, modern design and the best experience.
Last Seen Tumblr Blogs


Fun Fact
In February 2021, Tumblr had 518.6 million blog accounts.
Text
Trade Gaps in Forex Market
The forex market, known for its high volatility and liquidity, presents numerous opportunities for traders to capitalize on price movements. One such opportunity arises from trade gaps. Understanding and effectively trading these gaps can significantly enhance a trader’s profitability. This article delves into the concept of trade gaps, exploring their causes, types, and strategies for trading…
#Bollinger Bands#Entry and Exit Points#Forex#Forex Market#Geopolitical Events#Liquidity#Market Sentiment#Market Volatility#Moving Average#Price Movement#Price Movements#Profitability#Relative Strength#Risk Management#RSI#Stop-Loss#Trading Strategies#Trading Strategy#Trading Volume#Volatility
4 notes
·
View notes
Text
BBTrend, Bollinger Bands, Bollinger Bands %B, Bollinger Band Width & Bollinger Bars: Ghid Complet
Introducere În lumea analizei tehnice, indicatorii de volatilitate și de trend sunt esențiali pentru a evalua starea pieței și a identifica oportunități de tranzacționare. Acești indicatori oferă o imagine detaliată asupra mișcărilor de preț, ajutând traderii să observe dacă piața se află într-un trend clar sau într-o fază de consolidare. În acest ghid vom explora cinci indicatori importanți care…
#analiza tehnica#strategie de tranzacționare#Bollinger Bands#semnale de tranzacționare#volatilitate#suport#rezistență#Piața Financiară#indicator tehnic#fluctuații preț#BBTrend#Bollinger Bands %B#Bollinger Band Width#Bollinger Bars#benzi Bollinger
0 notes
Video
youtube
The Ultimate Bitcoin Trading Strategy: Unveiling the Secrets to Crypto Wealth on BingX!
#bitcointrading #cryptowealth #BingXplatform #tradingstrategy #technicalindicators #movingaverages #BollingerBands #RSI #supportandresistance #priceaction #cryptonews #marketanalysis #cryptoprofits #cryptoGains #BingXtools #advancedcharting #analytics #execution #lowfees #personalizedmarketanalysis #tradingsignals #advancedordertypes #riskmanagement #cryptomillionaire #BingXreferralcode
#youtube#bitcointrading#cryptowealth#bingxplatform#tradingstrategy#technicalindicators#technical indicators#movingaverages#moving averages#bollingerbands#bollinger bands#rsi
0 notes
Text
Bitcoin Poised for Major Surge, Bollinger Bands Indicate
According to the Bollinger Bands, Bitcoin might face a substantial market surge, potentially setting a new all-time high of $190,000. The technical state of the asset and the general market trend both play crucial roles in this prediction. Also Read: Michael Saylor Declares Bitcoin the Top Asset, Citing Superior Performance and Value Storage Historical Compression of Bollinger Bands Indicates…
0 notes
Text
Explore Why Bollinger Bands Are A Popular Tools With Forex Traders

This article aims to delve deep into the popularity of Bollinger Bands from a Forex trader's perspective.
0 notes
Video
youtube
Bolstering Profits Unveiling the Power of Stochastic and Bollinger Bands...
#youtube#stochastic#Bollinger bands#swing trading strategy#Stochastic and Bollinger bands swing trading strategy
0 notes
Link
Tyler Culbertson’s fever dream for a lasagna commodities index fund added to NASDAQ in an IPO celebration with Nounish Cryptoadz by Gremplin and Cryptopunks. Whadda vibe!
Speaking of index funds. We love the Q’s...ya know QQQ
BTW this is NIA...Not investment advice. Clearly issa meme.
#cryptopunk#beeple#tyler culbertson#cryptoadz#gremplin#cc0#nasdaq#stonk memes#stock memes#investing#finance#stock market#bollinger bands#hot fresh vibe#nft memes#ofcode#dogetoad#noggles#nounish#nyc#ipo#initial public offering
1 note
·
View note
Text
📊 Bollinger Bands, the ultimate trading strategy
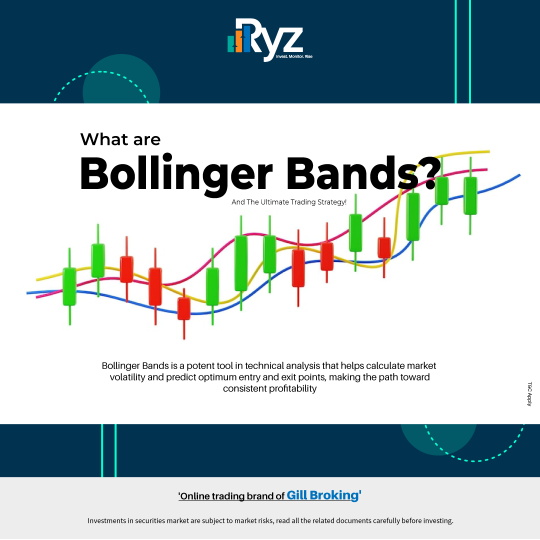
📌 Bollinger Bands: Recognize market turbulence and master entry-exit opportunities for profit.
☑ Why Bollinger are Bands the Ultimate Strategy ❓
▪ Versatile: Easily integrates into a range of financial markets, from equities to foreign exchange.
▪ User-friendly: Compatibility with other technical indicators and usability for new traders.
▪ Risk management: Effective loss management is provided through the use of stop-loss orders and exit signals in risk management.
▪ Identification of trends: Produces essential signals for navigating market volatility.
Explore more at 👉
Download the mobile app👉
0 notes
Text
Technical Analysis in a Nutshell
Technical analysis is a method used to evaluate and forecast the price movements of financial instruments, such as stocks, commodities, and currencies, by analyzing historical price data and trading volumes. Unlike fundamental analysis, which focuses on a company’s financial health, technical analysis relies on patterns, trends, and statistical indicators to make trading decisions. This article…
#Bollinger Bands#Chart Patterns#Divergence#Entry and Exit Points#Exponential Moving Average#Financial Markets#Fundamental Analysis#MACD#Market Movements#Moving Average#Moving Average Convergence Divergence#Oversold Conditions#Position Sizing#Price Charts#Price Movement#Price Movements#Relative Strength#Risk Management#RSI#Security#Stop-Loss#Support And Resistance#Technical Analysis#Trading Decisions#Trading Strategies#Trading Volume#Trend Lines#Volatility
2 notes
·
View notes
Text

Forex MT4 Plataform, #BUY SWING TRADE #US30Cash INDEX $4.100 Profits. Official Website to have access: wWw.ForexCashpowerIndicator.com . Forex Cashpower Indicator Lifetime license one-time fee with No Lag & Non Repaint buy and sell powerful Signals with Smart algorithms that emit signals in big trades volume zones. Works in all Charts inside your Broker MT4 Plataform and all timeframes . ✅ NO Monthly Fees ✅ NON REPAINT / NON LAGGING 🔔 Sound And Popup Notifications 🔥 Powerful & Profitable AUTO-Trade Option . ✅ ** Exclusive: Constant Refinaments and Updates in Ultimate version will be applied automatically directly within the metatrader 4 platform of the customer who has access to his License.** . ( Ultimate Version Promotion price 60% off. Promo price end at any time / This Trade image was created at XM brokerage. Signals may vary slightly from one broker to another ). . ✅ Highlight: This Version contains a new coding technology, which minimizes unprofitable false signals ( with Filter ), focusing on profitable reversals in candles with signals without delay. More Accuracy and Works in all charts mt4, Forex, bonds, indices, metals, energy, crypto currency, binary options. . 🛑 Be Careful Warning: A Fake imitation reproduction of one Old ,stayed behind, outdated Version of our Indicator are in some places that not are our old Indi. Beware, this FAKE FILE reproduction can break and Blown your Mt4 account.
#US30Cash#forex index#usd30cash#us500cash#us30cash#best forex trade system#forex volume indicators#nt4 bollinger bands#mt4 fibonacci#metatrader4 fibonacci
3 notes
·
View notes
Text
Bollinger Bands Indicator: Understanding the Bollinger Band Formula

Bollinger Bands Indicator: A Complete Guide
Introduction
If you've ever looked at a stock chart and wondered what those three lines moving along with price mean, chances are you've seen Bollinger Bands. This simple yet powerful tool helps traders understand price volatility and market trends. But how exactly does it work, and why is it so widely used? Let’s dive deep into the world of the Bollinger Bands Indicator and its formula.
Discover how the Bollinger Bands Indicator works, learn the Bollinger Band formula, and master its application in trading strategies for better market insights.
What Are Bollinger Bands?
Bollinger Bands are a technical analysis tool created by John Bollinger in the 1980s. They consist of three lines:
A middle band, which is a simple moving average (SMA)
An upper band, which is SMA plus a multiple of standard deviation
A lower band, which is SMA minus a multiple of standard deviation
These bands expand and contract based on market volatility, helping traders gauge overbought or oversold conditions.
The Bollinger Band Formula Explained
The Bollinger Bands Indicator is calculated using the following formula:
Middle Band (MB) = Simple Moving Average (SMA) over N periods
Upper Band (UB) = MB + (K * Standard Deviation)
Lower Band (LB) = MB - (K * Standard Deviation)
Where:
N = Number of periods (typically 20)
K = A constant, usually set at 2
How Bollinger Bands Help Traders
Bollinger Bands are used to assess market volatility. When the bands contract, it signals low volatility, while expansion signals high volatility. Traders use these indicators to predict price movements.
Understanding Bollinger Band Width
Bollinger Band Width (BBW) measures the distance between the upper and lower bands. It provides insight into market conditions and potential price breakouts.
Bollinger Bands vs. Moving Averages
While moving averages smooth price data, Bollinger Bands go a step further by incorporating volatility, making them more dynamic and insightful.
How to Use Bollinger Bands in Trading
Breakout Strategy: A price move outside the bands often signals a strong trend.
Reversal Strategy: When the price touches the upper or lower band, it may indicate a reversal.
Common Bollinger Band Trading Strategies
Bollinger Squeeze: A tight squeeze often leads to a breakout.
Mean Reversion: Price tends to return to the middle band after touching the outer bands.
Double Bottoms & Tops: Identifying potential reversals with Bollinger Bands.
Limitations of Bollinger Bands
Bollinger Bands alone are not foolproof. False signals can occur, and traders should combine them with other indicators for confirmation.
How to Avoid Common Mistakes
Relying only on Bollinger Bands for trading decisions
Ignoring fundamental analysis
Using inappropriate settings for different assets
Best Practices for Using Bollinger Bands
Combine with RSI or MACD for confirmation.
Adjust settings based on asset type.
Use historical data for backtesting.
Bollinger Bands in Cryptocurrency Trading
Cryptocurrency markets are highly volatile, making Bollinger Bands a great tool to spot price breakouts and trends.
Bollinger Bands in Stock Market Analysis
Stock traders use Bollinger Bands to identify overbought and oversold conditions, helping with better entry and exit points.
Advanced Bollinger Band Techniques
Bollinger Bands with Keltner Channels: Helps confirm breakouts.
Using Bollinger %B: Measures the price position relative to the bands.
Final Thoughts
The Bollinger Bands Indicator is a powerful tool for traders of all levels. Understanding the Bollinger Band formula and applying it effectively can improve trading decisions. However, it’s best used in combination with other technical indicators to minimize risks.
FAQs
What does it mean when Bollinger Bands tighten?When Bollinger Bands contract, it indicates low volatility and often precedes a strong price movement or breakout.
Can Bollinger Bands predict market trends?Bollinger Bands help identify market conditions but should be used with other indicators for trend confirmation.
What is the best setting for Bollinger Bands?The standard setting is 20-period SMA with a 2-standard deviation, but traders can adjust based on their strategy.
Are Bollinger Bands useful for day trading?Yes, they help identify short-term price movements and volatility, making them useful for day traders.
How do Bollinger Bands work with RSI?RSI helps confirm overbought and oversold signals from Bollinger Bands, improving trade accuracy.
0 notes
Text
youtube
📌 Trader sans INDICATEURS : Découvrez pourquoi c'est risqué !
📈 Vous pensez que toutes les informations nécessaires au trading se trouvent directement dans les cours ? Bien que les prix reflètent une multitude de données, les indicateurs techniques jouent un rôle crucial pour interpréter ces informations et affiner vos décisions de trading.
Dans cette vidéo, nous explorerons : ✅ Pourquoi les indicateurs techniques sont essentiels même si les cours contiennent déjà beaucoup d'informations ✅ Comment ces outils peuvent améliorer votre précision et votre efficacité en trading ✅ Un exemple concret de leur utilité Les indicateurs fournissent des perspectives supplémentaires qui ne sont pas toujours évidentes en observant uniquement les cours. Ils aident à identifier les tendances, les points d'entrée et de sortie, et à gérer les risques de manière plus efficace.
🔥 Ne sous-estimez pas la puissance des indicateurs techniques. Ils peuvent transformer une simple observation des cours en une stratégie de trading gagnante.
📢 Regardez cette vidéo jusqu'à la fin pour découvrir comment intégrer efficacement les indicateurs dans votre analyse et optimiser vos performances de trading.
#stock market#tradingview indicator#meilleurs indicateurs#top indicateurs#trading strategy#day trading#swing trading#meilleurs indicateurs techniques#meilleurs indicateurs pour le scalping#trading facile#crypto trading#trader efficacement#stratégies de trading#scalping#thami kabbaj#indicateurs techniques#RSI#bandes de Bollinger#stratégie de trading#outils de trading#gestion des risques#tendances de marché#efficacité en trading#signaux de trading#analyse des marchés#Youtube
0 notes
Text
Learn The Bollinger Band Scalping Strategy For Reliable Forex Analysis
This article aims to delve into the intricacies of the Bollinger Band scalping strategy, outlining its key components, entry and exit signals and risk management techniques.
0 notes
Video
youtube
Mastering Forex Trading Unleashing Profit Potential with the Bollinger B...
0 notes
Photo

Lorenzo and Tyler Culberston are working towards introducing a broad-based lasagna commodities index to be added to the NASDAQ Exchange in 2024
#lorenzo#nounish#bollinger bands#tyler culbertson#nasdaq#blue chip stocks#cryptoadz#cryptoads#commodity markets#commodities#stonks#stock market#memes#bloomberg terminal#index fund#gremplin#pixel art#animation#8 bit#finance#qqq
1 note
·
View note
Text
The Power of Bollinger Bands: 5 Key Factors for Advanced Stock Market Analysis and Profitable Trading Strategies
Gain a competitive edge in the stock market with advanced analysis using Bollinger Bands. Learn how to calculate, interpret, and implement highly effective trading strategies for optimal profitability.
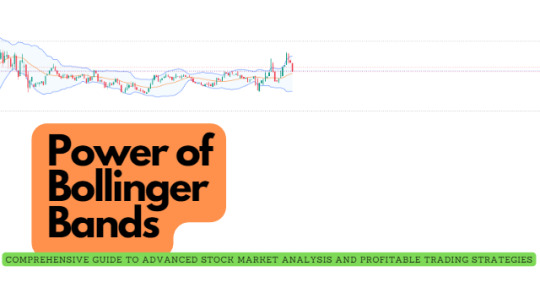
Bollinger Bands, developed by John Bollinger in the 1980s, are widely recognized as a popular technical analysis tool used by traders and investors to assess price volatility, identify trend reversals, and formulate effective trading strategies. In this article, we will delve into the concept of Bollinger Bands, including their calculation, interpretation, and various strategies for implementation.
What are Bollinger Bands?
Bollinger Bands consist of three lines plotted on a price chart: the middle band, upper band, and lower band. The middle band represents the simple moving average (SMA) of the asset’s price over a specified period, typically 20 days. The upper and lower bands are calculated by adding and subtracting a certain number of standard deviations (usually two) from the middle band.
Calculation of Bollinger Bands: Continue reading
OTHER TOPICS:
Mastering the 5 EMA
GDP Data: Economic Growth and Stable Inflation
Strong Economy: Understanding and Impact
How to Safeguard your Investments During a Market Decline?
#StockMarketAnalysis #BollingerBands #TradingStrategies #TechnicalAnalysis #ProfitableTrading #investment #trading #forex #forextrading
#Advanced Bollinger Bands#stock market analysis#profitable trading strategies#technical analysis#price volatility analysis#trend reversal signals#charting tools#optimize trading profits#Investoropia#forextrading#forextips
0 notes