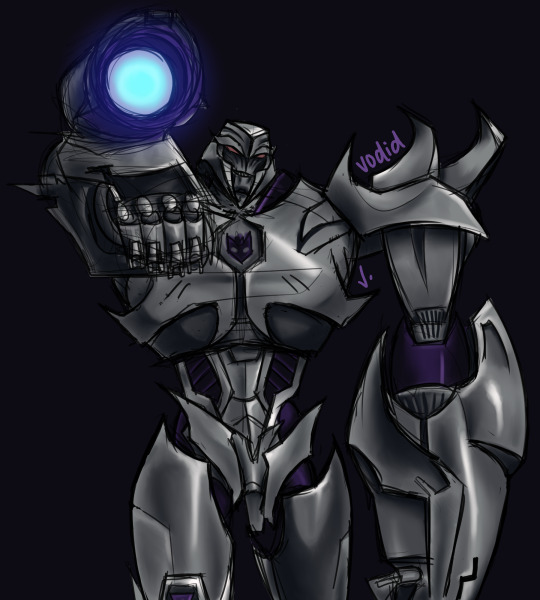
#Needing to think a LOT about colors. Because simplicity would be easier but drawing in black and white..
Note
my toxic trait is looking at your art and thinking that i could do that too. everytime i try drawing Transformers it ends up lookin like a pile of metal that got ran over by two semi trucks blasted to cybertron and back then got the shit beaten out of it by Optimus Prime himself 😭
but fr though, how do you do it? like what kinds of shapes are they made of? how do all their weird alien metal parts move?
what may work for my style might not for you, as i've unfortunately learned through my years of yearning for/trying out another artist's skill, and that's okay. but i am very honored to be that kind of artist to you 💗 beating yourself up for not being like me won't help you, though 🥹 your art is great, regardless of if it looks like mine or not. i'm going on 7 years of doing this after all! (also i started with bayverse of all things 😵)
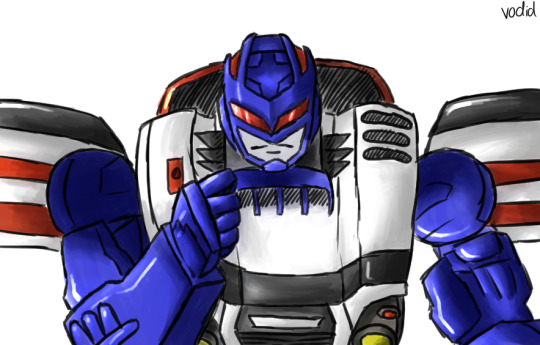
and honestly, a lot of it is just experimenting and finding what's right for you, what you need to improve/improvise on, and what you want out of your art. for me, i found that i have a very difficult time actually getting that sharp, blocky industrial style of robots down and eventually opted for a more organic, squishier look. but i do maintain their proportions as they're wildly different from a human's ghsdfsjs
you're already off to a great start doing exactly what i did to learn: redrawing screenshots from the shows. i learned most of what i know from tfp, with a lot of bayverse and g1 mixed in there. it took me about two years of that before i felt confident enough to start making original art consistently. it takes time (and tbf, i was still learning how to art in general when i started. so you really are off to a great start)
this is the kind of art i made in 2017:
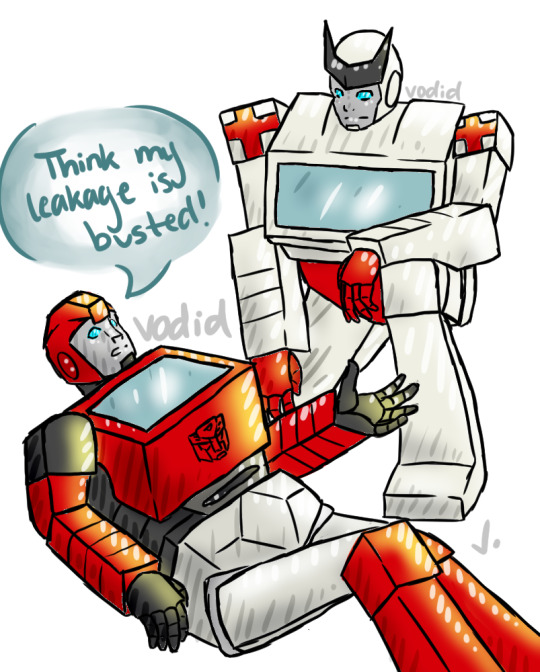
massively different from my art now, right? through all these screenshots, i'd test out new ways to draw and color. at one point, every piece i made was trying something new. and it was okay if it didn't work out. means i know what not to do next time lol generally though, i'd NEVER do lineart. i mostly focused on building up my sketching and coloring skills, as seen here in my 2018 art:
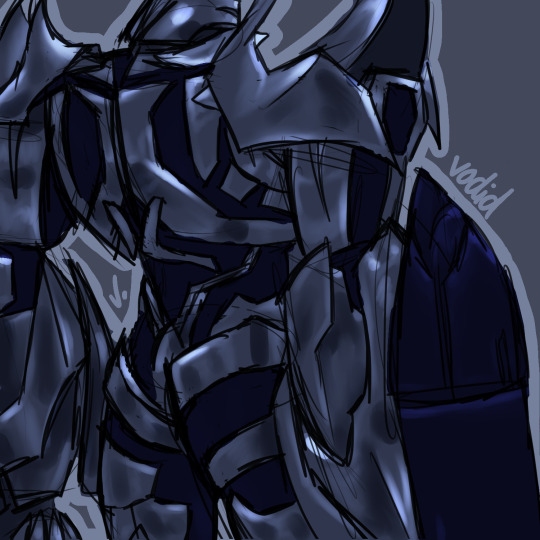
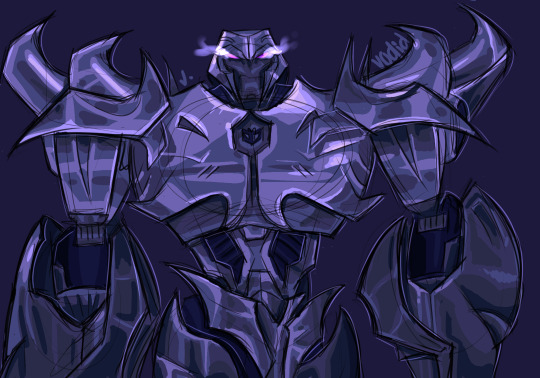
and that kind of fucked me over for life so now i am left with painting over the sketch 😂 i digress though
in all honesty i've spent my entire art career figuring out how the fuck all their weird alien metal parts move 💀 a lot of it is BSing, some is recycling the same poses to make things easier on yourself and the rest is studying studying studying. cannot tell you the amount of times i've rewatched certain bayverse scenes frame by frame to figure out how all their parts move in tandem — i still don't know! 😅 g1 was a nightmare to figure out because of its blocky simplicity and limited range of motion. it's still a struggle to this day haha
it's really difficult how to explain how exactly i draw transformers, as it's just... something i do nowadays. there's not a ridiculous amount of thought put into it since i've built up my skill. but here's generally how i sketch their bodies and what shapes i use:
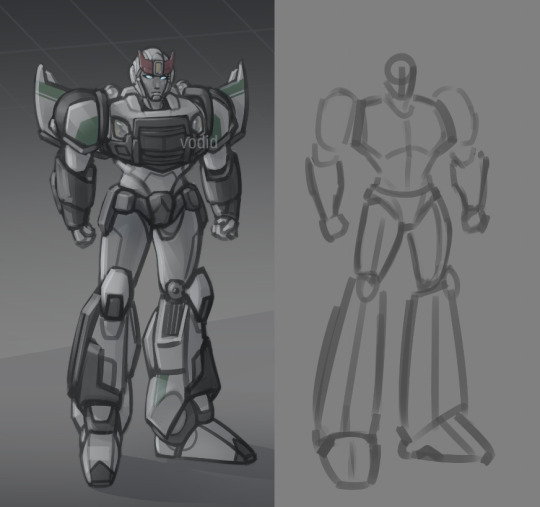
the first is slightly different as its a more detailed approach than g1 so just imagine the arms are a little rounder — "marshmallow," as my brother would call it — like the sketches in the second (even if those are a little more advanced in the process than the first)
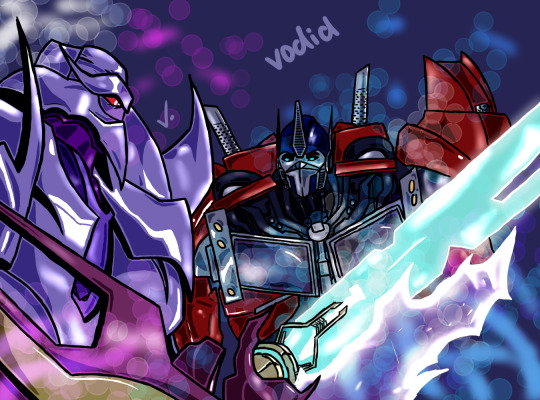
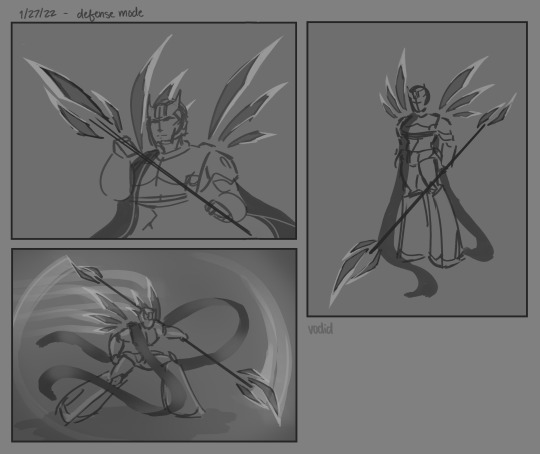
my best advice to you is to learn their proportions and articulation via redrawing screenshots — various ones! i chose the most dynamic poses for my megatron practices in 2018 to nail it in my head lol but yes shows like tfp and earthspark are great for that (you could probably even do with looking at the storyboard animations for earthspark to help!)
and remember, i'm still learning too! i'm not gonna pretend like i know what i'm doing. but i'm glad i inspire you :)
12 notes
·
View notes
Text
Gonna deal with all of the asks about the male bodysuits versus female bodysuits in one post:
Anonymous said:
To paraphrase a quote from Doctor Doofenshmirtz, "She's 13/14!"
The age of consent in France is 15, you storyboarding weirdos, and that still wouldn’t make it right.
Anonymous said:
the whole ‘skin tight body suit’ is practical is the sense that you can just draw the anatomy and color in without adding stuff but in that aspect it’s also cheap
Anonymous said:
I always thought the reason why every hero wears a skintight jumpsuit was so it'd be easier for them to be animated. Still doesn't explain all the closeups of Ladybug's ass.
Oh, I fully understand the need to keep things not... “flowy.” That’s why you won’t see me asking for more complex things like wings/capes and just talk about very basic armor/padding. I’ve made 3D models before so I understand that having a lot of physics going on can be a hassle, and thus I avoid designs like that unless I’m just having fun.
But yeah, definitely doesn’t explain the close-up shots.
Anonymous said:
I love the spider marinette design but yeah I didn’t really get why they went with such a basic design either but then again they made hawk moth a fashion designer has created Akumas like the bubbler.
Thanks! I’m glad people like my redesign! (well, more like “me just using Spider-man as a reference”)
And yeah, they really don’t keep in mind the characters personalities in most of the designs or names.
Anonymous said:
This is a really dark idea, but I'm just imagining whenever Marinette detransforms, she takes a few deep breaths because of how constricting her supersuit is.
Okay, so Alya is basically dead then.
Anonymous said:
I guess they didn’t want Natalie exposed like the other girls because I might make the weirdness of the skin tight bodysuits apparent.
Agreed. It’d be even more obvious on the body of an adult woman. Nathalie’s also another person who gets slimmed down in her transformed state soooo, yeah.
libralizard said:
Is it odd that (now that you’ve put them next to each other) I’ve only just noticed that MisterBug had a waaaay better design than Ladybug? With the black accents to make the dotted red parts pop more - Just like you showed with your spider man comparaison. If they can give Adrien a good Ladybug herosuit, why can't Mari get that sort of treatment with hers?
The difference between Mister Bug and Lady Noire is insane, honestly. Mister Bug gets all that padding and the more complex Ladybug design while you can literally see where Lady Noire’s ribcage is and she just gets this all gray bodysuit with none of the cool stuff that Chat Noir had (like, I legitimately don’t understand what they were doing with her design).
Anonymous said:
I saw someone online say that they liked the simplicity of Ladybug's costume because they thought it sent the message of "I'm here to save Paris, I don't need a fancy costume." Ignoring the fact that she didn't expect the transformation in Origins, it's clear that person forgot that Marinette is a FASHION DESIGNER! By all means, she should have a fancier outfit than the one she's given. Maybe a frilly Lolita dress and a new hairstyle(this IS Magical girl after all)? But no, femininity is bad.
I could see the argument against a dress - not because of the “it’d be harder to work with” argument - but because of the physics issue I mentioned above (a few asks ago).
...I guess an argument could be made considering Mayura has one though.
They could have more feminine outfits and such if they really wanted, but instead they just do bodysuits that end up looking really generic.
Anonymous said:
Could you show us an edit of what the girls would look like with padding/the boys would look like without padding? I just want to see the difference for myself. ;) And yeah, the tight, sexualized outfits of the ladies always irritated me, it's why I like Mayura's the best, since it looks more individualistic and her dress makes her resemble a magical girl more than the others, who just look like generic comic book superheroes. The poses only make it worse, especially Ladybug and Rena Rouge.
I don’t think I would have the skills to edit/remove padding is the only thing. I’m also not great at design so I wouldn’t know where to put padding if it was there.
The other thing is that it isn’t just padding. In the post with the edited Ladybug using Spider-man as a reference. I point out that it’s not totally about the padding; it’s also the colors and where they’re used, as well as the complexity of the design (like, Chat Noir VS Lady Noire is both a padding issue and a complexity issue, not a color issue, among other things).
This basically means that adding padding doesn’t automatically solve the problem. It helps, but doesn’t solve the problem.
116 notes
·
View notes
Text
Little late getting to these -- that's fully the fault of a class project I spent all of Monday/Tuesday and most of Wednesday working on -- but I finished my project and wrote up some long replies to these!
(Apologies for any funny formatting -- I'm trying out the beta for the new post editor!)

Absolutely not.
Nope! There are a few people who do know (other guides Andrew's met before, the Dryad, and I'd imagine the Witch Doctor knows something's up even if he doesn't know why), but none of them live in Purity Town proper, and the Dryad and Witch Doctor aren't the kind to participate in rumors or spread what isn't theirs to share. The old man is also aware just because he and Andrew have talked about their curses, but he's 1) not currently in town and 2) not going to share even if he were.
Most folks don't know much about Andrew in general; Becca probably knows the most out of the townsfolk, knowing a little bit about his family and where he's from (he has some pretty specific skills as a hunter that betray this, but he doesn't talk about his exact town of birth), but no specifics and certainly not time periods.
Andrew is good at keeping things quiet; he has to be.

I would actually appreciate if you didn't post to Pinterest -- usually I'm fine with people reposting with credit (several of the things I've posted to my DeviantArt have found their way to Instagram, for example) but Pinterest has something of a reputation for stolen art (things being reposted from another Pinterest post without credit this time, or credit being hard to view for users not logged in or just viewing through Google). So reposting elsewhere is fine (though if you repost to Reddit or Instagram, tag me at u/Ariibees or @Ariibees)! I'd just prefer my works stay off of Pinterest.

The terminology related to The Guide/Andrew/The Guardian/The World’s Core/The WoF is all confusing because on some level, they’re all the same being. Kind of like trying to talk about Jekyll and Hyde -- same guy, different looks/actions, haha.
For all intents and purposes, references to the WoF being the barrier/core/whatever behind or within which the spirits of light and dark are contained is equivalent to saying “these spirits are held trapped by the magic of the Guardian, who when summoned appears as the WoF.” I do break slightly from the official lore in how the WoF/Guardian/thing holding back these spirits works (mostly because I don’t really like the idea that the Hallow is a “temporary guardian” or whatever), but the basic concept of “these are trapped by [thing that makes up the WoF]” remains unchanged.
If “loony cultist” is a reference to something, I’m so sorry, but I’m lost on it. If you’re just talking about the lunatic cultist in a funny way, then yes, they’re in here as a very plot-significant character!

I had to google what meme you were talking about, but it did make me laugh.
Andrew’s most annoyed by the nickname because people do like to call him Guide, and for someone who’s dedicated his whole life to his role, it can get tiring. He doesn’t really *mind* being called Guide -- it’s fine, that’s what he is and as long as people are respectful of his job he’ll take what he can get -- but at the same time, he’d like for people to stop thinking “Aah! Monster!” or “Weird academic know-it-all” and just...treat him like a normal person sometimes. So he fights to be called Andrew. And...Malik comes along and gives him a nickname that he doesn’t like and doesn’t allow others to use, save for maybe a small group of people of which Malik is not a part. So, not cool, man!

People love to overcomplicate explaining shading/lighting, and if you wanted to you could certainly go on and on about reflections of light off the ground and shading colors and all sorts of things, but as I’m writing this at 1 AM I don’t really care to.
If you really want to get into shading, I see nice ones on DeviantArt or Tumblr from time to time, or you can always watch a YouTube video on it. Really, though, just keep at it, think about how the shadows should look and work, and you'll get better at it eventually and pick up new ideas on how it all works. (And this is coming from someone who is new to making comics and actually started as a painter.)
Purity Town’s shading comes down to this: simplicity. As much as I’d love to spend hours and hours redrawing the panels I don’t like and carefully shading every fold of fabric and painting detailed backgrounds, I’m a full-time college student and will be working full-time over the summer -- I don’t have the time. So, I cut corners: I reuse backgrounds or use brushes (see: bricks, trees, clouds) that make certain details easier, and I try not to obsess too much over panels I’m not fully happy with. Shadows go where they feel right, and light on the opposite side.
For shading, this comes down to making things quick and easy. For these last few pages, character shading/lighting has only been five layers. One hard light layer for the bluer soft shadows, one overlay layer for darker soft shadows, one linear burn layer for hard shadows, one soft light layer for soft lighting, and one overlay layer for hard lighting. I’ll often also make use of glow dodge layers for lighting, or change the color balance or add more hard/soft light layers if there’s a very heavy color filter on the scene (such as a celestial event, blood moon, or outdoors at night).
Using all the different layer types is essentially a cheat code to fancier lighting -- don’t want to use flat black? Boom, hard light or overlay or burn will give you colored shadows. Want to make your light brighter? Glow dodge will make it burn your retinas.
Sorry that this isn’t a very comprehensive guide, but in my mind, shading and lighting is really something that you pick up over time and it’s hard to sit down and write a guide for it without making it into a massive essay on art theory that I don't even know proper terminology for because I'm not an art student. Of course with some googling you’ll find *proper* guides for this sort of thing from art majors and the likes, and those can be super helpful and technical! But for Purity Town, I just sort of go with what feels right and what's easy to replicate.

Firstly, I’m happy to hear you’re liking the comic!
Secondly, those buttons are actually there due to the theme! (For those on mobile who can’t see it, I have the theme set to only display on desktop as I prefer the current mobile layout on phone.) I’m using the simple webcomic theme (a quick Google should tell you how to install it for yourself) -- except I’m not actually using it for the webcomic features; rather, it’s a case of “this is the most simple, nice-looking non-default theme I could find.”
The previous/next buttons are added by the theme with the intent that the blog is being used as a typical webcomic website, with nothing but comic pages being posted. However, I post asks and other art here too, and I do so with the intent that people looking at #Terraria or their dashboards in general will see it. So...I use html formatting to make the first/previous/next/last links, along with an index and chapter-by-chapter viewing (using /tagged/chapter##/chrono) so that no matter where you’re coming from, you can still navigate just the pages!
If you want to add just the previous/next buttons, I can’t really help you -- web development is not my area of study in the slightest. But you can check out the theme that they come from and if you want to install only them, you can surely find a tutorial on it somewhere!
(As a side note, the comments section is not from the theme, it’s from a site called Disqus. I don’t expect many people, if anyone, to leave comments, but since I link back to this site a lot and many folks don’t have Tumblr accounts, it’s an option I like to make available.)

Hiya! My hike was pretty nice; it was a short and easy one, but that was quite appreciated as the trail is unmaintained from November to April, and the trail was covered in fallen trees and quite rocky. Still had fun, though!
And for backgrounds, it depends! For indoors scenes (or outdoors scenes with buildings) I don’t tend to use references, outside of looking up things like “which side of a door is the handle on.” I will, however, integrate real-life textures (see: the quilt and rug in Guide’s house, the wood walls on the building in the background of this week’s page), and paint over paintings from the Terraria wiki.
For outdoors scenes, for simple backgrounds (such as foliage-heavy) ones, I typically don’t need references. I like the difference between detailed, lined indoor/man-made object scenes vs. painted, messy outdoor scenes. But for things like mountains, I do sometimes look up references to help with color choices and the likes.
The town’s layout is a bit strange in that depending on the scene, the background could be drastically different. One side of town faces more mountainside, one side faces the orchards/open hillside, and the other two sides face various degrees of open space and more mountainside/forest. References taken on top of mountains are helpful to get an idea of what degree of foliage I should include between the characters and the sky.
Though this is very specific to the town of Purity -- other towns/villages will have significantly different-looking backgrounds, even the foliage-heavy ones.
That said, what's even more helpful than looking at photos is looking at paintings. Spirit: Stallion of the Cimarron is really good for getting an idea of how to draw grasslands and distant mountains, plus Studio Ghibli movies in general!
17 notes
·
View notes
Text
Bad Cody, You made a bad robot suit Cody bad boy bad boy go sit in the corner
This is a very long post talking about POWER ARMOR. It has nice pictures. Keep reading if you’re a friggin’ neeeeeeeeerd
It’s no secret that I LOVE power armor.
When I started writing Gravity Falls fanfiction and making my own stories within that world, one of the FIRST things I did was design a suit of futuristic power armor for Wendy to wear. Here it is now.


This suit is DogShit.
And I don’t say that lightly.
I designed the suit based ENTIRELY on looks, with no thought for function whatsoever, much to my present-day shame. Back when I designed it I didn’t realize my GF stuff would become as big as it would and build up as much story and mythology as it did, so the entire thought process at the time consisted of “Oh, I’ll just take a generic Samus suit, remove details to make it easier to draw, and color it green and black”. But now, it’s many years later. And now that I’m trying to migrate away from GF, I’ve started drawing new concepts for the Time Knight suits, so I figured now would be a good time to pick apart everything this suit did wrong, and explain why I made the stupid decisions I did.
Let’s start with the jetpack.
The jetpack is designed very poorly. A human’s center of mass is somewhere around the hips, so if the jets were up here, and at this angle, they wouldn’t lift you into the air or help you jump at all, they would just flip you forward onto your face. If the suit were to have jets at all, therefore, it would need an additional set of rockets either somewhere on the legs, or on the front of the chest. I left out this additional set for reasons of artistry and simplicity, since they would be visually distracting on the legs, and I really like the durable, sturdy look that a big smooth chestplate gives to the design, so I didn’t want to interrupt the shape with rockets. Plus, the back jets would look like boobs if you put them in front, and that would be both inappropriate and silly.
Also glowing circles.
What are these glowing circles? Why are they there? I put them there because the glowing-green hourglass insignia would stand out and be real distracting if it were the only glowing green part. In my head the glowing circles were ‘Time-Inductors’, which, when active, would anchor the wearer into a fixed point in time, and thus prevent enemies from from going back and killing them ask kids or something. This is stupid because A) it doesn’t fit with the rules of time travel I established and B) why would you have them exposed on the outside of the suit where anyone could shoot them and C) why would you need 6 of them and D) why are 4 of them so smol?
Also the joints.
This is by far the worst offense on the list, if for no other reason than because I have this same complaint with most power armor in fiction in general. As far as I have seen of games and movies, mechanized suits are NEVER (with the exception of Aliens and Edge of Tomorrow and Call of Duty) depicted with structurally sound joints. This thing is supposed to be running and jumping and fighting, you know? It probably weighs about 600lbs! ALL that weight and a lot MORE has to be supported in its entirety by whatever mechanisms are present in the hips and arms. It has to be robust, and I did NOT draw it so.
I want you to specifically look at the hips and upper arm here. Observe how the pauldrons are connected to the gauntlets, and the pelvis to the thighs, by tall stacks of silver rings just like Titanium Man™. Artistically, these tall stacks of silver rings serve several purposes: A) they make the armor plates stand out nicely by contrasting the black, B) they make the audience think “Oh well, something mechanical is happening there it must be high-tech”, C) they make the suit as a whole look slightly more cartoony and comic-book-y, by calling to mind things like Winter Soldier and retro astronauts and Titanium Man™.
( Titanium Man™:)

These tall stacks of silver rings make no sense. Are there supposed to be linkages beneath them with motors? An artificial layer of muscles? There’s hardly (probably not) room for the wearer’s own arms and legs inside them, let alone anything powered. Maybe the rings themselves are filled with hydraulic fluid or something? That’s needlessly complicated and needlessly fragile, and would break the wearer’s own bones if it malfunctioned, which would be bad.
EGGGHEHEEHHEHH
Hmm.
You may have guessed already, but this suit was designed mainly based on aesthetics. But there is good news! I just drew out a bunch of concepts redesigning it! So I might post that soon.
10 notes
·
View notes
Text
Core Four
Hi! After days of my antics i had decided to show my drawings for my redrawn Descendants next to outfit clarification/ idea for my fanfiction (+ analysis because I love fashion analysis! I watched one episode of the topic and I'm hooked now-) also sorry about the poor camera quality I'll digitalize it soon 😭
So here's them all together:
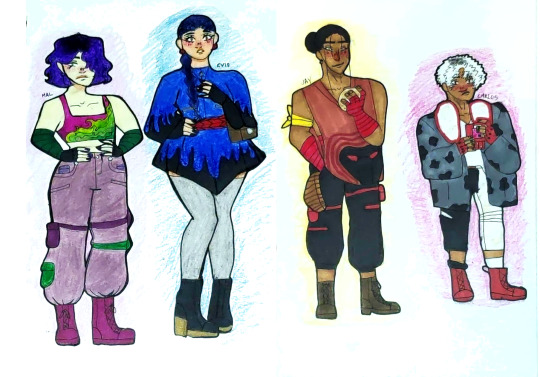
So what they have in common is the use of patterns and somewhat baggy(ish?) clothing whether it's from the top, ( Carlos, Evie) or by the pants ( Jay, Mal). The next use is pictures or patterns which is pretty predominant in Mal's side of town ( The inner city/ a good most of the Isle except anywhere near the coast. Which is known to be Uma's side of town.) 9 times out of 10 you would see a lot of painted clothes with patterns or designs, pieces of leather or cloth in clothing that can form a pattern or pictures. It is very popular on the Isle to wear gloves, bandages, and something you can at least move in because sometimes certain areas get congested and you might have to jump from a building time to time, run away from a troll, or fight. Also it's good to wear clothes that hide stuff you stole or hide weapons compared to Uma's side of town where you kinda just casually have a dagger or sword out. The inner city fashion is a mix of military, grunge, and goth depending on where you are. And it also reflects in the fanfiction in their Auradon fashion which I'll describe later. Their outfits together all clash but it's unified in one shape or pattern which also presents their friendship.
MAL

So Mal doesn't have fear as she usually doesn't worry about being randomly shanked out of nowhere. Seen here I kept her purple/ green aesthetic but I used a very minium of pink which was her top which was magenta. Her outfit is quite girly tomboyish. Her top is a repurposed binder that she cloth dyed and painted green flames on. I did this changes because she's more of the rambunctious one in the group next to Jay so her clothes are fitted in the purposes of movement next to the fact of her always stealing and running away which I felt that the leather jacket limited her upper body in her og design, I do love the leather don't get me wrong! But it's more practical in fall/winter (assuming that it's pretty tight) than spring and summer which is when my fanfiction takes place. However the use of leather is shown in her pants as the her pockets is dyed leather. Her hair is more blunt like cut and a deeper purple more toward her hair in D3 (Which was the color I like the most) but it's not a long asymmetrical bob it's just a blunt cut bob and she keeps it that way for a while. She aims for that casual militant fashion a lot, as some of her outfits won't look like what is the one above since she's not jumping place to place in Auradon would lean towards edgy and militant for a while until Coronation and later in the series where it leans more like EGIRL/Prep as her hair gets longer and is just plain black and cut again so she would wear a baggy clothes with combat boots in darker shades of purple and green while some of her shoes consist of designs of her own graffiti in the earlier parts and eases slowly into more to skinny jeans and a shirt that's stuck in with some canvas shoes. You notice how her outfits would present a very dominant leader energy because her outfits would stand out a lot when she stands with the group. Reflecting her always in control and assertive role as leader in the group. Whether in maybe the graphics on her shirt or the pattern until later where her and the core four all equally stand out in their own ways but not clash with one another and she's not trying to outshine any of them. So her style choices in the beginning reflects how she sees herself more of a pawn to her mother and more of someone was placed in charge due to her mother's orders which makes her prone to have a harder time shifting from that mindset in the beginning.
EVIE

Her outfit is very male gaze oriented, intentionally as presented on how she was raised so how she dresses is out of place for normal people on the Isle that live more in the inner city as she dresses more for fashionable and what the Isle consider Auradon like. However don't get it twisted because her outfit is quite practical than one thinks. Her outfit is a dress with attached shorts that is hard to see due to her dress because she dresses in a way for the male gaze. Her sleeves are utilized in a way that she can keep weapons. Any weapon. Same applies to her dress skirt the cut is makes her capable of sneaking in a knife or something same rules don't apply to her purse as it just keeps makeup and a mirror in hand for quick access. Her dress is pretty tight at the waist as her mother always say "tinier the waist the better" and the closest thing of love she got from her mom is that she complimented her waist so her outfits then on compliment her waistline. Her colors are still blue and red as her mother thinks that what works because Snow White but later on she will have mementos of her mother's colors of red, black, purple, greens, and gold albeit jewelry or clothing pieces. Her shoes aren't made for any parkour. Most of her shoes are heels. Mother says a girl in heels fluctuate the legs. Her hair is in the braid as it makes her face pop out more, it represents also the strict beauty guidelines she follows due to her mother's influence so her hair will always be up and tight until later on she starts wearing it loser to present how confident she is in her skin. Her hair leans towards a black blue color it's has a blue shine if you see it in the sun which has a slight color reference to her D1 hair mixed with D3. As a result her Auradon fashion can be formed with ease as it's a easier transition since she dresses like that before going to Auradon so her outfits would be very reflective of what's popular in Auradon without the prep, so she would wear dresses but they would be in darker colors and have a few spikes. Of if she was wearing a skirt it would be a synthetic leather. Her fashion is edgy prep until later in the series where it's still edgy but has a color tune up a bit. Her outfits will very much reflecting of fitting in Auradon as much as possible and try to appeal to the male gaze in Auradon as she would try to look more modest and muted compared to everyone in the group until later on she's comfortable of being herself as she dresses more for herself and wears what's fashionable and what makes her comfortable than what her mother thinks. Her outfit choices reflects more of her needing to be approved by others which makes her have a wavering confidence in what she wears forming into her wearing clothes she would never be caught dead wearing but has to so she gets her mother's and other's approval until she realizes that she lives for her not anyone else.
JAY

This dude knows he's a little shit. So he dresses like one. His is simple and it reflects that he needs to have places to store a box cutter and a cheap necklace. He's all about practicality. He hates and I mean HATES anything that prevents him from moving in absolute precision. There is no leather on him besides his pants which are similar to Mal's with the leather accents. Now his hair is long and just up until later he wears is down often and is just styled. So his Auradon outfits will reflect Mal in some form, it's different because it leans towards athlesiure, jock, and skater in many different ways until later he leans towards athlesiure and jock with a sprinkle of skeeter fashion with brighter colors and more simplicity so not a lot of patterns or graphics. His earlier outfits will always be outshined by Mal. No matter how similar it can be it will always be outshined by Mal. His outfit choices shows how he just goes along with Mal because that's who he knew the longest next to the fact that he doesn't crave the same need for power and leadership as Mal does he just in it for the loot and his mindset isn't about teamwork it's just what works for enough for him to get his share until he notices that he gets and works enough to get his share but...he isn't noticed that also made sure everyone get theirs, just somewhat ran over just because everyone assumes he doesn't care when he does or take it for themselves so they get brighter and become separate and drastically different from Mal making him shine.
CARLOS

His outfits are practical yet fashionable like Evie's but simple. He wears anything that makes him blend in blend in. He blends in so hard that Evie stands out more than him. His clothes are very two sided like his mom's hair but he only literally have one outfit since being on the Isle and what was in his bag of stuff when he went to Auradon was like a few inventions and games and some pictures and his oversized jacket and finally getting new clothes given by Evie and some new friends he makes as seen worn here because he doesn't really go out. His hair remains the same and just gradually gets longer and he can place it in a ponytail. Which if posted on his friend's stories just looks like a maltese ponytail. His Auradon outfits are simple and blends in more better in Auradon than Evie's. He mostly wear button up shirts with some pants or sweater. He just is scared and a lot of his clothes represent security in the beginning so some of clothes would be bagger than others until later he becomes more secure and wears clothes that reflects his newfound happiness and security which is more fashionable and what's popular with Auradonian boys while being himself. As with such with the two-sided clothing from before it also presents what his personality is like really in real life, and his oversized jacket is washed its a pure white jacket. He's witty and comical and iconic while also being anxious and terrified. So his outfit choices reflects him coming out of his shell show what more of him meets the eye making him be the iconic king he is.
I hope that this analysis makes sense 😭 please let me know if it doesn't! Also i would like to hear some suggestions because ironically fashion is also not my strong suit and I'm worried that I made them too ooc but know disney i probably wasn't far off smh-
#disney descendants#descendants#my art#disney#mal descendants#jay descendants#evie descendants#carlos descendants#mal bertha#evie grimhilde#carlos de vil#this was choicee#//sob
10 notes
·
View notes
Note
Do you have any tips for making animation-friendly designs? My designs are intentionally accurate to real-life cats, and I love them, but I know they would be super tedious to animate, or even use in a comic! How do you make such simple designs that are still so amazing and beautiful?
Well, it just takes practice and iterations I think! Mostly. But I have a few tips that I fall back on frequently I could share so Here’s my quick hot take on making animation designs:
Simplicity is your friend. I had a professor that used a term “simplexity” to describe the balance needed in order to make a character unique and easily recognizable, but also not hell to render out in a full animation. This is going to mean different things for different productions, for example something on the scale of Disney can have a character like John silver with a multi faceted robot arm whereas if we’re trying to do something low budget (*COUGHforfreeCOUGH*) you’re going to want to minimize the headache people have when drawing your character by leaning into the simple side of this term, so that they don’t want to murder you and will still be your friend after the project is over. (more under the cut!)
So what does this mean exactly? You’ll want to keep the line mileage to a minimum. For cats, this means limit the amount of detail and rendering you give the fur in your linework. I’ve seen Artists who break this rule magnificiently (like Raevi goddaMN GIRL) but for a design it is much easier on artists to streamline down to core body shapes and key character Accents in the fur (like tail shapes, cheek floofs ect). This can be pretty diverse, but I’d minimize it as much as possible (if possible down to three accents, more on this later).
For examples, On lionblazes design (line art only at this point) his Character traits are his tail shape, Mane, and Scribbly eyebrows, all aspects that mean more strokes are being taken and work done, but that are easily recognizable between frames, and artists. I also have brought up Dovewing’s design because it’s more complex in it’s line art, but I could simplify it down even more to just her butt shoulder and ear floofs and still recognize her character silhouette. In fact, paring it down even further would strengthen her recognizability.
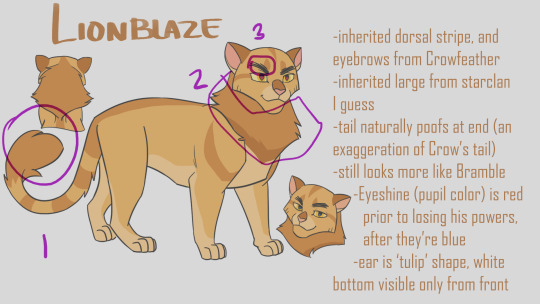

The amount of strokes you have people draw in cleanup will drastically change the amount of time it takes to render a character. Between Firestar and Bramblepaw in this shot Bramble easily took twice as long to line (or more!) thanks to his beautiful luscious curls.

Next! Principle I use in simplexity is the rule of three. For whatever reason, the number three is your best friend. It’s not as weirdly symmetrical as two or four, and maintains a unique organic-ness to it without getting carried away by five or seven. Now what am I even talking about? Pretty much everything. This is the secret of markings. This is the secret of character accents. This is the secret of color picking. The Rule of three is your best friend.
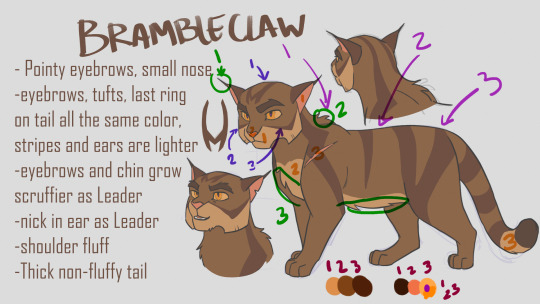
Take Brambleclaw for example. I gave him three stripes/markings on his face, and three on his side. It feels nice and natural and organic, without being overwhelming. I also gave him three specific fur accents in his line art, his ear tips/eyebrows, Belly floof, and shoulder puff. I used the rule of three in picking his colors, three main pelt colors, and three accent colors (eyes are always gonna be more complex if desired, people love rendering the shit out of eyes) and even so, three colors for the eyes. I used his lightest pelt color in only three places, and his Pink color in only three places, and his darkest color in only three places (eyebrows, Tail tip, and if I had thought to write it down, his paw pads). Even his forehead marking has three parts to it. You do it enough and it becomes really natural and subconscious. Of course, like all rules, you can still break it if you need to, but It has been one of my best friends.
Alright last thing to think about for now, (see what I did there? There are more things, but it helps people remember better to learn Three at a Time), are Shapes. Specifically using Simple identifiable shapes when constructing the body or face of your character. This is going to sound similar to the line mileage point, because they are related, but they are different. This is focusing on the macro details of a silhouette whereas Accents are about Micro details. This point also has the added benefit of helping characters look and feel related to each other if you use it potently!
Let’s take Hawkfrost and Mothwing for example. Specifically their faces. Hawk I designed first, and I wanted him to feel dangerous, and maybe a little twisted. So I decided to integrate a lot of triangles into his design because, a triangle’s shape language reads as dangerous. They’re pointy, and sharp, like teeth claws, and knives. We can’t in good conscious put an especially triangular object next to a baby because it inherently feels dangerous. They’ll poke their eye out with that tall prism. Other shapes have their meanings as well, Rectangles (cubes) are sturdy, and circular objects are the opposite of triangles, they’re the shape of eggs, fluffy pillowy things, and babies. They’re inherently safe, and soft.
Pull back from digression. Look at hawkfrost and his triangles. They have sharp claw like tips, which are emphasized even with a noticeable downward curving to their points. This motif is repeated multiple times, in his cheeks, his ears, his eyes, his chin, his nose. This becomes unifying, and inherently feels dangerous and curved, or twisted.

Now look at moth. She has triangles too, but I deliberately went through the effort to make them rounder, softer, inverting the angles of her eyes to feel sad and not cruel. Yet she remains similar in enough ways that she feels related. Her nose curves in a similar downward manner, her ears retain the out down curve without the dangerous point to them. The fur accents of her cheeks add to the roundness, making her feel softer while sharing hawks cheekwings.
Let’s take another example, Bluestar and Snowfur. They are proof that similarities do not have to be reserved to face shapes alone to give that strong feeling of relatedness. In some ways I think theirs is the strongest sibling bond I’ve read in the books, and that obviously translated to how I designed them haha! The idea behind their design was ‘curvy sturdy’ which is reflected in their circular based hourglass figures emphasizing Bluestar’s ‘broad shoulders’. I tried to make their heads more of a squashed circular shape, to give it more sturdy strength while feeling soft and maternal. Her ears are very rounded at the tips, and the particular downward turn is easy to identify and reflect in both cats. Lastly, their square “pants” because let’s be honest, both these she cats wore the pants in their families. There are also enough differences that in pure silhouette you would still be able to tell Snowfurs bushy tail apart from Bluestar’s thinning fur, and snows’ cheekfluffs from blues wide round jaws.

Of course I am not perfect at all of these elements, and there are even more things I could say that make designs unique and easily animatable while also identifiable. If you are looking for more or different suggestions, I liked Tenielle Flowers’ Video she released on the subject: https://www.youtube.com/watch?v=lO-kNlyHn8A .
And good luck!
539 notes
·
View notes
Text

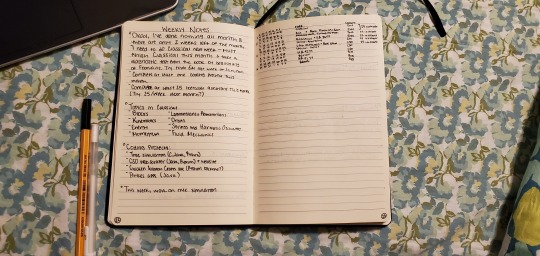
The more I do this, the uglier it gets, but it's okay because I think I've mostly figured out how I want to journal and how to use the space in this notebook since I switched from my dot grid to these lined notebooks that I have lying around that I got for free and accumulated over the years. Because of the number of pages, I'm gonna have to use two notebooks this year, and this one is already smaller than last year's notebook, but the second notebook for this year is gonna be even smaller, so it's a process figuring out the right layout. I realize no one cares about this and it's long so the rest is under the cut [[MORE]]
Basically how I have my journal set up currently is:
I skipped the first few pages in case I decide I want an index (I probably won't)
I have my pre-planning spread which is a spacing guide on the left and a journal format brainstorm on the right
I have a future log/year at a glance that takes up four pages/two spreads where I drew out the little calendars for the year and a blank column under each month and whenever I have an event I put it in, so the events won't be in order but I don't care tbh
I have my monthly spread which I changed from last month: last month I had just the calendar on one spread and the next spread was monthly notes on one side and trackers on the right. However, because of the size of the notebook, that space wasn't being efficiently used. This is what it looked like

So I just decided to combine the two so now my monthly spread includes the trackers in the calendar and the notes next to the calendar, since I don't use the monthly notes much anyway. Idk if I like the habit tracker layout bc it's not as good visually but it's a lot easier to actually fill out since I just have to circle the letter instead of trying to figure out how to draw rectangles the right size and space on half a line in a ruled notebook so maybe I'll actually use it this month. Tbh the trackers are only important for prayers and I didn't use them last month but I used them pretty religiously ;) last year, and with the other stuff I generally write about them in my weekly logs if I did them but I thought I'd try including them in my trackers just to see if I could use them.

My weekly spreads are the same as last year's, I write my events with circular bullets and I jot down any brief notes about the day or things I did with dashed bullets. Only difference really is that last year I attempted to be colorful and decorative with my spreads (which didn't work bc I'm not a creative person lmao) so this year all my spreads are looking basically the exact same and I'm liking it this way. I like the simplicity of doing everything with just a black felt tip pen (and a white gel pen for when I mess up and have to scribble things out like in the first pic lol).

Just like last year, after each weekly log I have my weekly notes which, also like last year, are completely undecorated and just say "WEEKLY NOTES" at the top. I use this for to do lists mostly but also anything else I feel like writing; it's the "everything notebook" part of this journal.
I don't really plan to have any other kinds of spreads but that can change of course if I feel like it. Last year I would start them and not really use them (except for a couple of important ones but I'll just refer back to the old notebook for those) so I prefer just writing everything in the weekly notes section.
I feel like I do actual journaling here bc I just make personal posts about my thoughts and feelings all the time and all my productivity in my notebook and I just think it's funny bc I feel like most people prefer to do productivity stuff digitally and journaling analog but I'm the opposite, mostly bc I feel like my hands when I'm writing can't catch up to my brain and so writing becomes a chore. That's why I'm glad I started writing bullet points about my day in my weekly log, it's much more manageable and if there's anything I really want to remember I can just write it without worrying about capturing the moment and stressing about language. I know like my preference for analog productivity and digital journaling isn't unique obviously but I still do think it's kind of funny bc I'd have thought it'd be the opposite.
On an slightly unrelated note, I haven't been using google calendar much lately and I've been relying on my notebook but that's not good, I need to have things in both places to feel like I know what's going on. I think it's mostly because of the Bangladesh trip tbh but also since I graduated I feel like I've been falling off of using google calendar, but it's still what I use when I make appointments esp when I'm out and about, so I need to use it more regularly so I don't miss out on stuff.
#T#Photo#Me#bujo#She's a lil actually a lot ugly#But I think this is working for me#Will this get me through unemployment and unenrollment? Will I become a productive and gainfully employed person?#Only time will tell but it's been a long time#I've been out of school for eight months...almost 9...disgusting
4 notes
·
View notes
Text
7} Weeks, Months, Years

Masterlist
Loki’s Gilded Pet Masterlist
Loki Laufeyson X Plus Size Reader
Warnings: Cursing, sassy reader
A/N: This is the end of this series! I'm putting it to bed, but I feel you will enjoy the ending. This chapter ran longer than I intended but enjoy & find out if Loki finally catches up to the reader!
Words: +3,900
The air entering deflated lungs burned like hell, jolting up on the table, hands engulfed in seidr to push the one back who held her until a familiar voice yelled in buzzing ear, almost deafening as it registered as Tony Stark. The billionaire grabbing Y/N, shaking jittering body to force her to focus on his clean face clearing Y/E/C orbs taking a quick look around to note they were on another ship.
Oh god, not another ship, not floating in space, hold shit she can’t do this & felt sick. Holding on to Tony to bury her face into the clean clothes he wore, gripping tight to assure this was real, glad he was allowing time for Y/N to calm & talking her through it.
“It's alright, we were picked up by one of Quill & Nebula’s friends, we’re headed to earth, it's alright, it will be alright,” Tony spoke Y/N finally looking past the man’s shoulder to note a little girl, maybe a year-old peaking around the doorway at them, the little creature’s dress striking familiarity as one the Asgardians wore noting a man she didn’t know, tall & lanky shooing the girl who looked at him terrified.
“No, she’s OK,” Y/N spoke hinting to leave the little brown-haired girl alone sparling amber eyes looking up to Y/N in awe, pushing back from Tony to put her feet over the edge of the table Tony warning her not to get up, looking at the little girl with a smile.
“Come here little one,” Y/N spoke quietly, the little girl looking at her in shock she talked to her, the woman remembering she would know her as one of the ones that fought to save Asgard.
“We picked up an escape pod,” the tall one began stepping aside for the little girl to step up to Y/N & Tony who stayed close, so she didn’t fall from the table. “They weren’t many on aboard, a lot of dust & this little creature, a few adults but that was it, they don’t know her name or parents.”
Y/N reached down to lift the little girl into her arms, the small creature wrapping around sore body tightly as if her life depended on it cuddling hard as the woman looked up to Tony who was in just as much shock as she the little girl clung to her.
“How long till we arrive on earth,” Y/N asked wrapping arms around the little creature to keep her tight, a hand falling to shivering shoulder that was Tony as she looked at the man in ravager gear.
“A few days. You weren’t far off course,” he began, stepping close to them now as Nebula entered taking in the sight of Y/N holding the little girl.
“Seen you found the little rodent,” Nebula hummed handing a bowl to Y/N as she placed a blanket around her shoulders, the little girl perking up at the smell of the food, turning to see what it was & Y/N all too happy to let the creature feed herself.
“Don’t act like you haven’t been feeding her, I seen you sitting with her earlier feeding her candy,” the ravager spoke up to the Luphomoid in a familiarity that came with friendship.
“Who are you by the way,” Y/N spoke looking up from the little girls eating to meet the man’s gaze.
“Sorry, names Kraglin,” he spoke holding out a hand for her to shake which she gladly did.
“Y/N,” she introduced herself, looking back to the girl then to Tony.
“Has anyone made contact,” Y/N asked looking to Kraglin who shook his head yes but looked to Tony to explain.
“Thor, Steve, Rhodey, Natasha, & Bruce are the only ones left on earth,” Tony began noting the woman trying to look hopeful, but he knew what she was about to ask & shook his head no.
“I see,” was all she could mumble before talk turned to the task at hand, focusing on the little girl that was obviously going to finish the bowl for her.

3 months Later
Wrongs righted it was hard to get back into the swing of things but as it got easier, the little girl living with Y/N, given the name Frigga after the queen who saved her life & having taken up residence in a house back away form the chaos of the city to work out of the home for Stark to what true purpose she wasn’t sure. Thor always visiting, playing with the little girl & sticking around to ask the warrior as he had taken to calling Y/N, the latest on the revelation known now as twins that where rolling around in her belly.
The very god having called to inform her he would like to come visit he had a surprise for her & the twins. The door opening telling her Thor had arrived as well as the little Frigga screaming at the top of her lungs as the toddler barreled through the house to jump into his arms with Y/N stepping into the foyer to watch the god enter.
“I could do without all the excitement,” Y/N began, hand placed on lower belly that showed little sign of the life it contained but didn’t mean the twins didn’t kick around seeming they got excited when the god entered as well.
“I have a surprise,” Thor laughed out, throwing Frigga over his shoulder to step out of the way to revel Loki on the porch, Y/N going pale to flick a wrist, the door slamming in Loki’ face as she looked up to Thor.
“Y/N, it's Loki, I promise,” he began trying to ease the visible tension in her eyes & body all color drained as he began to explain.
“He has been looking for you over the last few months none of us knew & when you came back to earth he wasn’t far behind, he just got back a few days ago, I told him about the twins, Y/N it's OK, let him in let him explain,” Thor tried to coax the pale woman who had tears welling with a shake of her head no,
What a fucking wreck of a woman Loki was coming back to, one that was skirting past Thor to hurry to her bedroom in the single-story home to hide & collect herself.
It was a battle to think, to calm, only looking up from the bed as a throat cleared, the tall frame that was unmistakably Loki stepping forward before she could slam this door in his face, getting to bare feet.
How did she explain to him that she wasn’t able to take touch? That anytime anyone came near even when she knew no harm was imminent it still made blood run cold.
“I looked everywhere for you love,” Loki began with the biggest smile he could muster, seeing the terror in her eyes & knew what put it there as he paused a foot away, her hand on lower belly as if protecting the life, he knew was his. “Twins,” he hinted to her belly.
“Well, when you fuck for 2 weeks solid like rabbits it's to be expected,” Y/N blurted out making him laugh, her boldness still shining through as he was sure to not touch motioning to her to take a seat as she remained pale, it worried him.
“You're right it shouldn’t be a surprise,” he smiled kindly following the nervous creature to the bed sitting so he didn’t crowd or make her uncomfortable. “It's alright, I know, it takes time. I hope you are willing to let me help.”
Y/N looked at Loki, dying to reach out, to allow him to feel her plumping belly jiggle with the little lives that tumbled within but just couldn’t.
Nervously biting her bottom lip to nod in agreement, hand nervously reaching out, trying not to flinch when he allowed her his own to do as she pleased, placing it low on plump belly to feel them kick before finally quieting as her nerves did, relishing in the little contact before pulling his hand away herself.
“Girls,” Y/N began looking up to Loki as it dawned on him what she said.
“Girls, well then this calls for a celebration if you would agree to it,” he smiled inching closer but paused as she leaned away.
“I would, but I would like to rest for a while. Days if it's possible, Frigga refuses naps &…,” Y/N began, voicing the little girl’s name & noting the look in Loki’ eye.
“You named her Frigga,” he asked swearing the god almost choked at the mention of his mother’s name hand reaching out to touch soft face but drawing away.
“Um… yes, I already picked out names for these two as well… but we can change them… as long as what you come up with isn’t stupid or anything,” Y/N smirked showing a bit of the woman he fell for in the dungeon.
“What did you pick out for them,” he smiled at her boldness.
“Dove & Nova,” Y/N smiled obvious it took Loki by surprise at the simplicity of them but didn’t leave him much room to protest as he nodded.
“They are fine names love. Would you allow me to take you out somewhere? So, you don’t have to cook tonight, I'm sure Thor can handle Frigga,” Loki smiled, making it obvious he was trying hard to keep it together, it killed the god he couldn’t touch or hold the mother of his unborn children.
“Uh, what about we order in? I'm sorry, I'm just so tired & I really need a nap & Frigga has…,” she began to explain but he waved her off.
“Say no more, rest & I will take care of it, of you, of them, like I promised,” was all the god spoke quietly leaving her with a smile, watching him walk out before flopping to her back in exhaustion, overwhelmed with the newest development, hand rubbing over plumping belly to lull herself to sleep.
It was quiet in the house for once, no screaming Frigga running the hallway between her room & what belonged to the little girl. An eerie sound when one so small as the little creature wasn’t screeching at the top of her lungs & made Y/N bolt out of the bed & into the dark hall.
How long was I out & where is Frigga, oh god! I feel asleep, she was alone.
Racing down the hall to the sitting area Y/N found there was someone on the couch, the little girl laying on their chest asleep, half expecting it to be Thor because he was the only one who could get the toddler to settle but her mouth dropped open at the sight of Loki holding the brown haired girl under his chin telling her a story though it looked like she had been out for a while.
“Did you sleep well,” Loki finally spoke up to Y/N who was still lingering in the doorway in shock, Loki really did come back, he really was there & craving so bad to lay with him but didn’t have the guts to do so just yet.
“I did actually, the first time I haven’t woken up screaming that is…,” Y/N began to explain but like he needed it, the sparkle in emerald eyes telling her that he may have helped. “You helped didn’t you.”
With a smile Y/N stepped into the room, looking at the clock & noting it was only 6 in the evening, but it was still winter which meant night fell early. Carefully she took a seat on the couch next to Loki, laying a hand gingerly on the sleeping child’s back before meeting his gaze.
“I hope you’re staying because she doesn’t fall asleep this easily with me, bedtime is a fight,” Y/N smiled, this time allowing the god to take the hand laying on the little girls back to cherish over the soft flesh noting it felt as supple.
“As long as you want me to,” he whispered quietly, her gaze flicking to the kitchen as he followed it, hearing her stomach grumble.
“Why don’t you go on & sit at the table. I’ll put little Frigga to bed & join you,” he began carefully leaving room for her to tell him no but she shook her head in agreement, getting to her feet slowly, a slight cramp from growing uterus making her sway & a hand on her lower back bracing her as she realized Loki was next to her, little Frigga cuddled in tight to the gods neck & sound asleep.
“I'm OK, just growing pains, I'm told it's normal,” Y/N explained standing straighter & smiled, enjoying his touch, she knew he kept his promise that he would never hurt her the hand remaining to rub softly.
“Ill be right back love,” he echoed before stepping down the hall, Y/N choosing to wait for him to return before going to the kitchen, the god holding an arm out to escort his Y/N to the small table being sure she was seated, happy & served first.
“I take it you are 3 months pregnant,” Loki spoke as they began to eat, noting she no longer cared if he watched, which was good for her & the babies.
“Yes. They are actually growing slowly & I'm telling you right now if I have to carry them for more than 9 months I will kill you,” Y/N informed the god who smirked at her as she paused to look up at him.
“Then I guess it gives you little comfort my mother carried Thor for a full year,” Loki began, watching Y/N’ eyes grow big & the thoughts of how big she will be when she eventually went into labor.
“Holy shit! Loki! A year!? Then you can carry them for the last part,” Y/N spouted to the god who could only look at her & smile.
“Calm down, it was a joke I'm sorry, I didn’t mean to upset you. And besides they are part frost giant, not Aesir, which means you will be most likely carry them closer to 2 years,” the god tried to poke fun at Y/N as an empty carton was flung & made contact with his head to fall to the floor.
“Damn you Loki! It's not funny! Even at 3 months this still isn’t comfortable,” Y/N pouted at the god who was seeing more of the old Y/N as he finally cleared his throat.
“I agree, my children are not laughing matter. What do your doctors say,” Loki began as a smile graced her features.
“I wouldn’t know because I don’t go to a doctor, I go to a midwife that is from Asgard & spoke with Shuri about the gender,” she smiled noting the god calm, both knew bearing children was uncertain for anyone, though it was a comfort to know Y/N wasn’t taking it lightly, knowing a midwife/healer & Shuri would possibly be able to help or know where to get her help.
“You're beautiful Y/N,” the god spouted making her pause in eating the spoon full of noodles she had placed in her mouth, swallowing it down to stare at Loki wide eyed before wiping her mouth.
“You’re glowing love, pregnancy suits you, I may have to keep you this way,” Loki smiled, noting the sparkle in her eye.
“As long as you promise to rub my back when we get done here I don’t care if I stay knocked up for the next century,” Y/N smiled at the god who returned it.
“Promise lover,” he finished as they continued to eat before retiring to the couch for him to do as promised.
His Y/N falling back to sleep, head in his lap while laying on plumping stomach since it was still possible, relishing in the feel of his seidr dancing along lax spine to soothe the tension.

8 Years Later
It was the high pitch scream that got Y/N attention from the tablet she held, which could mean one thing, the kids had just got home from school & odds are the said delivery of children along with their driver wasn’t the usual. Getting to bare feet to look out the French door narrowly stepping back in time for Frigga to be the first in while it appeared the driver of the vehicle had been Bucky, who had the twins Dove & Nova, under his arms struggling & yelling out to be put down.
“Evening Sgt. I see that the tutors must have had there hands full since you where the designated driver for the evening,” Y/N laughed as he sat the girls down all three taking off to the living room to look over into the play pen to speak to the newest addition, 10 month old Bjorn, Loki’ first son & Dove reaching down to lift her brother out as he held his hands out to her.
“Now I understand why you need a break,” he laughed as Bjorn was sat down to hurry over to Bucky, lifting his arms to be picked up to which the soldier gladly did.
“You need me to anything before I leave? Or is Loki back,” he asked looking to the little boy that bounced & traced the paterns of the metal arm then back to Y/N & plumping stomach.
“I'm good, he & Thor I think are due back tonight. Thanks for bringing the kids by the way,” Y/N spoke remembering something & hinting at him to wait heading to the kitchen as he sat Bjorn down to hurry after his sisters.
“Here, I had some energy today & made cookies,” Y/N spoke handing the soldier a large plastic container filled with chocolate, chocolate chip cookies.
“Thanks, but what are the others going to eat,” Bucky laughed at Y/N, the woman telling him to share or else as he finally left.
“Look at you little house kitten, making cookies,” came Loki’ voice from the kitchen as she stepped back towards the open area to realize he had made it back with Thor stealing everything on the counter before chasing after the kids his cape billowing behind him.
“You know what, bite me,” she scolded the god as she stalked towards him, “& by the way I thought that your brother was the god of fertility not you & you were supposed to carry the next one or should I say twins. Again!”
“Twins,” Loki paused, Y/N forgetting she had just found out about the twins, swearing if he smiled any bigger his face would crack, it worried them both about someone coming for them, but they would be ready.
“Yes Loki! Twins,” Y/N snapped stepping closer to realize his usual clean appearance was dusty & muddy &…
“Thor! Don’t you dare get this house dirty,” Loki yelled for her, engulfing himself in gold light to change to slacks & a button down as he grabbed one of the hot cookies & stuck it in his mouth.
“Stop eating my cookies,” Y/N scolded, the god quick to pull her close to hold tight as she laid her head on his chest.
“We found a new place on Vannaheim to rebuild. When you feel up to it I want to take you & the children to see it,” Loki began as the girls ran screaming out the back door, Y/N looking out the window that overlooked the yard to see Thor being tackled as the girls held him down declaring themselves the winner.
“That sounds nice, I'm not wearing dresses so put that out of your mind,” Y/N spoke into his chest before looking up into sparkling emerald orbs.
“No dresses & twins, boy & girl yes,” Loki began taking her off guard he guessed it.
“You dreamed it to didn’t you,” Y/N finally spoke, all sarcasm gone as he nodded in agreement to the statement.
“You do realize this means in a few more years they will be another set,” Loki spoke hinting to the dream.
“Yes, but thankfully it's a span of 5 years,” Y/N smiled as it appeared Thor had brought the war party in with him to raid the cookie sheets.
“You oaf stop, or they want eat dinner,” Loki cautioned his brother who handed all 4 kids a cookie who took off through the house.
“Well, good thing I'm staying to watch them while you two go get dinner in peace,” Thor smiled before hurrying after the four that where in someone’s room screeching at the top of their lungs once more.
“We better go before they come back,” Y/N smiled up at Loki who returned it with a dark smile.
“No, this,” she spoke, stepping back & pointing at her belly, “this was, oh love it's just you & I tonight lets have some fun,” Y/N continued glaring up at the god who persisted to smirk down at her hand falling to her belly, the twins not more than 2 months gestation but because of their heritage were active & kicking though all be it lightly as they tumbled. “We are going to go eat, I want Mexican, rice, fajitas & I want sweet tea, so you know where that means we go.”
“You are a needy little house kitten aren’t you,” Loki finally spoke leaning down the steal a kiss hands falling to plump hips to give them a squeeze.
“I'm not needy, I'm pregnant, there is a difference,” Y/N smirked hand going between the gods legs to make him jerk.
“And this is mine later tonight, so who’s transporting me or you,” Y/N smirked darkly, releasing him to step back using seidr to right messy hair, changing into leggings, boots & t-shirt.
“Not with the twins you're not, it will be me,” Loki began protectively stepping close to pull thick body flush before placing them in a deserted side ally of a Mexican restraint further south while changing his own clothes because all he need was to be recognized, putting Y/N & the babies in harm’s way.
“So, the names lover, what have you decided,” he began as they started around the brick wall & into the restaurant.
“You have thought about this already or you wouldn’t have brought it up,” Y/N smirked as they entered to be seated.
“Sigourney for a girl & Aubrey for the boy,” Loki began watching her expression close as she sat across from him.
“What are the meanings?”
“Well Sigourney means conqueror & Aubrey means king of the little people,” he spoke still observing her.
She couldn’t help but laugh, well she had named the other four & with a nod she agreed to it but held up a hand to stop his premature celebration of victory.
“I get the middle names & scoot over I'm sitting next to you,” Y/N admitted sliding out of the booth to scoot into his as he stood making sure she sat on the inside, the gods over protectiveness showing.
“Missed me love,” Loki breathed out, Y/N leaning heavily into his side, laying her head on his shoulder.
“As always, you miss us,” she sighed, reaching for the chips & salsa as he scooted it to her.
“You know I do,” he sighed out, laying his head on hers before the waiter came up to take their order, the gods hand laying heavy on Y/N’ thigh with a light squeeze as she wrapped her smaller one around it.
The End
Tags open! And re-blogs are ALWAYS welcomed!
Tags: @dark-night-sky-99 @prettybubblesintheair @gramaeryebard @reallyheckinggay @jovanna-shewolf @andiyholly @katstablook @nickyl316h @beets1bears1battlestargalactica @aslandia726 @moonfaery @furstinnajoelle @itsbqueenthings @lookwhatyoumademequeue
@whovianwookie86-captainxev@jazzieomega @bambamwolf87 @tomhardy41 @get-loki
41 notes
·
View notes
Text
Coloring in grey scale
So, hey, this is somewhat of a tutorial for those curious about some of my coloring and blending. I made this especially for anyone younger than me and is exploring digital art, but this is also for others who are curious about what I do. I love reading other artist’s comments and looking at their WIPs, so why not.
Another reminder: if you’re looking for my artwork, please follow @rainbow-illness and not this blog. All of my finished stuff goes there; usually, my works in progress (WIPs) or Angry Doodle Corner go here. Sometimes I use this blog to repost my art, but that is my official art blog, no this one. Not unless you like nonsensical posting and metal, then have at it. If you have any questions, don’t be afraid to hit me up, I love talking about art.
So I can’t always sit down and talk about my processes and how I go about doing them, but I was able to sit down and take some screencaps while I was working on my iPad Pro. Using the iPad is actually my first choice to draw on because of the convenience of carrying it around like a sketchbook, whereas my laptop isn’t always easy to carry around--it’s a big laptop. While I use my iPad, I also like to go back and correct things, recolor, re-proportion, or spend more time privately working on a drawing. I have my iPad with me, all the time, so I’m out in places usually like Starbucks doing this. I also struggle with pretty bad PTSD and agoraphobia, so having my iPad out with my headphones on gives me an excuse to put my mind elsewhere to calm down. My family just usually looks at me and goes “oh, she’s working on her art again”; I did this as a kid, too, only with sketchbooks.
I do not have a Cintiq either, though I would absolutely love one. This laptop is capable of using a stylus, but I think I need a better one to do it with. All I’m using is a cheap Wacom Bamboo tablet that I’ve had for five years, that’s it. Everything I’ve done on this blog has been on a small surface. So if you’re just dabbling into art, don’t beat yourself up for having the small stuff, I’ve worked with small stuff and still do. The only thing I have that’s not small is, well, the space and processor on my laptop are much faster than any other laptop I’ve owned, bought especially for graphic design classes and my artwork.
So, that being said lemme just forewarn some of you guys. My artwork is all done in two to three layers! Yes, you read that right! Why? When I was 16, I didn’t have a Wacom tablet to mess with, so I had to use a mouse and learned from there. When I turned 18, I got my first Wacom tablet while working my first official job and the family computer didn’t have a good processor. So when I got my first official laptop, it was basic and not made to run anything beyond the web browser and such, it could barely handle Photoshop. It did, however, run Paint Tool SAI with no issue (which is why I still prefer it over anything I use), it just couldn’t handle more than five layers. After losing my drawings constantly and not being able to do anything in the prized software I’ve been eyeing since my Sophmore year of high school, I found a workaround with it.
And that’s what I’m going to write about here. With that in mind, no, you do not have to limit your layers! I’ve taken traditional art classes so my first instinct is to literally paint over my stuff like I would on a canvas. If you don’t want to do that, you don’t have to! Yes, I am nuts.
That being said, let's do this.
If you haven’t taken traditional art classes, that’s cool! I’m going to be using some art terms you haven’t heard of, but you definitely will when you take your first ever drawing class. These terms are foreground, value, negative space, contour, and weighted line (I’ve seen it called line weight too). For the more experienced art students who are likely groaning over that stupid contour practice from that book “Drawing on the Right Side of the Brain”, I’m sorry, guys. Newbies, you are going to know this.
And you are going to hate it. While I still hate it and, yeah, my eyes are rolling into my skull right now just even talking about it, there are some useful practices in here that I... actually use. Who would have thought? At least we’re not talking about still lives.
Anyway, here’s what I’M going to say that some art teachers will not tell you but I want anyone to read this to know:
- Do not obsess over your drawing to look exactly like your reference. Just don’t. Forget this completely, worry about it later or don’t even worry about it at all. This is your style, your interpretation.
- Digital art is hard. Art is hard! Practice makes perfect and you learn over time just by studying (looking at) other pieces of art. It took me like well over 10 years to find my own little niche and I’m still playing around with coloring styles. I have a lot.
- If you’re just starting to draw with a tablet of any kind, play around with it. My first official program was a cheaper version of Paint Shop Pro and when I first got it when I was 14, I sat around and experimented on layers to see what it would look like. Explore!
- When you start drawing figures or faces, try not to think of it as, well, face or a figure. Reduce it to basic shapes, like squares, triangles, and circles.
Greyscale can establish light source, value, scale, and negative space.
I don’t always use greyscale for my art, but when I do, I appreciate it because it makes my life easier. For example, Alphonse Mucha’s pieces here from his “Slav Epic”.
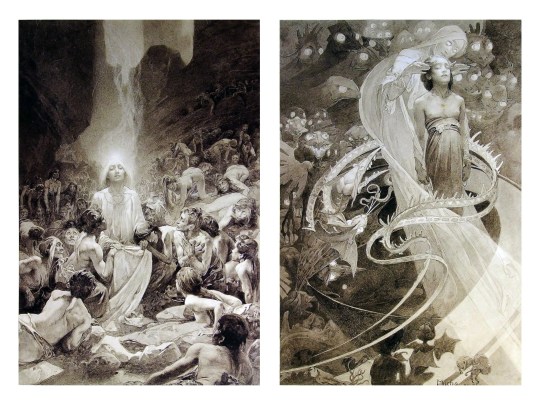
Chances are, you’ve seen Mucha’s art nouveau on prints, fanart, fabrics, and all of that. But Mucha did so much more and he is a huge influence on me for a reason. By the greyscale we see here, we can see foreground/subject with each illustration. Mucha is using value (that’s shadow) to emphasize this, in addition to negative space (background) to draw you in, just by using black and white. Notice how the other subjects don’t have such a powerful contrast and light source versus the other, especially the woman on the left. Mucha made his art pop by his understanding of contrast.
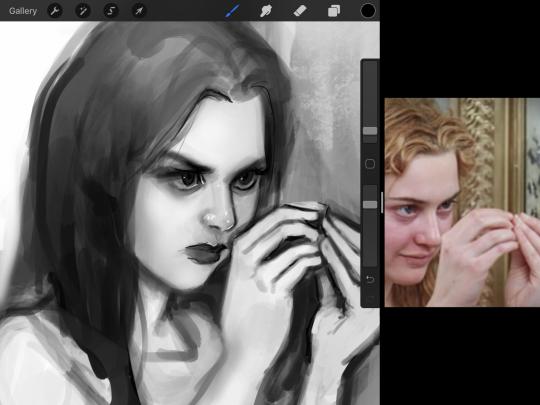
For this first part of this entry, I’m going to be using Papa Emeritus II from “Ghost”... who is a good example of how to draw faces, too. Huh. Regardless of what drawing program you’re using, keep your opacity low, at 50%.
Simplicity at its finest
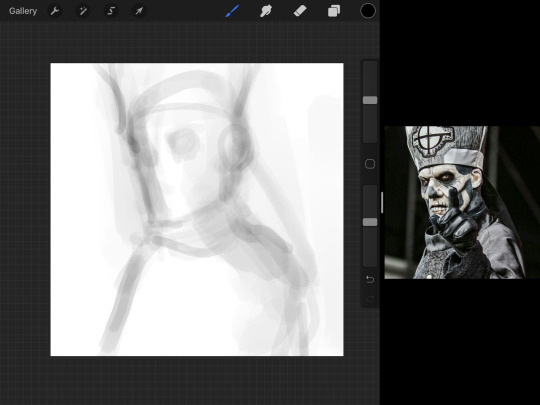
Instead of focusing a lot on Emeritus’ face, I’m going to focus on the negative space behind him. I’m using this to define his figure. This is a good picture because of the stark contrast, though, it’s a little tricky because it is really contrasted and you can’t see where the light source really is. But that is okay! I am going in and just using this negative space, the contour of his head and torso. Before I even think of a face, I want to softly go in and use black (or grey) to fill up that negative space. Keep it simple and work your way up.
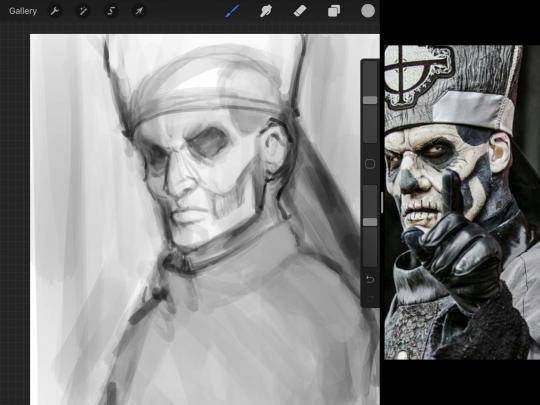
After I lightly fill in the negative space around him, I can start lightly going in and establish his face by blocks of shadow. And this is why Emeritus II is such a good example for this kind of work. I don’t usually start going in and drawing eyes, I rely on the shadows of the face to see where their eyes, ears, lips, and such lie.
Here’s another example (though, it’s old):

This is in my maroon style underpaint, which is what I post most of the time. For their faces, I just used basically eye sockets to start working on their faces, like Papa Emeritus II down below. Again, this dude is a great example.
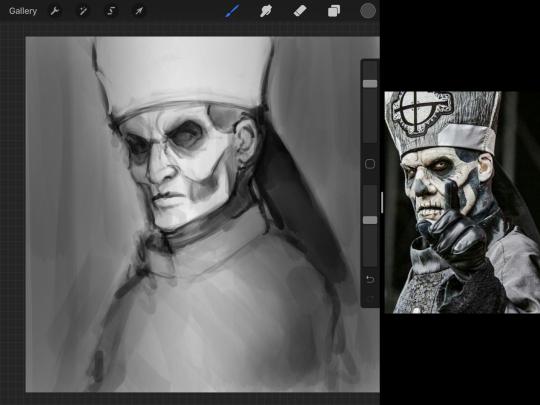
Here is where it may get a little funky. I created a new layer and set that layer to Multiply, still keeping that opacity low. Since I have no light source and I just want to create a really dramatic lighting, I made a vignette with a simple airbrush tool.
With that little vignette, you can create a new layer (unless you’re me, I just merge it down because of that constant fear of nonexistent software crashing) and I’m using the color pick tool to go back and forth to start using greys to really get into Emeritus’ face, especially his wrinkles. I’m painting over it constantly, switching back and forth between a paintbrush tool and color pick tool to blend. Again, keep your opacity low... unless you’re me and you’re feeling adventurous. You’ll also notice here that I have more than one photo reference. I use several for a lot of my art, so I encourage you to do the same. I had no idea what his jaw looked like, so I grabbed a second photo. Now that I have a better idea of where his hat ends on his forehead and how his nose looks, I start doing a weighted line.
Weighted line and Contour
Now is the dreaded talk. Of contour.

Welcome to Drawing I hell. This cursed image is from the book “How to Draw on the Right Side of the Brain” and if your teacher does not talk about this in your first drawing class, I am going to eat my hat... I have a hat lying around here somewhere. ANYWAY, the contour line exercise is basically you just using a neverending line for a drawing. I don’t know who drew this (and tbh, thanks a lot for every single boring assignment I’ve done in drawing classes), but this guy used contour lines for his drawing. I’m having war flashbacks over here, but I managed to find an art teacher’s page talking about different types of contour. My god, they are evolving.
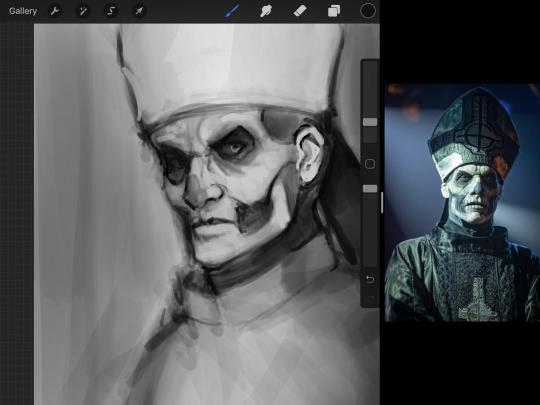
Going back to our dear friend Papa Emeritus II, I used weighted line to start adding in little shadows to his face. Weighted line goes hand in hand with contour; it is a great technique to not only add details, but add little bits of shadows.

This is a simple example; the thicker line is adding to the shadow of the apple, giving it value!
Papa Emeritus II is such a good reference... I used him as inspiration for King Melwas here.
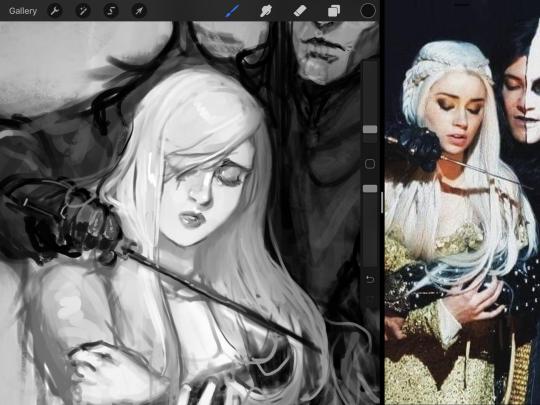
Gwenhwyfar is also a good example of weighted line. Gwen is essentially a very, very pale character. In contrast to Melwas, who is in darker clothing, Gwen is soft, she is the focal point in this drawing. For the little pieces of her hair, the corner of her lips, eyelashes, and her fingertips, I used a weighted line to establish these things, otherwise, Gwen is so pale, she’ll easily be washed out completely.
This drawing of Alice, which I’m still messing around with, is another example of how effective a weighted line can be with depth. The lines I added into her face, eyelashes, creases, hair, and fingers add those little details since everything I’ve done before like Papa Emeritus II was so soft with a low opacity on the brush settings.
Layer masks and curves
There are two ways you can color greyscale images.
You can do this by going into Layer > Adjustment Layer > Curves (this is how it looks like in Procreate).
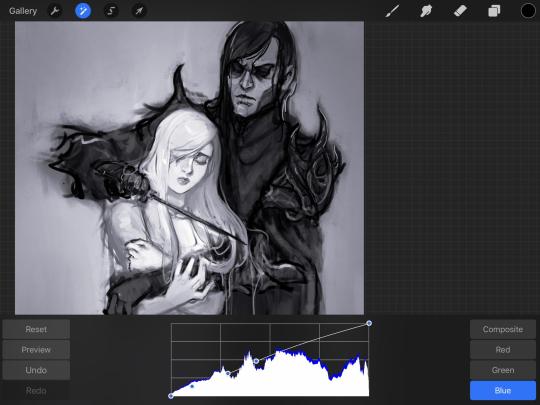
This gives you a neat ol’ base color! I am playing around in the blues, adding soft hues of blue in their figures and the white in this picture can either turn blue, cream, or even green. You don’t have to use Blue, you can use any of the other colors. For me, I’m always drawn to blues. Another cool thing to play around with is Color Balance, which is underneath the same function as Curves.
But if you don’t have any of these, you can add a new layer, and do Multiply.
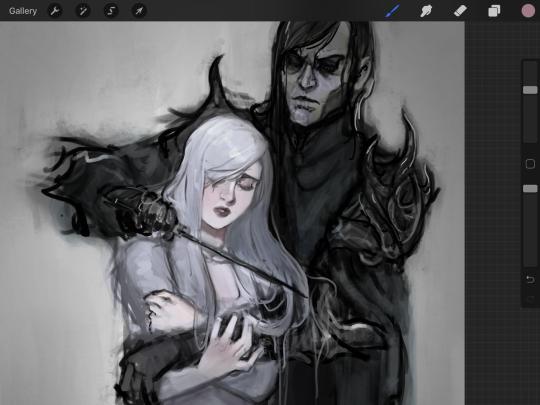
The only drawback to this, of course, is how destaturated (the lack of color) it looks. And yes, that’s an issue you will have and I did run into this while doing this. How I combat this is using additional layer masks. Believe it or not, Alice here was once at a grey scale, looking even more desaturated than Gwen.

For Alice’s face, I went in and use:
- Soft Light because she needed more peach and roses in her skin. Omri’s original drawing gave her a light rose blush so I wanted to do the same.
- Overlay to mask out the black lines from the greyscale I had.
- Lighten which I used to make her lips pinker, her apron’s shadows lighter, and parts of her hair brown.
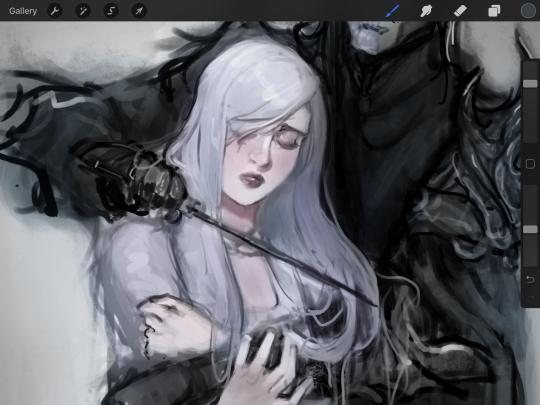
The same went for Gwen, who is, again, very pale. But while she’s supposed to be pale, I didn’t wash her out completely. To add more saturation, I used a combination of Soft Light over my Multiply layer and Overlay to start working at the highlights on her hair, nose, and shoulder.
This little walkthrough isn’t as visual as I like, but with limited software like Fire Alpaca, GIMP, or Paint Tool SAI that don’t have the abilities of Photoshop in terms of color correction and playing around with colors, I really encourage you, readers, to play around with these tools. Using the color picker back and forth, especially after using layer masks, gives you an ability to mix and blend colors. The reason why I work with greyscale or a maroon under paint is that you can create brilliant colors and make a new palette; the trick is to constantly mess around with them. I never go in and flat out color anything, with the exception of things like “angry doodle corner” which is basically what I call my lazy drawings, drawings where I’m just honestly goofing off with.
So in summation...! Or me trying to summarize this.
Experiment and explore with layer masks and adjustments. Whoever says that using these tools isn’t real art, they’re wrong. And please don’t ever be afraid of using references of any sort! Alphonse Mucha is saved ten times over on this computer.
#my art#tutorial#i think#an attempt was made#digital art#procreate#ipad drawing#ipad pro#Alice madness returns#alice liddell#american mcgee's alice#alice asylum
8 notes
·
View notes
Text
SEO Forecasting in Google Sheets
Posted by Tom.Capper
Way back in 2015, I published an article giving away a free, simple, forecasting tool, and talking through use cases for forecasting in SEO. It was a quick, effective way to see if a change to your site traffic is some kind of seasonality you can ignore, something to celebrate, or a worrying sign of traffic loss.
In short: you could enter in a series of data, and it would plot it out on a graph like the image above.
Five years later, I still get people — from former colleagues to complete strangers — asking me about this tool, and more often than not, I’m asked for a version that works directly in spreadsheets.
I find this easy to sympathize with: a spreadsheet is more flexible, easier to debug, easier to expand upon, easier to maintain, and a format that people are very familiar with.
The tradeoff when optimizing for those things is, although I’ve improved on that tool from a few years ago, I’ve still had to keep things manageable in the famously fickle programming environment that is Excel/Google Sheets. That means the template shared in this post uses a simpler, slightly less performant model than some tools with external code execution (e.g. Forecast Forge).
In this post, I’m going to give away a free template, show you how it works and how to use it, and then show you how to build your own (better?) version. (If you need a refresher on when to use forecasting in general, and concepts like confidence intervals, refer to the original article linked above.).
Types of SEO forecast
There is one thing I want to expand on before we get into the spreadsheet stuff: the different types of SEO forecast.
Broadly, I think you can put SEO forecasts into three groups:
“I’m feeling optimistic — add 20% to this year” or similar flat changes to existing figures. More complex versions might only add 20% to certain groups of pages or keywords. I think a lot of agencies use this kind of forecast in pitches, and it comes down to drawing on experience.
Keyword/CTR models, when you estimate a ranking change (or sweeping set of ranking changes), then extrapolate the resulting change in traffic from search volume and CTR data (you can see a similar methodology here). Again, more complex versions might have some basis for the ranking change (e.g. “What if we swapped places with competitor A in every keyword of group X where they currently outrank us?”).
Statistical forecast based on historical data, when you extrapolate from previous trends and seasonality to see what would happen if everything remained constant (same level of marketing activity by you and competitors, etc.).
Type two has its merits, but if you compare the likes of Ahrefs/SEMRush/Sistrix data to your own analytics, you’ll see how hard this is to generalize. As an aside, I don’t think type one is as ridiculous as it looks, but it’s not something I’ll be exploring any further in this post. In any case, the template in this post fits into type three.
What makes this an SEO forecast?
Why, nothing at all. One thing you’ll notice about my description of type three above is that it doesn’t mention anything SEO-specific. It could equally apply to direct traffic, for example. That said, there are a couple of reasons I’m suggesting this specifically as an SEO forecast:
We’re on the Moz Blog and I’m an SEO consultant.
There are better methodologies available for a lot of other channels.
I mentioned that type two above is very challenging, and this is because of the highly non-deterministic nature of SEO and the generally poor quality of detailed data in Search Console and other SEO-specific platforms. In addition, to get an accurate idea of seasonality, you’d need to have been warehousing your Search Console data for at least a couple of years.
For many other channels, high quality, detailed historic data does exist, and relationships are far more predictable, allowing more granular forecasts. For example, for paid search, the Forecast Forge tool I mentioned above builds in factors like keyword-level conversion data and cost-per-click based on your historical data, in a way that would be wildly impractical for SEO.
That said, we can still combine multiple types of forecast in the template below. For example, rather than forecasting the traffic of your site as a whole, you might forecast subfolders separately, or brand/non-brand separately, and you might then apply percentage growth to certain areas or build in anticipated ranking changes. But, we’re getting ahead of ourselves…
How to use the template
FREE TEMPLATE
The first thing you’ll need to do is make a copy (under the “File” menu in the top left, but automatic with the link I’ve included). This means you can enter your own data and play around to your heart’s content, and you can always come back and get a fresh copy later if you need one.
Then, on the first tab, you’ll notice some cells have a green or blue highlight:
You should only be changing values in the colored cells.
The blue cells in column E are basically to make sure everything ends up correctly labelled in the output. So, for example, if you’re pasting session data, or click data, or revenue data, you can set that label. Similarly, if you enter a start month of 2018-01 and 36 months of historic data, the forecast output will begin in January 2021.
On that note, it needs to be monthly data — that’s one of the tradeoffs for simplicity I mentioned earlier. You can paste up to a decade of historic monthly data into column B, starting at cell B2, but there are a couple of things you need to be careful of:
You need at least 24 months of data for the model to have a good idea of seasonality. (If there’s only one January in your historic data, and it was a traffic spike, how am I supposed to know if it was a one-off thing, or an annual thing?)
You need complete months. So if it’s March 25, 2021 when you’re reading this, the last month of data you should include is February 2021.
Make sure you also delete any leftovers of my example data in column B.
Outputs
Once you’ve done that, you can head over to the “Outputs” tab, where you’ll see something like this:
Column C is probably the one you’re interested in. Keep in mind that it’s full of formulas here, but you can copy and paste as values into another sheet, or just go to File > Download > Comma-separated values to get the raw data.
You’ll notice I’m only showing 15 months of forecast in that graph by default, and I’d recommend you do the same. As I mentioned above, the implicit assumption of a forecast is that historical context carries over, unless you explicitly include changed scenarios like COVID lockdowns into your model (more on that in a moment!). The chance of this assumption holding two or three years into the future is low, so even though I’ve provided forecast values further into the future, you should keep that in mind.
The upper and lower bounds shown are 95% confidence intervals — again, you can recap on what that means in my previous post if you so wish.
Advanced use cases
You may by now have noticed the “Advanced” tab:
Although I said I wanted to keep this simple, I felt that given everything that happened in 2020, many people would need to incorporate major external factors into their model.
In the example above, I’ve filled in column B with a variable for whether or not the UK was under COVID lockdown. I’ve used “0.5” to represent that we entered lockdown halfway through March.
You can probably make a better go of this for the relevant factors for your business, but there are a few important things to keep in mind with this tab:
It’s fine to leave it completely untouched if you don’t want to add these extra variables.
Go from left to right — it’s fine to leave column C blank if you’re using column B, but it’s not fine to leave B blank if you’re using C.
If you’re using a “dummy” variable (e.g. “1” for something being active), you need to make sure you fill in the 0s in other cells for at least the period of your historic data.
You can enter future values — for example, if you predict a COVID lockdown in March 2021 (you bastard!), you can enter something in that cell so it’s incorporated into the forecast.
If you don’t enter future values, the model will predict based on this number being zero in the future. So if you’ve entered “branded PPC active” as a dummy variable for historic data, and then left it blank for future periods, the model will assume you have branded PPC turned off in the future.
Adding too much data here for too few historic periods will result in something called “overfit” — I don’t want to get into detail on this, which is why this tab is called “Advanced”, but try not to get carried away.
Here’s some example use cases of this tab for you to consider:
Enter whether branded PPC was active (0 or 1)
Enter whether you’re running TV ads or not
Enter COVID lockdowns
Enter algorithm updates that were significant to your business (one column per update)
Why are my estimates different to your old tool? Is one of them wrong?
There’s two major differences in method between this template and my old tool:
The old tool used Google’s Causal Impact library, the new template uses an Ordinary Least Squares regression.
The old tool captured non-linear trends by using time period squared as a predictive variable (e.g. month 1 = 1, month 2 = 4, month 3 = 9, etc.) and trying to fit the traffic curve to that curve. This is called a quadratic regression. The new tool captures non-linear trends by fitting each time period as a multiple of the previous time period (e.g. month 1 = X * month 2 where X can be any value). This is called an AR(1) model.
If you’re seeing a significant difference in the forecast values between the two, it almost certainly comes down to the second reason, and although it adds a little complexity, in the vast majority of cases the new technique is more realistic and flexible.
It’s also far less likely to predict zero or negative traffic in the case of a severe downwards trend, which is nice.
How does it work?
There’s a hidden tab in the template where you can take a peek, but the short version is the “LINEST()” spreadsheet formula.
The inputs I’m using are:
Dependent variables
Whatever you put as column B in the inputs tab (like traffic)
Independent variables
Linear passing of time
Previous period’s traffic
Dummy variables for 11 months (12th month is represented by the other 11 variables all being 0)
Up to three “advanced” variables
The formula then gives a series of “coefficients” as outputs, which can be multiplied with values and added together to form a prediction like:
“Time period 10” traffic = Intercept + (Time Coefficient * 10) + (Previous Period Coefficient * Period 9 traffic)
You can see in that hidden sheet I’ve labelled and color-coded a lot of the outputs from the Linest formula, which may help you to get started if you want to play around with it yourself.
Potential extensions
If you do want to play around with this yourself, here are some areas I personally have in mind for further expansion that you might find interesting:
Daily data instead of monthly, with weekly seasonality (e.g. dip every Sunday)
Built-in growth targets (e.g. enter 20% growth by end of 2021)
Richard Fergie, whose Forecast Forge tool I mentioned a couple of times above, also provided some great suggestions for improving forecast accuracy with fairly limited extra complexity:
Smooth data and avoid negative predictions in extreme cases by taking the log() of inputs, and providing an exponent of outputs (smoothing data may or may not be a good thing depending on your perspective!).
Regress on the previous 12 months, instead of using the previous 1 month + seasonality (this requires 3 years’ minimum historical data)
I may or may not include some or all of the above myself over time, but if so I’ll make sure I use the same link and make a note of it in the spreadsheet, so this article always links to the most up-to-date version.
If you’ve made it this far, what would you like to see? Let me know in the comments!
Sign up for The Moz Top 10, a semimonthly mailer updating you on the top ten hottest pieces of SEO news, tips, and rad links uncovered by the Moz team. Think of it as your exclusive digest of stuff you don't have time to hunt down but want to read!
0 notes
Text
SEO Forecasting in Google Sheets
Posted by Tom.Capper
Way back in 2015, I published an article giving away a free, simple, forecasting tool, and talking through use cases for forecasting in SEO. It was a quick, effective way to see if a change to your site traffic is some kind of seasonality you can ignore, something to celebrate, or a worrying sign of traffic loss.
In short: you could enter in a series of data, and it would plot it out on a graph like the image above.
Five years later, I still get people — from former colleagues to complete strangers — asking me about this tool, and more often than not, I’m asked for a version that works directly in spreadsheets.
I find this easy to sympathize with: a spreadsheet is more flexible, easier to debug, easier to expand upon, easier to maintain, and a format that people are very familiar with.
The tradeoff when optimizing for those things is, although I’ve improved on that tool from a few years ago, I’ve still had to keep things manageable in the famously fickle programming environment that is Excel/Google Sheets. That means the template shared in this post uses a simpler, slightly less performant model than some tools with external code execution (e.g. Forecast Forge).
In this post, I’m going to give away a free template, show you how it works and how to use it, and then show you how to build your own (better?) version. (If you need a refresher on when to use forecasting in general, and concepts like confidence intervals, refer to the original article linked above.).
Types of SEO forecast
There is one thing I want to expand on before we get into the spreadsheet stuff: the different types of SEO forecast.
Broadly, I think you can put SEO forecasts into three groups:
“I’m feeling optimistic — add 20% to this year” or similar flat changes to existing figures. More complex versions might only add 20% to certain groups of pages or keywords. I think a lot of agencies use this kind of forecast in pitches, and it comes down to drawing on experience.
Keyword/CTR models, when you estimate a ranking change (or sweeping set of ranking changes), then extrapolate the resulting change in traffic from search volume and CTR data (you can see a similar methodology here). Again, more complex versions might have some basis for the ranking change (e.g. “What if we swapped places with competitor A in every keyword of group X where they currently outrank us?”).
Statistical forecast based on historical data, when you extrapolate from previous trends and seasonality to see what would happen if everything remained constant (same level of marketing activity by you and competitors, etc.).
Type two has its merits, but if you compare the likes of Ahrefs/SEMRush/Sistrix data to your own analytics, you’ll see how hard this is to generalize. As an aside, I don’t think type one is as ridiculous as it looks, but it’s not something I’ll be exploring any further in this post. In any case, the template in this post fits into type three.
What makes this an SEO forecast?
Why, nothing at all. One thing you’ll notice about my description of type three above is that it doesn’t mention anything SEO-specific. It could equally apply to direct traffic, for example. That said, there are a couple of reasons I’m suggesting this specifically as an SEO forecast:
We’re on the Moz Blog and I’m an SEO consultant.
There are better methodologies available for a lot of other channels.
I mentioned that type two above is very challenging, and this is because of the highly non-deterministic nature of SEO and the generally poor quality of detailed data in Search Console and other SEO-specific platforms. In addition, to get an accurate idea of seasonality, you’d need to have been warehousing your Search Console data for at least a couple of years.
For many other channels, high quality, detailed historic data does exist, and relationships are far more predictable, allowing more granular forecasts. For example, for paid search, the Forecast Forge tool I mentioned above builds in factors like keyword-level conversion data and cost-per-click based on your historical data, in a way that would be wildly impractical for SEO.
That said, we can still combine multiple types of forecast in the template below. For example, rather than forecasting the traffic of your site as a whole, you might forecast subfolders separately, or brand/non-brand separately, and you might then apply percentage growth to certain areas or build in anticipated ranking changes. But, we’re getting ahead of ourselves…
How to use the template
FREE TEMPLATE
The first thing you’ll need to do is make a copy (under the “File” menu in the top left, but automatic with the link I’ve included). This means you can enter your own data and play around to your heart’s content, and you can always come back and get a fresh copy later if you need one.
Then, on the first tab, you’ll notice some cells have a green or blue highlight:
You should only be changing values in the colored cells.
The blue cells in column E are basically to make sure everything ends up correctly labelled in the output. So, for example, if you’re pasting session data, or click data, or revenue data, you can set that label. Similarly, if you enter a start month of 2018-01 and 36 months of historic data, the forecast output will begin in January 2021.
On that note, it needs to be monthly data — that’s one of the tradeoffs for simplicity I mentioned earlier. You can paste up to a decade of historic monthly data into column B, starting at cell B2, but there are a couple of things you need to be careful of:
You need at least 24 months of data for the model to have a good idea of seasonality. (If there’s only one January in your historic data, and it was a traffic spike, how am I supposed to know if it was a one-off thing, or an annual thing?)
You need complete months. So if it’s March 25, 2021 when you’re reading this, the last month of data you should include is February 2021.
Make sure you also delete any leftovers of my example data in column B.
Outputs
Once you’ve done that, you can head over to the “Outputs” tab, where you’ll see something like this:
Column C is probably the one you’re interested in. Keep in mind that it’s full of formulas here, but you can copy and paste as values into another sheet, or just go to File > Download > Comma-separated values to get the raw data.
You’ll notice I’m only showing 15 months of forecast in that graph by default, and I’d recommend you do the same. As I mentioned above, the implicit assumption of a forecast is that historical context carries over, unless you explicitly include changed scenarios like COVID lockdowns into your model (more on that in a moment!). The chance of this assumption holding two or three years into the future is low, so even though I’ve provided forecast values further into the future, you should keep that in mind.
The upper and lower bounds shown are 95% confidence intervals — again, you can recap on what that means in my previous post if you so wish.
Advanced use cases
You may by now have noticed the “Advanced” tab:
Although I said I wanted to keep this simple, I felt that given everything that happened in 2020, many people would need to incorporate major external factors into their model.
In the example above, I’ve filled in column B with a variable for whether or not the UK was under COVID lockdown. I’ve used “0.5” to represent that we entered lockdown halfway through March.
You can probably make a better go of this for the relevant factors for your business, but there are a few important things to keep in mind with this tab:
It’s fine to leave it completely untouched if you don’t want to add these extra variables.
Go from left to right — it’s fine to leave column C blank if you’re using column B, but it’s not fine to leave B blank if you’re using C.
If you’re using a “dummy” variable (e.g. “1” for something being active), you need to make sure you fill in the 0s in other cells for at least the period of your historic data.
You can enter future values — for example, if you predict a COVID lockdown in March 2021 (you bastard!), you can enter something in that cell so it’s incorporated into the forecast.
If you don’t enter future values, the model will predict based on this number being zero in the future. So if you’ve entered “branded PPC active” as a dummy variable for historic data, and then left it blank for future periods, the model will assume you have branded PPC turned off in the future.
Adding too much data here for too few historic periods will result in something called “overfit” — I don’t want to get into detail on this, which is why this tab is called “Advanced”, but try not to get carried away.
Here’s some example use cases of this tab for you to consider:
Enter whether branded PPC was active (0 or 1)
Enter whether you’re running TV ads or not
Enter COVID lockdowns
Enter algorithm updates that were significant to your business (one column per update)
Why are my estimates different to your old tool? Is one of them wrong?
There’s two major differences in method between this template and my old tool:
The old tool used Google’s Causal Impact library, the new template uses an Ordinary Least Squares regression.
The old tool captured non-linear trends by using time period squared as a predictive variable (e.g. month 1 = 1, month 2 = 4, month 3 = 9, etc.) and trying to fit the traffic curve to that curve. This is called a quadratic regression. The new tool captures non-linear trends by fitting each time period as a multiple of the previous time period (e.g. month 1 = X * month 2 where X can be any value). This is called an AR(1) model.
If you’re seeing a significant difference in the forecast values between the two, it almost certainly comes down to the second reason, and although it adds a little complexity, in the vast majority of cases the new technique is more realistic and flexible.
It’s also far less likely to predict zero or negative traffic in the case of a severe downwards trend, which is nice.
How does it work?
There’s a hidden tab in the template where you can take a peek, but the short version is the “LINEST()” spreadsheet formula.
The inputs I’m using are:
Dependent variables
Whatever you put as column B in the inputs tab (like traffic)
Independent variables
Linear passing of time
Previous period’s traffic
Dummy variables for 11 months (12th month is represented by the other 11 variables all being 0)
Up to three “advanced” variables
The formula then gives a series of “coefficients” as outputs, which can be multiplied with values and added together to form a prediction like:
“Time period 10” traffic = Intercept + (Time Coefficient * 10) + (Previous Period Coefficient * Period 9 traffic)
You can see in that hidden sheet I’ve labelled and color-coded a lot of the outputs from the Linest formula, which may help you to get started if you want to play around with it yourself.
Potential extensions
If you do want to play around with this yourself, here are some areas I personally have in mind for further expansion that you might find interesting:
Daily data instead of monthly, with weekly seasonality (e.g. dip every Sunday)
Built-in growth targets (e.g. enter 20% growth by end of 2021)
Richard Fergie, whose Forecast Forge tool I mentioned a couple of times above, also provided some great suggestions for improving forecast accuracy with fairly limited extra complexity:
Smooth data and avoid negative predictions in extreme cases by taking the log() of inputs, and providing an exponent of outputs (smoothing data may or may not be a good thing depending on your perspective!).
Regress on the previous 12 months, instead of using the previous 1 month + seasonality (this requires 3 years’ minimum historical data)
I may or may not include some or all of the above myself over time, but if so I’ll make sure I use the same link and make a note of it in the spreadsheet, so this article always links to the most up-to-date version.
If you’ve made it this far, what would you like to see? Let me know in the comments!
Sign up for The Moz Top 10, a semimonthly mailer updating you on the top ten hottest pieces of SEO news, tips, and rad links uncovered by the Moz team. Think of it as your exclusive digest of stuff you don't have time to hunt down but want to read!
#túi_giấy_epacking_việt_nam #túi_giấy_epacking #in_túi_giấy_giá_rẻ #in_túi_giấy #epackingvietnam #tuigiayepacking
0 notes
Text
SEO Forecasting in Google Sheets
Posted by Tom.Capper
Way back in 2015, I published an article giving away a free, simple, forecasting tool, and talking through use cases for forecasting in SEO. It was a quick, effective way to see if a change to your site traffic is some kind of seasonality you can ignore, something to celebrate, or a worrying sign of traffic loss.
In short: you could enter in a series of data, and it would plot it out on a graph like the image above.
Five years later, I still get people — from former colleagues to complete strangers — asking me about this tool, and more often than not, I’m asked for a version that works directly in spreadsheets.
I find this easy to sympathize with: a spreadsheet is more flexible, easier to debug, easier to expand upon, easier to maintain, and a format that people are very familiar with.
The tradeoff when optimizing for those things is, although I’ve improved on that tool from a few years ago, I’ve still had to keep things manageable in the famously fickle programming environment that is Excel/Google Sheets. That means the template shared in this post uses a simpler, slightly less performant model than some tools with external code execution (e.g. Forecast Forge).
In this post, I’m going to give away a free template, show you how it works and how to use it, and then show you how to build your own (better?) version. (If you need a refresher on when to use forecasting in general, and concepts like confidence intervals, refer to the original article linked above.).
Types of SEO forecast
There is one thing I want to expand on before we get into the spreadsheet stuff: the different types of SEO forecast.
Broadly, I think you can put SEO forecasts into three groups:
“I’m feeling optimistic — add 20% to this year” or similar flat changes to existing figures. More complex versions might only add 20% to certain groups of pages or keywords. I think a lot of agencies use this kind of forecast in pitches, and it comes down to drawing on experience.
Keyword/CTR models, when you estimate a ranking change (or sweeping set of ranking changes), then extrapolate the resulting change in traffic from search volume and CTR data (you can see a similar methodology here). Again, more complex versions might have some basis for the ranking change (e.g. “What if we swapped places with competitor A in every keyword of group X where they currently outrank us?”).
Statistical forecast based on historical data, when you extrapolate from previous trends and seasonality to see what would happen if everything remained constant (same level of marketing activity by you and competitors, etc.).
Type two has its merits, but if you compare the likes of Ahrefs/SEMRush/Sistrix data to your own analytics, you’ll see how hard this is to generalize. As an aside, I don’t think type one is as ridiculous as it looks, but it’s not something I’ll be exploring any further in this post. In any case, the template in this post fits into type three.
What makes this an SEO forecast?
Why, nothing at all. One thing you’ll notice about my description of type three above is that it doesn’t mention anything SEO-specific. It could equally apply to direct traffic, for example. That said, there are a couple of reasons I’m suggesting this specifically as an SEO forecast:
We’re on the Moz Blog and I’m an SEO consultant.
There are better methodologies available for a lot of other channels.
I mentioned that type two above is very challenging, and this is because of the highly non-deterministic nature of SEO and the generally poor quality of detailed data in Search Console and other SEO-specific platforms. In addition, to get an accurate idea of seasonality, you’d need to have been warehousing your Search Console data for at least a couple of years.
For many other channels, high quality, detailed historic data does exist, and relationships are far more predictable, allowing more granular forecasts. For example, for paid search, the Forecast Forge tool I mentioned above builds in factors like keyword-level conversion data and cost-per-click based on your historical data, in a way that would be wildly impractical for SEO.
That said, we can still combine multiple types of forecast in the template below. For example, rather than forecasting the traffic of your site as a whole, you might forecast subfolders separately, or brand/non-brand separately, and you might then apply percentage growth to certain areas or build in anticipated ranking changes. But, we’re getting ahead of ourselves…
How to use the template
FREE TEMPLATE
The first thing you’ll need to do is make a copy (under the “File” menu in the top left, but automatic with the link I’ve included). This means you can enter your own data and play around to your heart’s content, and you can always come back and get a fresh copy later if you need one.
Then, on the first tab, you’ll notice some cells have a green or blue highlight:
You should only be changing values in the colored cells.
The blue cells in column E are basically to make sure everything ends up correctly labelled in the output. So, for example, if you’re pasting session data, or click data, or revenue data, you can set that label. Similarly, if you enter a start month of 2018-01 and 36 months of historic data, the forecast output will begin in January 2021.
On that note, it needs to be monthly data — that’s one of the tradeoffs for simplicity I mentioned earlier. You can paste up to a decade of historic monthly data into column B, starting at cell B2, but there are a couple of things you need to be careful of:
You need at least 24 months of data for the model to have a good idea of seasonality. (If there’s only one January in your historic data, and it was a traffic spike, how am I supposed to know if it was a one-off thing, or an annual thing?)
You need complete months. So if it’s March 25, 2021 when you’re reading this, the last month of data you should include is February 2021.
Make sure you also delete any leftovers of my example data in column B.
Outputs
Once you’ve done that, you can head over to the “Outputs” tab, where you’ll see something like this:
Column C is probably the one you’re interested in. Keep in mind that it’s full of formulas here, but you can copy and paste as values into another sheet, or just go to File > Download > Comma-separated values to get the raw data.
You’ll notice I’m only showing 15 months of forecast in that graph by default, and I’d recommend you do the same. As I mentioned above, the implicit assumption of a forecast is that historical context carries over, unless you explicitly include changed scenarios like COVID lockdowns into your model (more on that in a moment!). The chance of this assumption holding two or three years into the future is low, so even though I’ve provided forecast values further into the future, you should keep that in mind.
The upper and lower bounds shown are 95% confidence intervals — again, you can recap on what that means in my previous post if you so wish.
Advanced use cases
You may by now have noticed the “Advanced” tab:
Although I said I wanted to keep this simple, I felt that given everything that happened in 2020, many people would need to incorporate major external factors into their model.
In the example above, I’ve filled in column B with a variable for whether or not the UK was under COVID lockdown. I’ve used “0.5” to represent that we entered lockdown halfway through March.
You can probably make a better go of this for the relevant factors for your business, but there are a few important things to keep in mind with this tab:
It’s fine to leave it completely untouched if you don’t want to add these extra variables.
Go from left to right — it’s fine to leave column C blank if you’re using column B, but it’s not fine to leave B blank if you’re using C.
If you’re using a “dummy” variable (e.g. “1” for something being active), you need to make sure you fill in the 0s in other cells for at least the period of your historic data.
You can enter future values — for example, if you predict a COVID lockdown in March 2021 (you bastard!), you can enter something in that cell so it’s incorporated into the forecast.
If you don’t enter future values, the model will predict based on this number being zero in the future. So if you’ve entered “branded PPC active” as a dummy variable for historic data, and then left it blank for future periods, the model will assume you have branded PPC turned off in the future.
Adding too much data here for too few historic periods will result in something called “overfit” — I don’t want to get into detail on this, which is why this tab is called “Advanced”, but try not to get carried away.
Here’s some example use cases of this tab for you to consider:
Enter whether branded PPC was active (0 or 1)
Enter whether you’re running TV ads or not
Enter COVID lockdowns
Enter algorithm updates that were significant to your business (one column per update)
Why are my estimates different to your old tool? Is one of them wrong?
There’s two major differences in method between this template and my old tool:
The old tool used Google’s Causal Impact library, the new template uses an Ordinary Least Squares regression.
The old tool captured non-linear trends by using time period squared as a predictive variable (e.g. month 1 = 1, month 2 = 4, month 3 = 9, etc.) and trying to fit the traffic curve to that curve. This is called a quadratic regression. The new tool captures non-linear trends by fitting each time period as a multiple of the previous time period (e.g. month 1 = X * month 2 where X can be any value). This is called an AR(1) model.
If you’re seeing a significant difference in the forecast values between the two, it almost certainly comes down to the second reason, and although it adds a little complexity, in the vast majority of cases the new technique is more realistic and flexible.
It’s also far less likely to predict zero or negative traffic in the case of a severe downwards trend, which is nice.
How does it work?
There’s a hidden tab in the template where you can take a peek, but the short version is the “LINEST()” spreadsheet formula.
The inputs I’m using are:
Dependent variables
Whatever you put as column B in the inputs tab (like traffic)
Independent variables
Linear passing of time
Previous period’s traffic
Dummy variables for 11 months (12th month is represented by the other 11 variables all being 0)
Up to three “advanced” variables
The formula then gives a series of “coefficients” as outputs, which can be multiplied with values and added together to form a prediction like:
“Time period 10” traffic = Intercept + (Time Coefficient * 10) + (Previous Period Coefficient * Period 9 traffic)
You can see in that hidden sheet I’ve labelled and color-coded a lot of the outputs from the Linest formula, which may help you to get started if you want to play around with it yourself.
Potential extensions
If you do want to play around with this yourself, here are some areas I personally have in mind for further expansion that you might find interesting:
Daily data instead of monthly, with weekly seasonality (e.g. dip every Sunday)
Built-in growth targets (e.g. enter 20% growth by end of 2021)
Richard Fergie, whose Forecast Forge tool I mentioned a couple of times above, also provided some great suggestions for improving forecast accuracy with fairly limited extra complexity:
Smooth data and avoid negative predictions in extreme cases by taking the log() of inputs, and providing an exponent of outputs (smoothing data may or may not be a good thing depending on your perspective!).
Regress on the previous 12 months, instead of using the previous 1 month + seasonality (this requires 3 years’ minimum historical data)
I may or may not include some or all of the above myself over time, but if so I’ll make sure I use the same link and make a note of it in the spreadsheet, so this article always links to the most up-to-date version.
If you’ve made it this far, what would you like to see? Let me know in the comments!
Sign up for The Moz Top 10, a semimonthly mailer updating you on the top ten hottest pieces of SEO news, tips, and rad links uncovered by the Moz team. Think of it as your exclusive digest of stuff you don't have time to hunt down but want to read!
0 notes
Last Seen Blogs

shakehandstt
shakehands Dresden 🏓

ekremcoban
Bir rüyanın içinde yaşıyorum

ameerodho1
Untitled

eych-jee-blog
AV@R

pretttydollly
Pretty Dolly