#OpenLayers
Explore tagged Tumblr posts
Visit Tumblr Blog
Explore Tumblr blogs with no restrictions, modern design and the best experience.
Last Seen Tumblr Blogs


Fun Fact
Mobile Tumblr US users spend an average of 4.04 minutes per session on the app.
Text
Seri Bluff: Menguasai QGIS Desktop 3.34.x LTR.
Dapatkan harga Video Tutorial "Seri Bluff: Menguasai QGIS Desktop 3.34.x LTR" hanya Rp. 99.000,- ( Harga asli Rp. 279.000). Hanya berlaku 5 hari sampai 21/02/2025
#attribute query#select by attribute#feature info#opensource#gis operator#geodatabase#spatial query#select by location#location allocation#location intelligence#location based services#gis#geoserver#arcgis#esri#openlayers#wms#wfs#web mapping#leaflet#shapefile#qgis#geonode#freelancer#gis analyst#gis jobs#webgis#development#gis professional#project management
0 notes
Text
Data survey lapangan dalam UTM dapat di kelola dengan baik menggunakan QGIS.
Data tabular survey lapangan yang di lengkapi dengan titik koordinat UTM zone 47 N dapat di plot ke atas aplikasi QGIS dimana sebaran data ini akan tampil dan memudahkan dalam analisis spasial, pemodelan spasial dan pengambilan keputusan. Dapatkan video tutorialnya disini:
#attribute query#select by attribute#feature info#opensource#gis operator#geodatabase#spatial query#select by location#location allocation#location intelligence#location based services#gis#geoserver#arcgis#esri#openlayers#wms#wfs#web mapping#leaflet#shapefile#qgis#geonode#freelancer#gis analyst#gis jobs#webgis#development#gis professional#project management
0 notes
Text
So let's get into the nitty-gritty technical details behind my latest project, the National Blue Trail round-trip search application available here:
This project has been fun with me learning a lot about plenty of technologies, including QGis, PostGIS, pgRouting, GTFS files, OpenLayers, OpenTripPlanner and Vita.
So let's start!
In most of my previous GIS projects I have always used custom made tools written in ruby or Javascript and never really tried any of the "proper" GIS tools, so it was a good opportunity for me to learn a bit of QGIS. I hoped I could do most of the work there, but soon realized it's not fully up to the job, so I had to extend the bits to other tools at the end. For most purposes I used QGis to import data from various sources, and export the results to PostGIS, then do the calculations in PostGIS, re-import the results from there and save them into GeoJSON. For this workflow QGIS was pretty okay to use. I also managed to use it for some minor editing as well.
I did really hope I could avoid PostGIS, and do all of the calculation inside QGIS, but its routing engine is both slow, and simply not designed for multiple uses. For example after importing the map of Hungary and trying to find a single route between two points it took around 10-15 minutes just to build the routing map, then a couple seconds to calculate the actual route. There is no way to save the routing map (at least I didn't find any that did not involve coding in Python), so if you want to calculate the routes again you had to wait the 10-15 minute of tree building once more. Since I had to calculate around 20.000 of routes at least, I quickly realized this will simply never work out.
I did find the QNEAT3 plugin which did allow one to do a N-M search of routes between two set of points, but it was both too slow and very disk space intense. It also calculated many more routes than needed, as you couldn't add a filter. In the end it took 23 hours for it to calculate the routes AND it created a temporary file of more than 300Gb in the process. After realizing I made a mistake in the input files I quickly realized I won't wait this time again and started looking at PostGIS + pgRouting instead.
Before we move over to them two very important lessons I learned in QGIS:
There is no auto-save. If you forget to save and then 2 hours later QGIS crashes for no reason then you have to restart your work
Any layer that is in editing mode is not getting saved when you press the save button. So even if you don't forget to save by pressing CTRL/CMD+S every 5 seconds like every sane person who used Adobe products ever in their lifetimes does, you will still lose your work two hours later when QGIS finally crashes if you did not exit the editing mode for all of the layers
----
So let's move on to PostGIS.
It's been a while since I last used PostGIS - it was around 11 years ago for a web based object tracking project - but it was fairly easy to get it going. Importing data from QGIS (more specifically pushing data from QGIS to PostGIS) was pretty convenient, so I could fill up the tables with the relevant points and lines quite easily. The only hard part was getting pgRouting working, mostly because there aren't any good tutorials on how to import OpenStreetMap data into it. I did find a blog post that used a freeware (not open source) tool to do this, and another project that seems dead (last update was 2 years ago) but at least it was open source, and actually worked well. You can find the scripts I used on the GitHub page's README.
Using pgRouting was okay - documentation is a bit hard to read as it's more of a specification, but I did find the relevant examples useful. It also supports both A* search (which is much quicker than plain Dijsktra on a 2D map) and searching between N*M points with a filter applied, so I hoped it will be quicker than QGIS, but I never expected how quick it was - it only took 5 seconds to calculate the same results it took QGIS 23 hours and 300GB of disk space! Next time I have a GIS project I'm fairly certain I will not shy away from using PostGIS for calculations.
There were a couple of hard parts though, most notably:
ST_Collect will nicely merge multiple lines into one single large line, but the direction of that line looked a bit random, so I had to add some extra code to fix it later.
ST_Split was similarly quite okay to use (although it took me a while to realize I needed to use ST_Snap with proper settings for it to work), but yet again the ordering of the segments were off a slight bit, but I was too lazy to fix it with code - I just updated the wrong values by hand.
----
The next project I had never used in the past was OpenTripPlanner. I did have a public transport project a couple years ago but back then tools like this and the required public databases were very hard to come by, so I opted into using Google's APIs (with a hard limit to make sure this will never be more expensive than the free tier Google gives you each month), but I have again been blown away how good tooling has become since then. GTFS files are readily available for a lot of sources (although not all - MAV, the Hungarian Railways has it for example behind a registration paywall, and although English bus companies are required to publish this by law - and do it nicely, Scottish ones don't always do it, and even if they do finding them is not always easy. Looks to be something I should push within my party of choice as my foray into politics)
There are a couple of caveats with OpenTripPlanner, the main one being it does require a lot of RAM. Getting the Hungarian map, and the timetables from both Volánbusz (the state operated coach company) and BKK (the public transport company of Budapest) required around 13GB of RAM - and by default docker was only given 8, so it did crash at first with me not realizing why.
The interface of OpenTripPlanner is also a bit too simple, and it was fairly hard for me to stop it from giving me trips that only involve walking - I deliberately wanted it to only search between bus stops involving actual bus travel as the walking part I had already done using PostGIS. I did however check if I could have used OpenTripPlanner for that part as well, and while it did work somewhat it didn't really give optimal results for my use case, so I was relieved the time I spend in QGIS - PostGIS was not in vain.
The API of OpenTripPlanner was pretty neat though, it did mimic Google's route searching API as much as possible which I used in the past so parsing the results was quite easy.
----
Once we had all of the data ready, the final bit was converting it to something I can use in JavaScript. For this I used my trusted scripting language I use for such occasion for almost 20 years now: ruby. The only interesting part here was the use of Encoded Polylines (which is Google's standard of sending LineString information over inside JSON files), but yet again I did find enough tools to handle this pretty obscure format.
----
Final part was the display. While I usually used Leaflet in the past I really wanted to try OpenLayers, I had another project I had not yet finished where Leaflet was simply too slow for the data, and I had a very quick look at OpenLayers and saw it could display it with an acceptable performance, so I believed it might be a good opportunity for me to learn it. It was pretty okay, although I do believe transparent layers seem to be pretty slow under it without WebGL rendering, and I could not get WebGL working as it is still only available as a preview with no documentation (and the interface has changed completely in the last 2 months since I last looked at it). In any case OpenLayers was still a good choice - it had built in support for Encoded Polylines, GPX Export, Feature selection by hovering, and a nice styling API. It also required me to use Vita for building the application, which was a nice addition to my pretty lacking knowledge of JavaScript frameworks.
----
All in all this was a fun project, I definitely learned a lot I can use in the future. Seeing how well OpenTripPlanner is, and not just for public transport but also walking and cycling, did give me a couple new ideas I could not envision in the past because I could only do it with Google's Routing API which would have been prohibitively expensive. Now I just need to start lobbying for the Bus Services Act 2017 or something similar to be implemented in Scotland as well
21 notes
·
View notes
Text

03 and 04/30 days of productivity ✨️ 08/14/2023
Sunday was a rest and reset day, and today was work all day. I did some hacker rank problems and started using Leaflet for maps! It has react components to use so I'm hoping it's more straightforward than openlayers. Tomorrow's my friend's birthday, so I'll get to call her tomorrow too ☺️
#codeblr#studyblr#study motivation#coding#programming#progblr#study aesthetic#studying#tech#30 day challenge#100 days of productivity#my post
24 notes
·
View notes
Text
#OpenLayers v10.6.0 released
https://github.com/openlayers/openlayers/releases/tag/v10.6.0
0 notes
Text
Geographic Information Systems (GIS) Development

Geographic Information Systems (GIS) have revolutionized the way we interact with spatial data. From city planning to environmental monitoring and logistics, GIS is a powerful tool that combines maps with data for smarter decision-making. In this post, we'll explore what GIS is, the technologies involved, and how to get started with GIS application development.
What is GIS?
GIS stands for Geographic Information Systems, which are tools and systems used to capture, store, analyze, manage, and visualize spatial or geographic data. These systems are essential for analyzing patterns, relationships, and geographic trends across various fields.
Applications of GIS
Urban Planning: Design infrastructure based on population density and land usage data.
Environmental Monitoring: Track climate changes, deforestation, or water quality.
Disaster Management: Map hazard zones and optimize emergency response logistics.
Transportation & Logistics: Optimize routes, manage traffic, and plan delivery systems.
Agriculture: Analyze crop health and soil conditions using satellite imagery.
Key Components of GIS Development
Data: Spatial data (coordinates, maps, images) and attribute data (information about the location).
Maps: Visual representations created from layers of geographic data.
Tools: GIS software and libraries for manipulating and analyzing the data.
Applications: Web or mobile interfaces for users to interact with spatial information.
Popular Tools and Libraries
QGIS: Open-source GIS desktop application for analyzing and visualizing spatial data.
ArcGIS: Enterprise-grade software suite by Esri, used for advanced GIS development.
Leaflet.js: Lightweight JavaScript library for creating interactive maps.
Mapbox: Modern mapping platform with customizable maps and location-based APIs.
GDAL/OGR: Libraries for raster and vector geospatial data manipulation.
PostGIS: A spatial database extender for PostgreSQL.
Basic GIS Development Workflow
Collect Geographic Data: Use satellite data, GPS devices, or public databases like OpenStreetMap.
Preprocess the Data: Clean, convert, and format the data (e.g., shapefiles, GeoJSON, KML).
Store Data: Use spatial databases like PostGIS to manage geodata efficiently.
Develop the Interface: Create web or mobile applications using Leaflet, Mapbox, or OpenLayers.
Analyze Spatial Relationships: Implement queries and analytics to derive insights.
Visualize the Results: Present data in layers, markers, and thematic maps.
Sample Project: Visualizing Population Density with Leaflet.js
<script> var map = L.map('map').setView([40.7128, -74.0060], 11); L.tileLayer('https://{s}.tile.openstreetmap.org/{z}/{x}/{y}.png').addTo(map); // Add GeoJSON layer L.geoJSON(populationData, { style: function (feature) { return { fillColor: getColor(feature.properties.density), weight: 1, opacity: 1, color: 'white', fillOpacity: 0.7 }; } }).addTo(map); </script>
Challenges in GIS Development
Handling large datasets and real-time updates.
Ensuring accuracy and relevance of geographic data.
Managing performance and rendering complex map layers.
Integrating with external services and APIs.
Conclusion
GIS development is a rewarding field that blends programming, data science, and geography. As more industries recognize the value of spatial insights, GIS applications will continue to play a vital role in shaping our world. Whether you're visualizing data on a map or building complex spatial analysis tools, GIS offers endless opportunities for developers to create impactful solutions.
1 note
·
View note
Text
Andreessen Horowitz, kripto dünyasında 25 yeni projeyi destekliyor!

Kripto Arenasında Yenilikçi Projeler Yükselişte
Andreessen Horowitz (a16z), kripto dünyasının lider isimlerinden biri olarak, "Kripto Startup Hızlandırıcı Programı 2024" çerçevesinde 25 seçkin kripto girişimine desteğini açıkladı. Bu program, kripto sektöründeki yenilikçi projelere önemli bir ivme kazandırmayı hedefliyor. Çeşitli Alanlarda Faaliyet Gösteren Girişimler Seçilen 25 kripto girişimi, farklı alanlarda faaliyet göstererek çeşitlilik sunuyor. Örneğin, yapay zeka odaklı güvenlik sağlayan Hungry Cats Studio ve akıllı sözleşme uygulamaları yaratan Launcher gibi projeler, sektörde çığır açacak potansiyele sahip. Proje Listesi - AminoChain: Merkeziyetsiz biyo-numune piyasası - Collar Networks: Geleceğin yatırım bankası olma hedefiyle ilerliyor - Compass Labs: DeFi alanı için yeni standartlar geliştiriyor - Hungry Cats Studio: Yapay zeka temelli güvenlik çözümleri sunuyor - Launcher: Akıllı sözleşme uygulamaları oluşturma platformu - MagicBlock: Solana ve SVM zinciri üzerinde oyun geliştirme - NEBRA Labs: Blok zincirlerinde ölçeklenebilirlik sağlayan Ar-Ge firması - Neynar: Farcaster altyapısını geliştiren bir şirket - NodeKit: Merkeziyetsizlik ve rollup'lar konusunda birlikte çalışabilirlik sağlayan bir şirket - Nosh: Merkeziyetsiz gıda dağıtım protokolü - OpenLayer: Web3 alanını doğrulama hesaplaması ile ölçeklendirme - OpenTrade: Kurumsal kredi ve getiri ürünleri sunuyor - Playmint: Bağımsız oyun dünyası sunuyor - Roux: Dijital mutfak ve yemek alanı platformu - Sablier: Web3 token dağıtım altyapısı sağlıyor - Scrypted: Yapay zeka, oyun ve merkeziyetsizlik geliştirmeleri sunuyor - Spire: Atomik bireştirilebilirlik sağlayan bir sıfır bilgi kanıtı uygulama zinciri ağı - Strobe: İzin gerektirmeyen ve şeffaf piyasalar için DeFi ölçeklendirme ağı - taralli labs: Merkeziyetsiz sıfır bilgi kanıtı tedarik zinciri protokolü - Tata Bazaar: Fiziksel ve dijital modanın entegrasyonunu sağlayan bir platform - TITLES: Yaratıcı programlar için yapay zeka modelleri - Tranched: Blok zinciri teknolojisiyle menkul kıymet özelleştirme otomasyonu - Tweed: Blok zinciri tabanlı uygulamalara cüzdan ve ödeme çözümleri sunuyor - Valyu Network: Yapay zeka uygulamaları için güvenilir veri sağlayıcı - zkPassport: Devletler tarafından verilen pasaportların doğrulanması hizmeti a16z Desteğiyle Yeni Yolculuklar a16z'nin desteğiyle kripto dünyasında yer alacak bu 25 yenilikçi proje, dijital ekonomide yeni bir dönemin kapılarını aralayabilir. Bu projelerin kripto dünyasında ne tür bir etki yaratacağını görmek için heyecanla bekliyoruz. Önemli uyarı: Bu içerik yatırım tavsiyesi değildir ve yalnızca bilgilendirme amaçlıdır. Read the full article
0 notes
Text
Openlayer: LLM Evals and Monitoring https://t.co/0cJr4SACZI
http://dlvr.it/SzpwQS
0 notes
Text
Geoserver: A comprehensive overview of Spatial datasets and web services
GeoServer is open-source software for sharing, processing and creating web services for geospatial data. It plays a vital role in geospatial information systems (GIS) and web mapping applications.
Here's a comprehensive view of Geoserver-
Geospatial Data Support: GeoServer handles diverse geospatial formats, encompassing both vector and raster data.
Web Service Standards: It complies with web service standards like WMS, WFS, WCS, and WMTS, facilitating geospatial data sharing and web visualization.
WMS (Web Map Service): It serves customizable maps (PNG, JPEG) with dynamic rendering based on user requests.
WFS (Web Feature Service): WFS enables querying, retrieval, and editing of geographic features, allowing vector data access and manipulation.
WCS (Web Coverage Service): GeoServer distributes raster data (e.g., GeoTIFF or NetCDF) via WCS, facilitating user access to coverage data.
WMTS (Web Map Tile Service): It supports WMTS for efficient pre-rendered map tiles in a consistent grid, enhancing web mapping application performance.
RESTful Services: Ita offers a RESTful API for developers and custom apps to access geospatial data and services via HTTP requests.
Data Styling and Symbology: Users can customize data layer styles with GeoServer using the flexible Styled Layer Descriptor (SLD) standard.
Security and Access Control: GeoServer secures data and services through access control, supporting authentication and authorization to restrict access to authorized users.
Data Reprojection: GeoServer on-the-fly reprojection serves data in various coordinate reference systems (CRS) to meet client needs
Data Versioning and Publication: GeoServer supports dataset versioning for data integrity and history tracking.
Community and Ecosystem: GeoServer boasts a vibrant user community offering support, docs, and plugins for extended functionality
Scalability: GeoServer is versatile, suiting single servers to distributed setups, effectively managing high data volumes and requests.
Interoperability: GeoServer is compatible with GIS software and can be combined with tools like QGIS, OpenLayers, and Leaflet.
Extensibility: Extensible via plugins and custom code for added functionality and data format support.
GeoServer is a powerful tool for organizations and developers looking to share and publish geospatial data on the web and build web mapping applications.
0 notes
Text
Na jó, lecserélem az egész renderelést OpenLayers-re, FF alatt továbbra is oké, de Chrome alatt most még lassabb :D Kivéve, ha elfordítod a kijelzőt 90 fokkal landscape módba, mert akkor meg Chrome alatt baszott gyors, cserébe FF alat laggol.
Eszem faszom megáll, na ezért nem vagyok frontend dev.
Emlékeztek még a nagy magyar tumbli crush térképre? Én már nem! Úgyhogy itt az ideje megnézni mi változott, és mi a helyzet 2023-ban!
Gyors definíciók amiket úgyse olvastok el, hogy aztán reblogoljátok az egészet, hogy "fogalmam sincs ez mit jelent, hát miért nem magyaráztad el te seggfej":
Ha reblogolsz valakitől valamit ÉS szöveges kommentet is írsz a reblogba, akkor kapsz az illetőtől egy pontot
Akivel szemben aa legtöbb pontod van, az a crush-od!
Ha két ember egymás legnagyobb crush-jai, akkor ők egy szerelmi háremköztársaságot alkotnak.
Mindenki más aki ezek után az illetők után vágyik (vagy olyan után, aki ezek után az illetők után vágyik, stb.) az ezen köztársaság lakója!
A 2021-es adatok alapján a legnagyobb országok az alábbiak voltak:
pajjorimre-valogataskazi alá tartozott a blogok 32.71%-a
tallianmiklos-szopiszuri a blogok 8.1%-ával második
sztupy-dukeofedinburgh 6.37%-al harmadik
vampirpillango-algebraicvarietyshow 4.49%-al negyedik
mspepperpotts-e52711 pedig 2.4%-al az ötödik lett
(a többieket itt meg lehet nézni)
Vajon @pajjorimre továbbra is vezető helyen van? Történtek nagy szakítások az elmúlt két évben? A hajtás után minden kiderül!
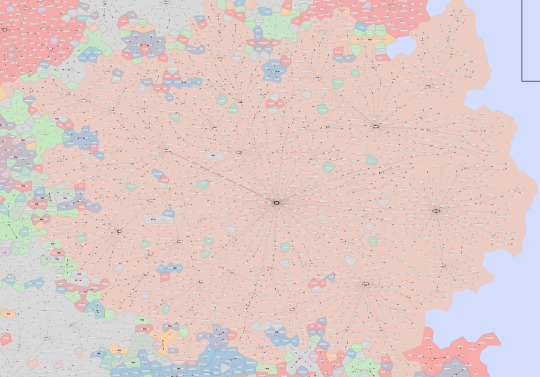
A legnagyobb változás, hogy a TINITUMBLI szekció füddetlenedett a pajjor-kazi párosról és külön országot alkottak. Nem is kicsit, övék a blogok 18.35%-a, fuckin-feelings vezetésével!
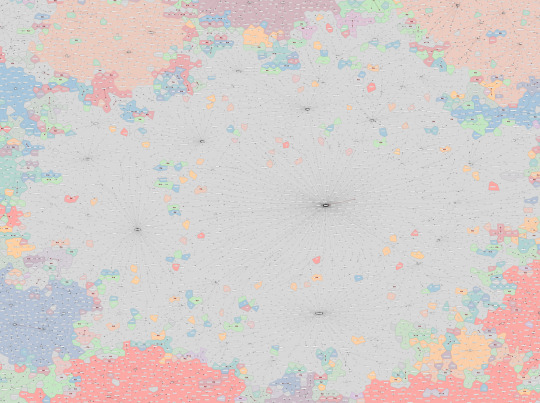
A tinitumbli ország elég nagy lett, több nagyobb központot is tudhat magáénak, a főváros mindenképp fuckin-feelings:
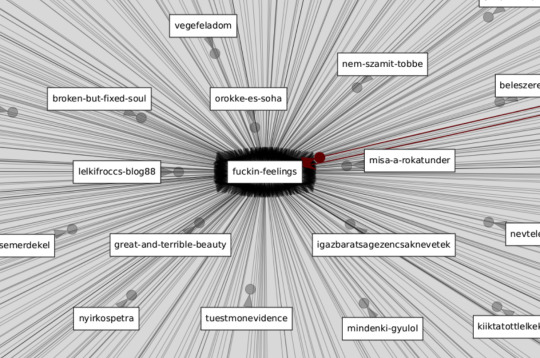
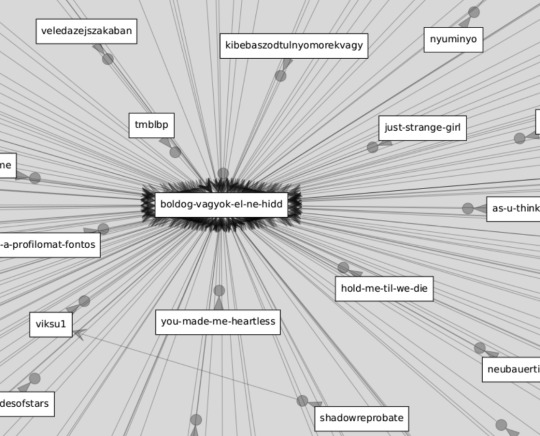
A déli határt őrzi boldog-vagyok-el-ne-hidd
Nyugati irányba nem-fogadott-hivas-on keresztül vezet az út
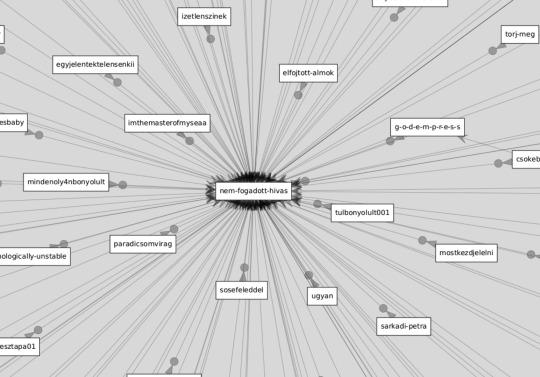
Az északi határvidéket pedig ker-a-lany őriz
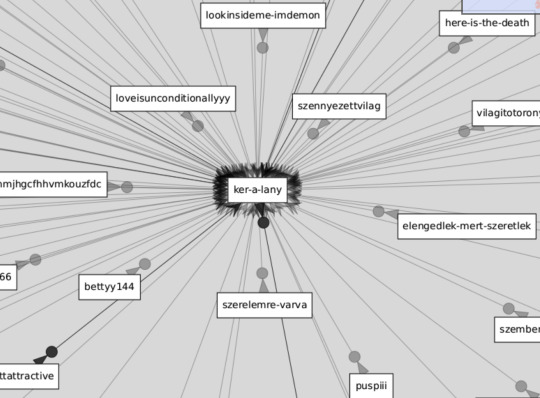
(keleten nincs semmi nagyobb település, gondolom ilyen sorsod borsod zombitanya az egész vagy hasonló)
A pajjor-kazi páros a második, a blogok 11.71%-át továbbra is maguk mögött tudják azért:
Harmadik helyen történt egy kis dráma! Óriási szakítás, tallianmiklos legnagyobb szerelme már nem szopiszuri, hanem ko1azer0! Kettejüké a blogok 4.24%-a
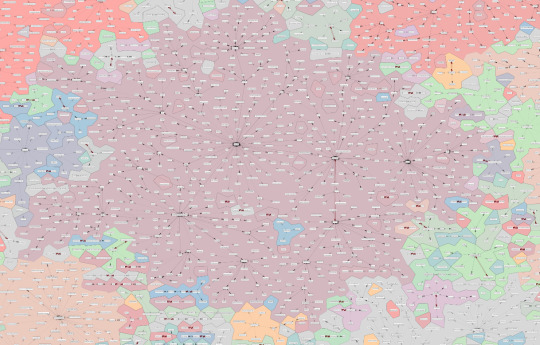
Negyedik helyre csúszott a skót kirendeltségű sztupy-dukeofedinburgh páros 3.38%-al:
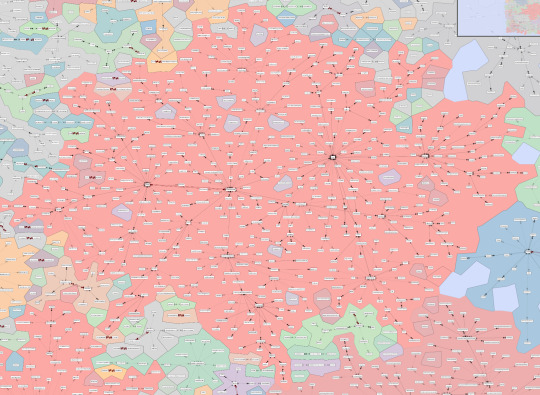
Ötödik helyen pedig algebraicvarietyshow-vampirpillango 3.25%-al

Hatodik helyen még említésre méltó, hogy akurvaanyadatbutters is rájött, hogy pajjorimre egy plátói szerelem, és lecserélte otthonzulles-re! Így kettejük szintén új országot alapítottak, egyből a blogok 2.79%-ával!
A további versenyzők:
almodozoangyal818-vercseppekazesoben 1.98%
kozimacanto-tryagain 1.97%
ahmedvanessa-weneedtotalkrightnow 1.84%
e52711-mspepperpotts 1.59%
rpszt & b-eton-loofie 1.56%
megyematricashazmester-xerxesz 1.39%
kosullo2-martonbede 1.37%
magnusheron-redblek 1.23%
Ha kíváncsi vagy melyik országba tartozol katt a fenti térképre, aztán keresd meg magad, és kövesd a nyilakat addig amíg el nem jutsz valakihez, akik piros nyíllal vannak jelölve, ők az uralkodóid! Van kereső is, hogy ez könnyebb legyen neked, de kicsit eldugtam.
161 notes
·
View notes
Link
I’m leaving soon for an island vacation, to Grand Cayman after researching for tropical places to visit and browsing around. I won’t be back until Feb 24th.In the meantime, I want to know what killer apps people have in mind for OpenLayers. What should someone build with it? Why? How would it help OpenLayers, and how would it help the world at large?See ya’ll on the flip side.
0 notes
Text
Seri Bluff: Menguasai ArcGIS Desktop 10.8.2.
Dapatkan harga Video Tutorial "Seri Bluff: Menguasai ArcGIS Desktop 10.8.2" hanya Rp. 99.000,- ( Harga asli Rp. 279.000). Hanya berlaku 5 hari sampai 21/02/2025.
#attribute query#select by attribute#feature info#opensource#gis operator#geodatabase#spatial query#select by location#location allocation#location intelligence#location based services#gis#geoserver#arcgis#esri#openlayers#wms#wfs#web mapping#leaflet#shapefile#qgis#geonode#freelancer#gis analyst#gis jobs#webgis#development#gis professional#project management
0 notes
Text
Field survey data can be managed well using ArcGIS PRO 3. Field survey tabular data equipped with coordinate points can be plotted onto the ArcGIS PRO 3 application where the distribution of this data will appear and facilitate spatial analysis, spatial modeling and decision making. Get the video tutorial here:
#attribute query#select by attribute#feature info#opensource#gis operator#geodatabase#spatial query#select by location#location allocation#location intelligence#location based services#gis#geoserver#arcgis#esri#openlayers#wms#wfs#web mapping#leaflet#shapefile#qgis#geonode#freelancer#gis analyst#gis jobs#webgis#development#gis professional#project management
0 notes
Video
youtube
OpenLayers - save your custom drawings in the .GeoJSON format
0 notes
Text
OpenLayers

Library name OpenLayers Difficulty Low to medium Returned value Graphic object Description A high-performance, feature-packed library for creating interactive maps on the web. Link https://openlayers.org Documentation https://openlayers.org/en/latest/doc/quickstart.html License BSD-2-Clause Library implementation Go to 'Tools' menu, select 'Add library' (read more how to add library here) Give a name to the library (OpenLayers), add required file/s: Url 1: https://cdn.rawgit.com/openlayers/openlayers.github.io/master/en/v5.3.0/build/ol.js CSS: https://cdn.rawgit.com/openlayers/openlayers.github.io/master/en/v5.3.0/css/ol.css Add description (optional). Click 'OK'. Custom functions To add a simple map in a spreadsheet create one simple function (read more how to add a custom function here): OPENLAYERS This function is only our proposal to deal with the library, but user can define their own function(s). Function name OPENLAYERS Arguments - longitude - latitude - zoom Syntax =OPENLAYERS(longitude, latitude, zoom) Description Calls the library function and returns the result as a map object. Function body Example =OPENLAYERS(C5,E5,G5) Example spreadsheet is shown below: Get a copy of this spreadsheet Read the full article
0 notes