#Order Datetime
Explore tagged Tumblr posts
Visit Tumblr Blog
Explore Tumblr blogs with no restrictions, modern design and the best experience.
Last Seen Tumblr Blogs


Fun Fact
Kazakhstan’s Minister of Communications and Informatics has blocked the Tumblr site because it contained 60 sites of terrorism, extremism, and pornography in 2015.
Text
HOT TAKE TOURNAMENT
TOURNAMENT OVERTIME #153
Submission 477
the ONLY good date format is YYYY-MM-DD and MM-DD-YYYY is actively the fucking worst
[JUSTIFICATION UNDER THE CUT]
Propaganda is encouraged!
Also, remember to reblog your favourite polls for exposure!
i sure fucking can. LISTEN. picture a world. a world where YYYY-MM-DD is in use everywhere. no more writing out the full name of the month to be unambiguous. no more wondering if 08/05 is august 5th or may 8th. if you start with the year you KNOW the month comes next. no culture fucking uses YYYY-DD-MM. (and if you do i guess it's just to explicitly cause chaos and suffering so i can respect that a little.) personally i hate MM-DD-YYYY the most because it's not monotone increasing or decreasing. like you knew you'd have to specify the month and day and then you sloppily tacked on the year???? what????
like at least DD-MM-YYYY makes sense. it's like saying [street address], [city], [province], [country]. you tack on the bigger containers as they become necessary.
however. i will die on the hill that even DD-MM-YYYY is not as good as YYYY-MM-DD. and this is because of how numbers and alphabetizing works.
you see i had to analyze some data once for an internship. the spreadsheets were named with the date. and SOME of them used MM-DD-YYYY while others used YYYY-MM-DD. and you know what? the MM-DD-YYYY formatting was such a bitch to work with that I made a small simple program JUST for the purpose of renaming every single one into YYYY-MM-DD format.
because you know what happens when your sort anything but YYYY-MM-DD in alphabetical order????? you get all the fucking December dates lumped together across your entire year range. or all the first days of the month. it fucking sucks. relatedly i fucking hate 12-hour time with the AM PM stuff.
in conclusion YYYY-MM-DD with 24 hour time is a mercy to anyone that uses the date in their files. and literally anything else is data scientist cruelty. thanks and have a nice day /gen. hope you consider switching to the best datetime format today.
#hot take tournament#tournament poll#tumblr poll#tumblr tournament#tumblr bracket#hot take#unpopular opinion#hot take overtime
172 notes
·
View notes
Text
some of the tables I deal with have a bunch of columns named "user_defined_field_1" or named with weird abbreviations, and our sql table index does not elaborate upon the purposes of most columns. so I have to filter mystery columns by their values and hope my pattern recognition is good enough to figure out what the hell something means.
I've gotten pretty good at this. the most fucked thing I ever figured out was in this table that logged histories for serials. it has a "source" column where "R" labels receipts, "O" labels order-related records and then there's a third letter "I" which signifies "anything else that could possibly happen".
by linking various values to other tables, source "I" lines can be better identified, but once when I was doing this I tried to cast a bunch of bullshit int dates/times to datetime format and my query errored. it turned out a small number of times were not valid time values. which made no sense because that column was explicitly labeled as the creation time. I tried a couple of weird time format converters hoping to turn those values into ordinary times but nothing generated a result that made sense.
anyway literally next day I was working on something totally unrelated and noticed that the ID numbers in one table were the same length as INT dates. the I was like, how fucked would it be if those bad time values were not times at all, but actually ID numbers that joined to another table. maybe they could even join to the table I was looking at right then!
well guess what.
49 notes
·
View notes
Text
Database Design Best Practices for Full Stack Developers
Database Design Best Practices for Full Stack Developers Database design is a crucial aspect of building scalable, efficient, and maintainable web applications.
Whether you’re working with a relational database like MySQL or PostgreSQL, or a NoSQL database like MongoDB, the way you design your database can greatly impact the performance and functionality of your application.
In this blog, we’ll explore key database design best practices that full-stack developers should consider to create robust and optimized data models.
Understand Your Application’s Requirements Before diving into database design, it’s essential to understand the specific needs of your application.
Ask yourself:
What type of data will your application handle? How will users interact with your data? Will your app scale, and what level of performance is required? These questions help determine whether you should use a relational or NoSQL database and guide decisions on how data should be structured and optimized.
Key Considerations:
Transaction management: If you need ACID compliance (Atomicity, Consistency, Isolation, Durability), a relational database might be the better choice. Scalability: If your application is expected to grow rapidly, a NoSQL database like MongoDB might provide more flexibility and scalability.
Complex queries: For applications that require complex querying, relationships, and joins, relational databases excel.
2. Normalize Your Data (for Relational Databases) Normalization is the process of organizing data in such a way that redundancies are minimized and relationships between data elements are clearly defined. This helps reduce data anomalies and improves consistency.
Normal Forms:
1NF (First Normal Form): Ensures that the database tables have unique rows and that columns contain atomic values (no multiple values in a single field).
2NF (Second Normal Form):
Builds on 1NF by eliminating partial dependencies. Every non-key attribute must depend on the entire primary key.
3NF (Third Normal Form):
Ensures that there are no transitive dependencies between non-key attributes.
Example: In a product order system, instead of storing customer information in every order record, you can create separate tables for Customers, Orders, and Products to avoid duplication and ensure consistency.
3. Use Appropriate Data Types Choosing the correct data type for each field is crucial for both performance and storage optimization.
Best Practices: Use the smallest data type possible to store your data (e.g., use INT instead of BIGINT if the range of numbers doesn’t require it). Choose the right string data types (e.g., VARCHAR instead of TEXT if the string length is predictable).
Use DATE or DATETIME for storing time-based data, rather than storing time as a string. By being mindful of data types, you can reduce storage usage and optimize query performance.
4. Use Indexing Effectively Indexes are crucial for speeding up read operations, especially when dealing with large datasets.
However, while indexes improve query performance, they can slow down write operations (insert, update, delete), so they must be used carefully. Best Practices: Index fields that are frequently used in WHERE, JOIN, ORDER BY, or GROUP BY clauses.
Avoid over-indexing — too many indexes can degrade write performance. Consider composite indexes (indexes on multiple columns) when queries frequently involve more than one column.
For NoSQL databases, indexing can vary. In MongoDB, for example, create indexes based on query patterns.
Example: In an e-commerce application, indexing the product_id and category_id fields can greatly speed up product searches.
5. Design for Scalability and Performance As your application grows, the ability to scale the database efficiently becomes critical. Designing your database with scalability in mind helps ensure that it can handle large volumes of data and high numbers of concurrent users.
Best Practices:
Sharding:
For NoSQL databases like MongoDB, consider sharding, which involves distributing data across multiple servers based on a key.
Denormalization: While normalization reduces redundancy, denormalization (storing redundant data) may be necessary in some cases to improve query performance by reducing the need for joins. This is common in NoSQL databases.
Caching: Use caching strategies (e.g., Redis, Memcached) to store frequently accessed data in memory, reducing the load on the database.
6. Plan for Data Integrity Data integrity ensures that the data stored in the database is accurate and consistent. For relational databases, enforcing integrity through constraints like primary keys, foreign keys, and unique constraints is vital.
Best Practices: Use primary keys to uniquely identify records in a table. Use foreign keys to maintain referential integrity between related tables. Use unique constraints to enforce uniqueness (e.g., for email addresses or usernames). Validate data at both the application and database level to prevent invalid or corrupted data from entering the system.
7. Avoid Storing Sensitive Data Without Encryption For full-stack developers, it’s critical to follow security best practices when designing a database.
Sensitive data (e.g., passwords, credit card numbers, personal information) should always be encrypted both at rest and in transit.
Best Practices:
Hash passwords using a strong hashing algorithm like bcrypt or Argon2. Encrypt sensitive data using modern encryption algorithms. Use SSL/TLS for encrypted communication between the client and the server.
8. Plan for Data Backup and Recovery Data loss can have a devastating effect on your application, so it’s essential to plan for regular backups and disaster recovery.
Best Practices:
Implement automated backups for the database on a daily, weekly, or monthly basis, depending on the application. Test restore procedures regularly to ensure you can quickly recover from data loss. Store backups in secure, geographically distributed locations to protect against physical disasters.
9. Optimize for Queries and Reporting As your application evolves, it’s likely that reporting and querying become critical aspects of your database usage. Ensure your schema and database structure are optimized for common queries and reporting needs.
Conclusion
Good database design is essential for building fast, scalable, and reliable web applications.
By following these database design best practices, full-stack developers can ensure that their applications perform well under heavy loads, remain easy to maintain, and support future growth.
Whether you’re working with relational databases or NoSQL solutions, understanding the core principles of data modeling, performance optimization, and security will help you build solid foundations for your full-stack applications.

0 notes
Text
#aFactADay2024 #1461: the FINALE part 3! see the master post or the Neocities landing page. the following post is best read on the Neocities website.
Stop the Bus, I Need a Wee-Wee!
Apparently that song has other verses??
Abstract
During 2024, a list of visits to the bathroom was logged with data on datetime and burstingness. Various analyses were produced to present various aspects of the data, primarily for the purpose of being silly. 947 "number ones" and 223 "number twos" were had over a 365-day period, the largest proportion of which were at home and between 6-7am. Finally, we also present a "Number, Clump, Spread Analysis" on the timestamps collected.
Introduction and Collection Methods
There's really not much to be said here. I genuinely have no idea why I started recording all this data in specific! The log dates back to late December 2023, which is quite a nice timeframe as it gives me a clean year. This entire document is completely non-serious, and really just an excuse to squeeze as many euphemisms in as possible.
All data in this article are cut off at the 30th of Dec (I'm currently writing this at 2am on New Year's Eve) but because this year was a leap year it still works out to be 365 days. Each datum in the datalog consists of a datetime, type, location and burstingness. Type is whether it's a "number one" or a "number two". Location refers not to a specific toilet but a slightly more generic place - like "home" or "the English corridor". Burstingness is rated out of 5, where
1 = I didn't know I needed it
2 = a slight nagging
3 = I needed that
4 = stop the bus I need a wee-wee
5 = gotta riverdance to stay sane
I did log timezones (i.e. when I went abroad, I logged the update to relative time but wrote data in local time) but these have all been ignored, so there are going to be some very minor and very occasional offsets. You'll barely notice them.
Summary and Highlights
I went to the loo* 1170 times this year
947 of which were number ones (2.6 times a day)
223 of which were number twos (4.3 times a week)
*I actually only went to the loo 1010 times this year: 160 visits involved both a number one and a number two
The vast majority of these visits happened at home while roughly a sixth happened between 6-7am
Most number ones were ranked 3 burstingness, whereas most number twos were ranked 4
A period of intense loo-age was evident in June
The Age-Old Wisdom
As a knowledgable sage once told me, "Poopoo Time is Peepee Time but Peepee Time is not [Always] Poopoo Time" This obviously seemed correct at the time but now we can prove it! As was mentioned in the highlights, 160 of my loo visits incorporated both a number one and a number two (in any order, within ten minutes of one another, although only 7 of these happened 2-10 minutes apart - most were just a minute apart). This means that 72% of "Poopoo Times" were "Peepee Times". Obviously when this wizard said this, the implication was that it wasn't every single one (that would be easy to disprove as it only takes one), but the vast majority is pretty good evidence. The other half of the statement is easy to prove: for every number two, there were at least four number ones (4.24 to be precise) and thus by the Dirichlet Principle (which has a much fancier name than it deserves - don't Google it because you'll be underwhelmed) there will always be a "Peepee Time" that cannot be a "Poopoo Time". Specifically, 83% of them were. But, that half of the adage is still 100% true. Therefore, the legendry is roughly 86% true. Good enough for me.
How badly?
Each toilet visit is qualified with a "burstingness" score between 1 and 5 (scroll up to see the benchmarks - I can't be bothered to repeat them). Most were 3s and 4s, which makes sense because why empty the tank if it's not full? Similarly, why wait until it's so uncomfortable that you have to riverdance? Apparently I was much more willing to do so with number twos than ones:

The reason I put this section here (rather than somewhere below in the less important stuff... as if any of this is important) was because there are some interesting relations between the "burstingness" score and the crossovers of number ones and twos discussed in the first section:
There were 53 number ones with a burstingness of 1 (ie "I didn't think I needed to go"), but 52 of these happened within ten minutes after a number two, thus backing up the claims discussed in the previous section even further. Similarly, there were 153 number ones with a burstingness of 2 (ie just-perceptible), but most of these happened within ten minutes of a number two. In fact, of most visits involving both water and fertiliser, I much more needed to do the latter than the former, and the vast majority of number ones involved in a situation like this were not very bursting. This adds further evidence to the claims discussed in the previous section and passed down through the generations.
How Often?
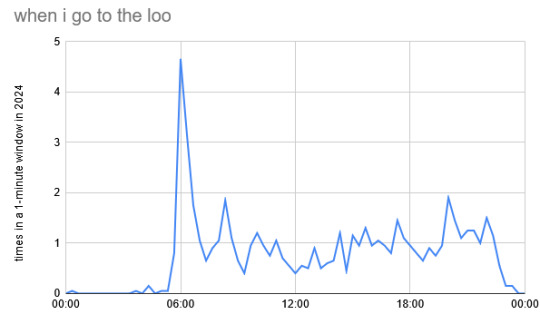
This is the important question, really. I have a friend who drains the radiator more times in a day than I have fingers to count on - when they get through our triple lesson (which features majorly in my article on "Number, Clump, Spread" - go read that! Shameless self-insert!) without going to the loo, this is something to write home about. I, on the other hand, am notorious for rarely going to the loo. The longest I believe I went this year was 29 hours and 41 minutes, although that's harder to verify than I can be bothered. For the record, I had seven number ones in a day on multiple occasions! (It was terrible!) But to give a more specific answer, I will answer through the powerful medium of a Google Sheets graph that I whipped up in the dead of night!

Looking more closely, there are some interesting things to be revealed. My bowel patterns were much more stable, although they did roughly mirror some of the more drastic changes in urinary movements in places. To address the elephant in the room, there was a massive spike during June where I almost doubled my number ones at a point. Both 7-number-1s (and both 6-number-1s) occurred during June. This is simply because June is hayfever season, so I drink loads of water to keep my mucus nice and runny so that I can breathe more easily, but it does go through me quite quickly....
The other interesting pattern that took me by such a large surprise was the oscillations that seem to occur. They're visible throughout at regular and almost predictable intervals, but particularly around August/September sorta time. This reminded me strikingly of this pattern that occurred during study leave one year:

To give a little context, this was part of a larger challenge I held with a friend to see who could be most productive during study leave (mostly with respect to studying but also other things like self-care and hobbies). For the record, I won this year (reclaiming my loss from the previous year's study leave). But probably only because of the extremely long plateau of productivity around mid-late May where two oscillations fused together.
But oddly, the oscillations in this productivity graph match the oscillations in the number of pennies I spend (once you account for things like different moving average periods, phase offset, etc). I wonder if there's something really afoot here - probably just statistical bias (if I'm more productive I work harder so drink more water....??) but any correlation would be interesting. In the same way that I analysed similar (but different) data in my "Number, Clump, Spread" article to help plan my time in the long-term, I wonder if there's any merit in analysing when powder my nose to help me plan my time... Probably clutching at straws here. I have much better data for September-December (where the oscillations are clearest in both moving averages) in terms of productivity (as part of the same dataset as the "focability" data used in my "Number, Clump, Spread" article - go read it!! Shameless self-insert!) but I can't entirely be bothered to analyse it this instant.
When and Where?
At what time of day did I wring out the ol' kidneys most? 06:06am. 12 wazzes occurred at 6 past 6 in the morning in 2024. 8.2% of all my visits took place between 06:00 and 06:20am, while 16.9% took place between 6 and 7 o'clock. This is hardly surprising as I got in a good habit this year of getting up at 6 on the dot (although I slipped quite a bit in the latter part of the year).
Most of the other larger spikes on this graph are labellable. the second one is 08:20-08:40, roughly when I have my breakfast on the weekend. There are peaks at 13:00-13:20 (the beginning of lunch at school) and 14:20-14:40 (roughly when I leave school on a lot of days, but also roughly 8 hours after my first number one of the day if I'm at home). There's an extended portion of the day where I have a lot more (variously between 3pm and 9pm) because that's usually when I get home. The peak at 8pm is inexplicably high. Aside from that, it all seems that my body runs on surprisingly regular clockwork.
But where do I test the plumbing most? As just mentioned, when I wake up and when I get home are two of my favourite times to pay a visit to the ol' porcelain, so it's unsurprising that 4 in 5 of nature's calls occur at home. (Wow, sounds like a firefighters' campaign.)

Aside from the massive proportion that happen at home (it could happen to you too!), the biggest proportion is just wherever I'm staying at the time (defined as somewhere I overnighted) which makes sense because it's just a stand-in for home. The biggest sub-category hereof was my exchange partner's house, where I stayed for two weeks, but my aunt also featured quite highly.
Of the thirteenth that happen at school, my favourite haunt is the loos in the English corridor, which warranted 47 visits this year. Probably just because it's nearest to the DT department.
The tiny 1.7% miscellaneous slice is where it gets interesting: most are at friends' houses or non-school institutions where I was visiting. The equally poignant component is the green slice, which for some reason Google refuses to label. These are public loos! I used 18 different public bogs 19 times (only four on trains or in stations, surprisingly) - the only one I could stomach going back to was on Bournemouth beach. I think there's an ode to be given to public loos from the fact that I used them more than my friends', but I'll leave my less fortunately bladdered friend to write such an ode.
NSC
For the umpteenth time in this article, I'm going to reference my other article on "Number, Clump and Spread", which was also written as part of the Fact of the Day Finale series. I implore you to read at least part of it before fully understanding this bit, although I'll attempt to give a layperson's interpretation too. (The values account for number ones only and are given in HH:MM:SS format for your convenience. I'll take applause at the end.)

The value of mu (the mean) is very simply the mean interval between two rainstorms on the bowl - you may recognise that value as the reciprocal of the number i mentioned earlier, 2.6 per day.
The value of mu_c (the "clump-weighted mean") represents the mean time passages between water passages, but weighted in favour of close-together instances. It's a measure of how much a role closely-packed events form in your data, and of short-term distribution: here, it's quite a lot but still quite a few hours so nothing to write home about.
The value of mu_s (the "spread-weighted mean") represents the mean duration between urination station visitations, but this time weighted in favour of "poorly-spread" instances. It's a measure of poorly-distributed events in your data in the long term: here it's very close to the standard mean, albeit a little bit above, implying that there are certainly some drier stints than others but on the whole it's very well-spread. Which makes sense.
The same analysis couldn't be conducted for slices of caterpillar cake as easily on the entire dataset due to its poor formatting and my laziness at this dark hour of night. However, small-scale testing yields two results:
It was better spread and even better clumped compared to the tinkle.
A surprising number of them occurred at similar times but one or two days apart!
I'm afraid I don't really have anything more to say in this article. It's all a bit silly. As ever, if you have any ideas what to do with all this data (any analyses you think might be interesting?) or any ideas for future data-collection, please let me know ASAP!! I love spreadsheets.....
Oh and go and read the other three articles. They're much more purposeful. Ok maybe not purposeful....
0 notes
Text
An Introduction Of Pipe Syntax In BigQuery And Cloud Logging

Organizations looking to improve user experiences, boost security, optimize performance, and comprehend application behavior now find that log data is a priceless resource. However, the sheer amount and intricacy of logs produced by contemporary applications can be debilitating.
Google Cloud is to give you the most effective and user-friendly solutions possible so you can fully utilize your log data. Google Cloud is excited to share with us a number of BigQuery and Cloud Logging advancements that will completely transform how you handle, examine, and use your log data.
Pipe syntax
An improvement to GoogleSQL called pipe syntax allows for a linear query structure that makes writing, reading, and maintaining your queries simpler.
Pipe syntax is supported everywhere in GoogleSQL writing. The operations supported by pipe syntax are the same as those supported by conventional GoogleSQL syntax, or standard syntax, such as joining, filtering, aggregating and grouping, and selection. However, the operations can be applied in any sequence and many times. Because of the linear form of pipe syntax, you may write queries so that the logical steps taken to construct the result table are reflected in the order in which the query syntax is written.
Pipe syntax queries are priced, run, and optimized in the same manner as their standard syntax equivalents. To minimize expenses and maximize query computation, adhere to the recommendations when composing queries using pipe syntax.
There are problems with standard syntax that can make it challenging to comprehend, write, and maintain. The way pipe syntax resolves these problems is illustrated in the following table:
SQL for log data reimagined with BigQuery pipe syntax
The days of understanding intricate, layered SQL queries are over. A new era of SQL is introduced by BigQuery pipe syntax, which was created with the semi-structured nature of log data in mind. The top-down, intuitive syntax of BigQuery’s pipe syntax is modeled around the way you typically handle data manipulations. According to Google’s latest research, this method significantly improves the readability and writability of queries. The pipe sign (|>) makes it very simple to visually distinguish between distinct phases of a query, which makes understanding the logical flow of data transformation much easier. Because each phase is distinct, self-contained, and unambiguous, your questions become easier to understand for both you and your team.
The pipe syntax in BigQuery allows you to work with your data in a more efficient and natural way, rather than merely writing cleaner SQL. Experience quicker insights, better teamwork, and more time spent extracting value rather than wrangling with code.
This simplified method is very effective in the field of log analysis.
The key to log analysis is investigation. Rarely is log analysis a simple question-answer process. Finding certain events or patterns in mountains of data is a common task when analyzing logs. Along the way, you delve deeper, learn new things, and hone your strategy. This iterative process is embraced by pipe syntax. To extract those golden insights, you can easily chain together filters (WHERE), aggregations (COUNT), and sorting (ORDER BY). Additionally, you can simply modify your analysis on the fly by adding or removing phases as you gain new insights from your data processing.
Let’s say you wish to determine how many users in January were impacted by the same faults more than 100 times in total. The data flows through each transformation as demonstrated by the pipe syntax’s linear structure, which starts with the table, filters by dates, counts by user ID and error type, filters for errors more than 100, and then counts the number of users impacted by the same faults.
— Pipe Syntax FROM log_table |> WHERE datetime BETWEEN DATETIME ‘2024-01-01’ AND ‘2024-01-31’ |> AGGREGATE COUNT(log_id) AS error_count GROUP BY user_id, error_type |> WHERE error_count>100 |> AGGREGATE COUNT(user_id) AS user_count GROUP BY
A subquery and non-linear structure are usually needed for the same example in standard syntax.
Currently, BigQuery pipe syntax is accessible in private preview. Please use this form to sign up for a private preview and watch this introductory video.
Beyond syntax: adaptability and performance
BigQuery can now handle JSON with more power and better performance, which will speed up your log analytics operations even more. Since most logs contain json data, it anticipate that most customers will find log analytics easier to understand as a result of these modifications.
Enhanced Point Lookups: Significantly speed up queries that filter on timestamps and unique IDs by use BigQuery’s numeric search indexes to swiftly identify important events in large datasets.
Robust JSON Analysis: With BigQuery’s JSON_KEYS function and JSONPath traversal capability, you can easily parse and analyze your JSON-formatted log data. Without breaking a sweat, extract particular fields, filter on nested data, and navigate intricate JSON structures.
JSON_KEYS facilitates schema exploration and discoverability by removing distinct JSON keys from JSON data.Query Results JSON_KEYS(JSON '{"a":{"b":1}}')["a", "a.b"]JSON_KEYS(JSON '{"a":[{"b":1}, {"c":2}]}', mode => "lax")["a", "a.b", "a.c"]JSON_KEYS(JSON '[[{"a":1},{"b":2}]]', mode => "lax recursive")["a", "b"]
You don’t need to use verbose UNNEST to download JSON arrays when using JSONPath with LAX modes. How to retrieve every phone number from the person field, both before and after, is demonstrated in the example below:
Log Analytics for Cloud Logging: Completing the Picture
Built on top of BigQuery, Log Analytics in Cloud Logging offers a user interface specifically designed for log analysis. By utilizing the JSON capabilities for charting, dashboarding, and an integrated date/time picker, Log Analytics is able to enable complex queries and expedite log analysis. It is also adding pipe syntax to Log Analytics (in Cloud Logging) to make it easier to include these potent features into your log management process. With the full potential of BigQuery pipe syntax, improved lookups, and JSON handling, you can now analyze your logs in Log Analytics on a single, unified platform.
The preview version of Log Analytics (Cloud Logging) now allows the use of pipe syntax.
Unlock log analytics’ future now
The combination of BigQuery and Cloud Logging offers an unparalleled method for organizing, examining, and deriving useful conclusions from your log data. Discover the power of these new skills by exploring them now.
Using pipe syntax for intuitive querying: an introductory video and documentation
Cloud logging’s Log Analytics provides unified log management and analysis.
Lightning-quick lookups using numeric search indexes – Support
JSON_KEYS and JSON_PATH allow for seamless JSON analysis
Read more on Govindhtech.com
#pipesyntax#BigQuery @GoogleSQL#BigQuery#BigQuerypipesyntax#news#technews#technology#technologynews#technologytrends#govindhtech
0 notes
Text
What is SQL and Data Types ?
SQL (Structured Query Language) uses various data types to define the kind of data that can be stored in a database. Each SQL database management system (DBMS) may have its own variations, but here are the most common SQL data types categorized broadly:

Numeric Data Types INT (or INTEGER) Description: Used to store whole numbers. The typical range is -2,147,483,648 to 2,147,483,647. Example: sql CREATE TABLE Employees ( EmployeeID INT PRIMARY KEY, Age INT );
INSERT INTO Employees (EmployeeID, Age) VALUES (1, 30), (2, 25);
SELECT * FROM Employees WHERE Age > 28; DECIMAL (or NUMERIC) Description: Fixed-point numbers with a defined precision and scale (e.g., DECIMAL(10, 2) allows 10 digits total, with 2 after the decimal). Example: sql CREATE TABLE Products ( ProductID INT PRIMARY KEY, Price DECIMAL(10, 2) );
INSERT INTO Products (ProductID, Price) VALUES (1, 19.99), (2, 5.50);
SELECT * FROM Products WHERE Price < 10.00;
Character Data Types CHAR(n) Description: Fixed-length character string. If the input string is shorter than n, it will be padded with spaces. Example: sql CREATE TABLE Users ( UserID INT PRIMARY KEY, Username CHAR(10) );
INSERT INTO Users (UserID, Username) VALUES (1, 'Alice '), (2, 'Bob ');
SELECT * FROM Users; VARCHAR(n) Description: Variable-length character string that can store up to n characters. It does not pad with spaces. Example: sql CREATE TABLE Comments ( CommentID INT PRIMARY KEY, CommentText VARCHAR(255) );
INSERT INTO Comments (CommentID, CommentText) VALUES (1, 'Great product!'), (2, 'Not what I expected.');
SELECT * FROM Comments WHERE CommentText LIKE '%great%'; TEXT Description: Used for storing large amounts of text. The maximum length varies by DBMS. Example: sql CREATE TABLE Articles ( ArticleID INT PRIMARY KEY, Content TEXT );
INSERT INTO Articles (ArticleID, Content) VALUES (1, 'This is a long article content…');
SELECT * FROM Articles WHERE ArticleID = 1;
Date and Time Data Types DATE Description: Stores date values in the format YYYY-MM-DD. Example: sql CREATE TABLE Orders ( OrderID INT PRIMARY KEY, OrderDate DATE );
INSERT INTO Orders (OrderID, OrderDate) VALUES (1, '2024-01-15'), (2, '2024-02-10');
SELECT * FROM Orders WHERE OrderDate > '2024-01-01'; DATETIME Description: Combines date and time into one type, typically formatted as YYYY-MM-DD HH:MM:SS. Example: sql CREATE TABLE Appointments ( AppointmentID INT PRIMARY KEY, AppointmentTime DATETIME );
INSERT INTO Appointments (AppointmentID, AppointmentTime) VALUES (1, '2024-01-15 14:30:00');
SELECT * FROM Appointments WHERE AppointmentTime < NOW();
Binary Data Types BLOB (Binary Large Object) Description: Used to store large binary data, such as images or files. Example: sql Copy code CREATE TABLE Images ( ImageID INT PRIMARY KEY, ImageData BLOB );
-- Assume we have binary data for an image to insert -- INSERT INTO Images (ImageID, ImageData) VALUES (1, ?);
Boolean Data Type BOOLEAN Description: Stores TRUE or FALSE values. In some systems, this might be represented as TINYINT (0 for FALSE, 1 for TRUE). Example: sql CREATE TABLE Subscriptions ( SubscriptionID INT PRIMARY KEY, IsActive BOOLEAN );
INSERT INTO Subscriptions (SubscriptionID, IsActive) VALUES (1, TRUE), (2, FALSE);
SELECT * FROM Subscriptions WHERE IsActive = TRUE;
JSON and XML Data Types JSON Description: Stores JSON-formatted data, allowing for flexible data structures. Example: sql CREATE TABLE Users ( UserID INT PRIMARY KEY, UserInfo JSON );
INSERT INTO Users (UserID, UserInfo) VALUES (1, '{"name": "Alice", "age": 30}');
SELECT * FROM Users WHERE UserInfo->>'name' = 'Alice'; XML Description: Used for storing XML data, allowing for structured data storage. Example: sql CREATE TABLE Configurations ( ConfigID INT PRIMARY KEY, ConfigData XML );
INSERT INTO Configurations (ConfigID, ConfigData) VALUES (1, 'dark');
SELECT * FROM Configurations WHERE ConfigData.exist('/config/setting[@name="theme" and text()="dark"]') = 1;
Special Data Types ENUM Description: A string object with a value chosen from a list of permitted values. Example: sql CREATE TABLE Products ( ProductID INT PRIMARY KEY, Size ENUM('Small', 'Medium', 'Large') );
INSERT INTO Products (ProductID, Size) VALUES (1, 'Medium'), (2, 'Large');
SELECT * FROM Products WHERE Size = 'Medium'; SET Description: A string object that can have zero or more values, each of which must be chosen from a predefined list. Example: sql CREATE TABLE UserRoles ( UserID INT, Roles SET('Admin', 'Editor', 'Viewer') );
INSERT INTO UserRoles (UserID, Roles) VALUES (1, 'Admin,Editor'), (2, 'Viewer');
SELECT * FROM UserRoles WHERE FIND_IN_SET('Admin', Roles);
0 notes
Text
What are the benefits of python dataclasses
Introduction
If you just started or already coded using Python and like Object Oriented Programming but aren't familiar with the dataclasses module, you came to the right place! Data classes are used mainly to model data in Python. It decorates regular Python classes and has no restrictions, which means it can behave like a typical class. Special methods build-in implementation. In the world of Python programming, data manipulation and management play a crucial role in many applications. Whether you’re working with API responses, modeling entities, or simply organizing your data, having a clean and efficient way to handle data is essential. This is where Python data classes come into the picture
What Are Python Dataclasses?
Python dataclasses are classes from the standard library to be added to the code for specific functionality. These can be used for making changes to user-defined classes using the dataclass decorator. we don't have to implement special methods ourselves, which helps us avoid boilerplate code, like the init method (_init_ ), string representation method (_repr_ ), methods that are used for ordering objects (e.g. lt, le, gt, and ge), these compare the class as if it were a tuple of its fields, in order.The advantage of using Python dataclasses is that the special methods can be automatically added, leaving more time for focusing on the class functions instead of the class itself.Python, a data class is a class that is primarily used to store data, and it is designed to be simple and straightforward. Data classes are introduced in Python 3.7 and later versions through the data class decorator in the data classes module.The purpose of a Python data class is to reduce boilerplate code that is typically associated with defining classes whose main purpose is to store data attributes. With data classes, you can define the class and its attributes in a more concise and readable manner.
Python's datetime module provides classes for working with dates and times. The main classes include:
There Are Two Types
First Type
Date: Represents a date (year, month, day).
Time: Represents a time (hour, minute, second, microsecond).
Datetime: Represents both date and time.
Timedelta: Represents a duration, the difference between two dates or times.
Tzinfo: Base abstract class for time zone information objects.
Second Type
Datetime: Represents a specific point in time, including both date and time information.
Date: Represents a date (year, month, day) without time information.
Time: Represents a time (hour, minute, second, microsecond) without date information.
Timedelta: Represents the difference between two datetime objects or a duration of time.
How Are Python Dataclasses Effective?
Python dataclasses provide a convenient way to create classes that primarily store data. They are effective for several reasons:Now that you know the basic concept of Python dataclasses decorator, we’ll explore in more detail why you must consider using it for your code. First, using dataclasses will reduce the number of writing special methods. It will help save time and enhance your productivity.
Reduced Boilerplate Code
Easy Declaration
Immutable by Default
Integration with Typing
Customization
Interoperability
Use Less Code to Define Class
Easy Conversion to a Tuple
Eliminates the Need to Write Comparison Methods
Overall, Python dataclasses offer a convenient and effective way to define simple, data-centric classes with minimal effort, making them a valuable tool for many Python developers.
0 notes
Text
Data Wrangler el método de transformación python similar a PowerBi Query Editor
Hace tiempo que existe una extensión para limpieza de datos en el mercado que no para de llamar la atención. Normalmente me encontré con dos tipos de perfiles que limpian datos, los que aman código (usan python o R) y los que usan herramientas de Bi (power bi, tableau, etc). Creo que esta extensión busca integrar lo mejor de ambos mundos. Utilizar el poder de python con la comodidad visual de las herramientas tradicionales.
Este artículo nos cuenta sobre Data Wrangler. La extensión que permite hacer transformaciones de datos de un archivo de python o jupyter con clicks como si fuera una herramienta de BI.
Para comenzar, veamos la definición de Data Wrangler.
"Es una herramienta de limpieza de datos centrada en código integrada a visual studio code. Apunta a incrementar la productividad de expertos en datos haciendo limpieza al proveer una interfaz que automatiza funciones core de la librería Pandas y muestra útiles insights de las columnas."
Algo así, traducido, es la definición que le dan los creadores. Si bien, al momento de crear este post solo aceptaba Pandas, ya esta disponible el funcionamiento con PySpark Frames.
Para encontrar la herramienta basta con buscarla por VS Code o podes conocer más del proyecto Open Source en su repositorio github. En el mismo encontrarán también opciones de descarga.
Una vez instalado, abrirlo es tan simple como realizar un "head" para un Pandas DataFrame:
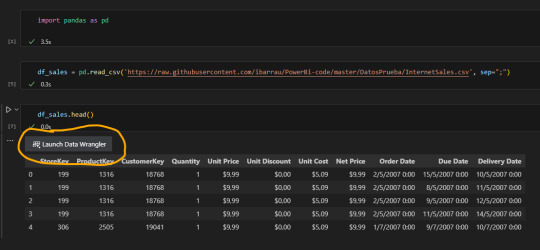
Nos sugiere un botón para iniciar la extensión.
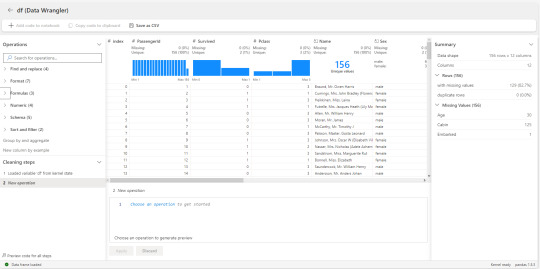
La interfaz nos muestra rapidamente información útil. La veamos por partes:
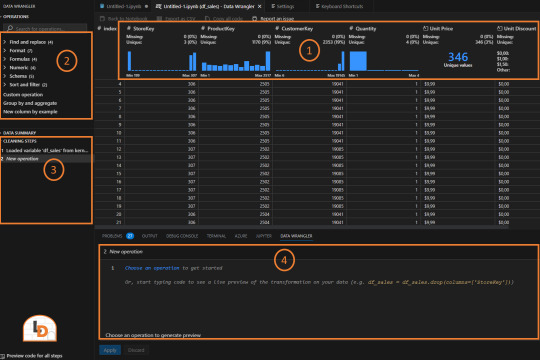
Columnas con distribución y estadísticas que nos permiten entenderlas más rapidamente.
Acciones de transformaciones disponibles para ejecutar separadas por categorías
Lista de pasos de transformaciones ejecutados para repasar la historia
Código generado. Esta sección es ideal para aprender más sobre el lenguaje puesto que nos mostrará como es la ejecución de una acción y también nos permitirá modificarla a gusto.
A mano izquierda vemos las transformaciones que podemos elegir seleccionando una columna previamente. Por ejemplo, cambiemos el formato de nuestra columna Order Date. Seleccionamos en las opciones de formato "DateTime formatting example" para mostrarle tal como queremos que sea el formato. Eso nos genera una nueva columna que definiendo el ejemplo se completará y creará luego de darle Apply:
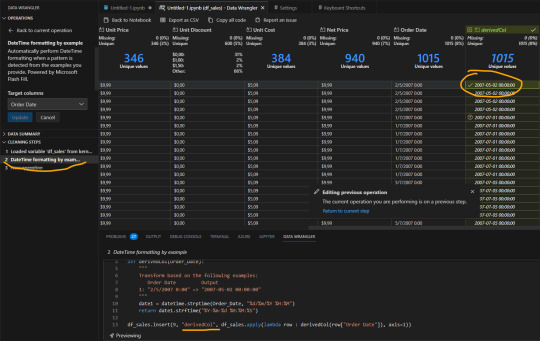
Si nos ubicamos en el paso anterior podremos ver el código ejecutado como así también modificarlo. Si quisieramos cambiar el nombre de la nueva columna derivedCol por "Fecha de Orden", bastaría con ir al código subrayado donde vemos el nombre y cambiarlo.
NOTA: solo podemos cambiar el código del paso anterior. Los pasos más viejos quedan en preview para evitar sobrecargar la memoria.
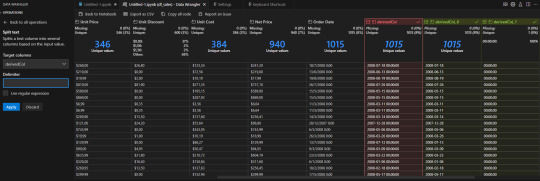
Hay operaciones tradicionales de texto como split que simplemente con el delimitador nos ajustaría las columnas
En caso que conozcamos más sobre el lenguaje también tenemos un espacio para escribir una fórmula de python para una columna nueva o actual. Por ejemplo una operación matemática sencilla:
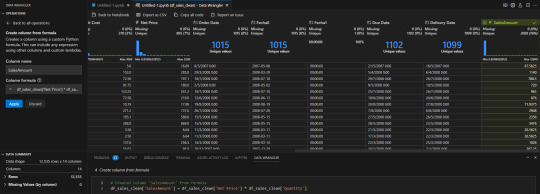
Algunos otros ejemplos que estuve probando son reemplazar cadenas de texto, eliminar columnas, agregar columnas por ejemplo y cambiar tipo.
Si en algún momento queremos regresar, tenemos un botón "Back to Notebook" que nos permitiría reordenar código y/o ajustar de manera manual a todo lo que se generó.
Consideremos que si volvemos al notebook, no podremos volver al wrangler tal cual estaba con sus pasos para ver y editar, sino que tendríamos que generar un "head()" nuevo del dataframe del paso de limpieza más reciente para volver a iniciarlo y ejecutar pasos faltantes.
Integración con Fabric
Además del uso local antes mencionado, la herramienta fue integrada con los lanzamientos de Microsoft Build 2023. Notebooks de Fabric no solo pueden ser abiertos en visual studio code para utilizarlo desde allí, sino que tienen una pestaña data que detecta pandas frames para abrir Data Wrangler.

Así abriremos algo muy similar a lo que vimos en visual studio code
Si bien se ve idéntica pero en versión clara, tiene algunas diferencias. La integración con Fabric no cuenta con todas las opciones locales como por ejemplo "Create column from formula". No tenemos la opción de escribir el código de una columna. El resto es bastante similar a lo que antes mencionamos.
Conclusión
Esta es una excelente herramienta que puede fortalecer nuestros inicios con Python para mejorar la experiencia de usuario y aprender sobre el código viendo lo que genera finalmente luego de aplicar las operaciones.
Si la comparamos con un editor de consultas de Power Bi se siente algo tosca. De todas formas tiene mucho potencial y oportunidad de crecimiento para ir mejorando.
Una excelente alternativa para quienes no terminan de amigarse con Python y necesitan ejecutar algunas transformaciones entre capas de Lake o ingesta de datos.
#data wrangler#python data wrangler#python#fabric#powerbi#power bi#power bi service#fabric notebooks#python notebooks#ladataweb#fabric argentina#fabric jujuy#fabric cordoba#synapse
0 notes
Text
[Snipped from the end of https://mentalisttraceur-software.tumblr.com/post/731369344962101248/alright-all-the-reasonably-reachable-fruit-of ]
Optimizing further?
Some of this would be trivial to do better outside of Emacs. Emacs' primitive for getting a directory's contents returns a singly-linked list (semantically at least - in principle the implementation could return some object which acts like a Lisp list and only decays into a real one if how it's used requires it). This means that Emacs just destroys your opportunity to do several things which might be more efficient - sort as you go, or sort in a structure more suited for sorting than a singly-linked list. You do get the option to have it lexically sort the list for you. It doesn't give you any way to customize the sort beyond that - lexically sorted or not at all. I currently do a reverse lexical sort, so that the most recent datetimes sort first, and in principle since the implementation has opportunity to do a more efficient sort before giving me the list at all, it could actually be more efficient to let it sort and then mutatingly reverse the list, and profiling this before I need to is irrelevant because that kind of implementation detail could change by when I do need it. In principle I could take the list unsorted (thus playing nice with another hypothetical implementation optimization where it could return a list-like object which is lazily loaded, or maybe asynchronously finishes the directory read in the background and degrades to lazily-loaded blocking only if you iterate through the list faster than that), and then do my own sort as I read the files - even if the implementation naively builds a linked list with a bunch of readdir calls or whatever before returning the whole thing, but could've first done a more efficient lexical sort than we can from Elisp after the fact, doing my own sort might be more efficient w.r.t. UX in the big picture, because we could start reading history entries unsorted and then incrementally sort them on insert into the in-memory history instead of having to do the whole sort before the UI can even get the first history entry to display. But anyway, that's the shape of optimizing the list-files-and-sort part, and it's notably more awkward to do in Emacs than it could be with more raw access to the underlying directory-listing APIs.
(Some of the work to do that might be amortized by the work needed to extend my in-Emacs histdir stuff to non-deduplicated history. I deduplicate my history, so while my histdir CLI handles either case, and in fact originally the histdir CLI MVP didn't bother with deduplication at all, my Emacs histdir integration MVP assumes deduplication. Naturally I wrote the logic with the non-deduplicated case in mind, so most of it will Just Work, but currently the only time call timestamps affect ordering is during that initial sorted read - not when inotify/whatever notices a new file appearing, newly appearing entries just get added to the front of the in-memory history. The easiest solution to that is an O(n) solution where new older-timestamped duplicates appearing on the file system are simply inserted by walking through the history list. Given how uncommon this case would be, I think it would probably be fine to just solve it like that. But in principle, we might want to address this by changing the history data structure to something that can do better-than-O(n) sorted inserts... which is the same thing we'd want if we wanted the greater responsiveness of not needing to sort the entire directory listing up-front.)
If Emacs could actually do significant async I/O or true parallelism, there might be something to be gained there as well - even though f.e. Linux will lie and act as if local file I/O is never blocking as the level of poll/epoll/etc, we could certainly do the reads in a separate OS thread. But for now Emacs simply can't do that (there's a third-party "async" package which tries to make forking a separate OS process to do parallel work seamless, serializing objects and taking care of the I/O, but when I tried to do the most basic of its examples it errored out with a very cryptic error about a process sentinel... so either it's fragile/broken or I need to spend an arbitrary amount of time figuring out what I'm doing wrong in my setup).
But honestly? Just have two directories for call files instead of one - one for the most recent entries, however many thousands of those can be listed and sorted "instantly", and one for the rest.
Not sure if utter hack... or elegant engineering. But when the time comes, it will do.
And I like designs which help lower the bar on how simple/naive your code can be. If you have one huge directory, that requires optimized algorithms and data structures (or even file systems) past a certain point. But a simple switch from "there's one call subdirectory" to "there's 1-n call subdirectories" - even the stupidest unoptimized shell script benefits, for the small cost of handling more than one hard-coded subdirectory. It's just a question of how it fits in the v1 histdir format spec. (Is it an official extension? is it a later v1.1 addition to the core spec? does v1 come out of the gate with it?)
Anyway, for now the Emacs part of this is still living as uncommented code in my .emacs for now, (one clump of code for the core histdir stuff, one clump for wrapping arbitrary REPLs in terminals with histdir integration + vi-style editing, a little separate bit for hooking into into Eshell, and some dependency on helper stuff defined earlier in the file than that first clump), if you want to go through the effort of understanding it or pulling it out into your own stuff. I'm willing to answer questions, though the turnaround time might be long. Otherwise, one day it'll hopefully be a set of polished packages? (Sooner if people start paying me for my open source work.)
I am now also willing to make the histdir CLI repo public if anyone explicitly asks, because I am now confident enough in the directory format for a v1 release, but it's entirely undocumented for now and I don't know when that will change. (The ideal histdir repo is "here's a spec for this directory format, here's explanation/vision for how it combines with f.e. inotify and Syncthing for synced history, oh and here's one or more reference implementations with a stable API for actually working with it"... the current histdir repo is one CLI shell script named "histdir" which is probably good enough to lock in as a stable API.) If no one asks, I'll leave it private until I get around to documenting it properly.
0 notes
Text
WooCommerce Order Delivery Or Pick Up Date
WooCommerce Order Delivery Or Pick Up Date
BUY FOR $24 WooCommerce Order Delivery Or Pick Up Date allows your customers to select the date on which they want to receive the delivery/pick up of products. Using this, customer can provide the expected shipping arrival date and time or pick up date and time for their orders Enhance customers? satisfaction by enabling them to specify preferable delivery dates and time intervals to receive…

View On WordPress
#ecommerce#order date#Order Datetime#order delivery date#Order Pickup Date#timepicker#WooCommerce Order Delivery Date#WooCommerce Order Pickup Date
0 notes
Text
WooCommerce Order Delivery Or Pick Up Date - Ecommerce Bests
WooCommerce Order Delivery Or Pick Up Date – Ecommerce Bests
[ad_1]

WooCommerce Order Delivery Or Pick Up Date allows your customers to select the date on which they want to receive the delivery/pick up of products. Using this, customer can provide the expected shipping arrival date and time or pick up date and time for their orders
Enhance customers? satisfaction by enabling them to specify preferable delivery dates and time intervals to receive orders.…
View On WordPress
#Bests#date#delivery#ecommerce#order#order date#Order Datetime#order delivery date#Order Pickup Date#Pick#timepicker#woocommerce#WooCommerce Order Delivery Date#WooCommerce Order Pickup Date
0 notes
Text
On the original poll, the question is whether MM-DD-YYYY is the worst option.
Here, it's whether YYYY-MM-DD is the best.
HOT TAKE TOURNAMENT
TOURNAMENT OVERTIME #154
(PART 2)
Submission 477
the ONLY good date format is YYYY-MM-DD
[JUSTIFICATION UNDER THE CUT]
Propaganda is encouraged!
Also, remember to reblog your favourite polls for exposure!
i sure fucking can. LISTEN. picture a world. a world where YYYY-MM-DD is in use everywhere. no more writing out the full name of the month to be unambiguous. no more wondering if 08/05 is august 5th or may 8th. if you start with the year you KNOW the month comes next. no culture fucking uses YYYY-DD-MM. (and if you do i guess it's just to explicitly cause chaos and suffering so i can respect that a little.) personally i hate MM-DD-YYYY the most because it's not monotone increasing or decreasing. like you knew you'd have to specify the month and day and then you sloppily tacked on the year???? what????
like at least DD-MM-YYYY makes sense. it's like saying [street address], [city], [province], [country]. you tack on the bigger containers as they become necessary.
however. i will die on the hill that even DD-MM-YYYY is not as good as YYYY-MM-DD. and this is because of how numbers and alphabetizing works.
you see i had to analyze some data once for an internship. the spreadsheets were named with the date. and SOME of them used MM-DD-YYYY while others used YYYY-MM-DD. and you know what? the MM-DD-YYYY formatting was such a bitch to work with that I made a small simple program JUST for the purpose of renaming every single one into YYYY-MM-DD format.
because you know what happens when your sort anything but YYYY-MM-DD in alphabetical order????? you get all the fucking December dates lumped together across your entire year range. or all the first days of the month. it fucking sucks. relatedly i fucking hate 12-hour time with the AM PM stuff.
in conclusion YYYY-MM-DD with 24 hour time is a mercy to anyone that uses the date in their files. and literally anything else is data scientist cruelty. thanks and have a nice day /gen. hope you consider switching to the best datetime format today.
#hot take tournament#tournament poll#tumblr tournament#tumblr poll#tumblr bracket#hot take#unpopular opinion#hot take overtime
47 notes
·
View notes
Text
oh when I put some int formatted dates and times together to make datetimes I manually converted the times to 12 hour. guess I'm american first and considerate of sort order second.
ok this fucking report is wrong again even though this has happened twice and both times I fixed it for the data that was displaying at the time. what am I doing!!!
#according to my notes all 3 issues that messed up sorting have been completely unrelated#this is the worst work I've ever done lol
16 notes
·
View notes
Text
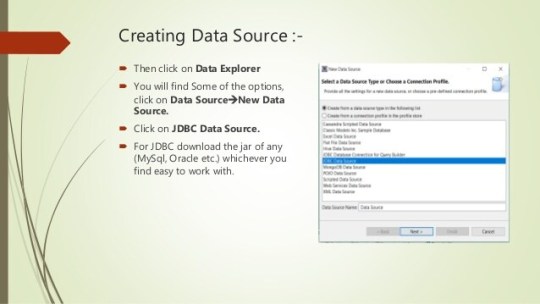
Birt Pojo Data Source

Eclipse Birt Pojo Data Source
Birt Report Pojo Data Source Example
Birt Pojo Data Source Example
Birt Pojo Data Source Examples
Use esProc with BIRT. Here is the SPL script. Your BIRT reports can have a query from two data sources no matter what kind of database and go on other computations that are not convenient on BIRT.
Using POJO DataSource in BIRT 4.3 To create a report in BIRT 4.3 we can use POJO dataSource. In 4.3 this DataSource is supported. To use this we need to create a dataset class.
BIRT is an open source engine to create data visualizations that can be integrated into Java web applications. It's a top-level software project within the Eclipse Foundation and leverages contributions by IBM and Innovent Solutions. It was started and sponsored by Actuate at the end of 2004.
Eclipse Birt Pojo Data Source
Primary tabs
. Data - Databases, web services, Java objects all can supply data to your BIRT report. BIRT provides JDBC, XML, Web Services, and Flat File support, as well as support for using code to get at other sources of data. BIRTs use of the Open Data Access (ODA) framework allows anyone to build new UI and runtime support for any kind of tabular data.
= unsolved/reopened
BIRT (146)Build (4)
101416 Incorrect font format in BIRT Developer Guide in Help menu (closed/fixed)
103303 The chart engine.jar in the runtime distribution is the wrong file (closed/fixed)
105638 Rotated text report item displays in palette by default (closed/fixed)
106247 Eclpse Distro Path (closed/fixed)
Chart (46)
102417 Chart title is set to Chinese, can not be previewed correctly.(resolved/wontfix)
103130 Chart title is overlapped when previewed.(closed/worksforme)
103143 Data format doesn't work in Chart (closed/invalid)
103153 Scatter chart, if tick transposed, image does not be changed.(closed/fixed)
103168 X Axis data is lost when transposed.(closed/fixed)
103298 X series in a pie chart in wrong order (resolved/fixed)
103438 Scatter chart is displayed differently when it is transferred from another chart type.(closed/fixed)
103439 Steps in chart builder can't be restored to default setting when cleared out.(closed/fixed)
103453 Scale for 'datetime' type in chart builder doesn't work.(closed/fixed)
103460 Multiple x axis are not supported.(closed/fixed)
103463 Datetime marker line can't be set.(closed/worksforme)
103595 Datetime data in Chart axis of example are displayed inconsistently in layout.(closed/invalid)
103599 Resizing chart results in Eclipse hang up.(closed/fixed)
103602 Exception is thrown when setting chart height or width.(closed/worksforme)
103613 Linking chart by parameter causes error when a NULL param value is reached (resolved/fixed)
103617 if Label positioin is changed, then can not return initial state.(closed/fixed)
103618 Bar Chart , Label position is lack of inside item.(closed/fixed)
103770 don't use hyperlink (resolved/invalid)
103780 Chart is not displayed in layout view when transposed.(closed/fixed)
103782 Attached chart design file can't be previewed.(closed/fixed)
103787 Add a new Y-axis and set it's title to visible will cause chartException.(closed/fixed)
103960 If x axis type is 'Linear', scale should be grayed out.(closed/fixed)
103961 Marker and line doesn't work for X Axis.(closed/fixed)
103963 If there is no data for series, it should pop up a friendly error message to remind.(closed/fixed)
104248 Axis types on Chart dialog are not displayed in localized language.(verified/fixed)
104252 Sort option on Chart X-Series dialog is not displayed in localized language.(verified/fixed)
104254 Type and Action value on Chart Y-Series are not displayed in localized language.(verified/fixed)
104278 Values in Tick Style list box are not displayed in localized language.(verified/fixed)
104283 Value for Label Position on Chart dialog are not displayed in localized language.(verified/fixed)
104290 Hard coded strings on Chart Attributes>Y Series dialog (verified/fixed)
104313 Set the image to the chart label background, system throws exception (closed/fixed)
104315 Plot background image can not always take effort .(closed/worksforme)
104450 If plot background is set, data set binding is lost.(closed/fixed)
104465 Data values of Y-series cannot be displayed correctly (closed/invalid)
104613 Steps changed after chart is transposed.(closed/invalid)
104628 Chart Major.Minor Grid line style won't display in layout (closed/wontfix)
104631 If set a long title to chart X Axis,Axis type will be truncated (closed/fixed)
99331 Eclipse hangs when closing 'Chart Dialog' (resolved/fixed)
100746 Whole chart should display smaller on scale, not only display title and legend after resize (closed/invalid)
101039 Series colors do not have different default values (closed/fixed)
101179 Unfriendly error message display when preview chart with invalid data set (closed/fixed)
101806 Chart axis label background is not displayed properly in layout view.(closed/fixed)
101827 Exception should be processed before written to error log or some error message should pop up to warn user (closed/fixed)
101855 Chart title top.bottom inset should display right in layout view (closed/fixed)
101868 series value format can display as setting (closed/fixed)
102455 Pie Chart is not round (closed/fixed)
Data (22)
94542 Grouping versus Sorting (closed/invalid)
99479 After Update Birt 1.0 error Cannot load JDBC Driver class (resolved/fixed)
101553 Report Parameters are not working (resolved/duplicate)
101864 NullPointerException throws out when setting the parameter type as auto (closed/fixed)
101865 Try to set report parameter's value in beforeOpen method of data source,error occurred when save but preview was correct.(closed/duplicate)
103135 Change the name of one computed column which are used in dataset filter will cause the dataset filter invalid.(closed/fixed)
103151 When a data set parameter is generated automatically, error message doesn't always pop up.(closed/fixed)
103292 No error message when group key dismatches the interval (closed/fixed)
103296 Data set column doesn't work when it is entered by keyboard in data set filter page.(closed/fixed)
103346 Weekly interval groups by 7 day increments, not by week (resolved/fixed)
103625 Database URL will be refreshed when editing JAR files in Manage drivers dialog (closed/fixed)
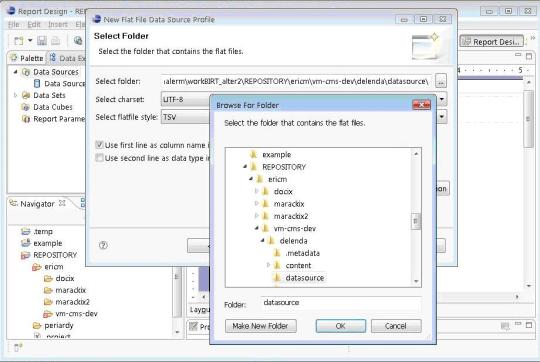
104174 If I re-select csv file name, columns selected before in right pane disappeared.(closed/fixed)
104178 Linux:No file listed for '*.*' filter when new a flat file data source (closed/fixed)
104185 An additional column is generated when create a script data set (closed/fixed)
104204 Test connection fail when try to connect birt derby sample db.(closed/fixed)
104397 JDBC Data Set Editor showing empty.system schemas (resolved/fixed)
104452 IllegalArgumentException thrown out when double click on data set after change flatfile data source charset (closed/fixed)
104578 German labels are truncated on Manage JDBC drivers dialog.(verified/fixed)
104611 Smoke Test: Jdbcodbc data source can't be connected.(closed/fixed)
104616 A sql statement with parameter can not be changed if you go out of 'Edit DataSet'->'Query' (closed/fixed)
106250 POJO Data Source (closed/fixed)
103802 Aggregate function in a group footer using Total.OVERALL fails (resolved/fixed)
Data Access (16)
99872 Implementing the ODA Log Configuration in BIRT ODA Drivers (resolved/fixed)
100090 JDBC driver loaded either by data explorer or report viewer (resolved/fixed)
100495 'next' button is grayed out in 'new data source' window when create a data source.(closed/fixed)
100501 NPE thrown out when new a flat file data set (closed/fixed)
101185 NullPointerException thrown out after click on Finish in data set dailog (closed/fixed)
101372 Limit the data set to a particular schema for JDBC connection (resolved/fixed)
102405 Broken display names when Qry has Dup col names (resolved/fixed)
103531 Change data set type from Flatfile Data Set to Flat File Data Set (resolved/fixed)
103533 Change Flatfile Data Source to Flat File Data Source (resolved/fixed)
103544 Allow any filename extension for CSV files (resolved/fixed)
103598 Flat file - Use second line as data type indicator only works for String (resolved/invalid)
103600 Change spelling in error message (resolved/fixed)
103942 Cannot create a JDBC connection (resolved/invalid)
104306 ODA Consumer handling of a null argument for IQuery.prepare (resolved/fixed)
104630 Column icons don't show up in connecting derby database (closed/fixed)
105112 ODA Log Configuration's Optional Attributes (resolved/fixed)
Documentation (3)
101582 Smoke Test: NullPointerException is thrown out when open an existing report design file in which there is grid.(closed/invalid)
101969 Wrong reference in BIRT Developer Guide (closed/fixed)
101977 API document is inconsistent with real implementation (closed/fixed)
Report (7)
87022 Use preservelastmodified in Ant Copy scripts (closed/fixed)
92091 rom.def - allowsUserProperties set to false for Styles, and other entries (resolved/fixed)
101825 Set bold style to grid in property editor and it will be reflected in grid highlight box when you add a highlight rule but will not when you modify it.(closed/fixed)
102496 onRender of Data item isn't executed (resolved/fixed)
102725 DimensionHandle can not parse '1,2in' (resolved/fixed)
103517 Cannot load 'Driver' class (resolved/fixed)
104769 org.eclipse.birt.report.model.metadata.ExtensionException found in meta.log (resolved/fixed)
Report Designer (28)
87803 Data Explorer view doesn't show new data source or data set (resolved/fixed)
87804 Incorrect rendering in BIRT property editor (closed/fixed)
87830 NullPointerException in org.eclipse.birt.report.designer.internal.ui.editors.schematic.ReportDesigner.selectionChanged (resolved/fixed)
88935 Wrong string formatting (upper and lower) (resolved/fixed)
100354 '%datasource.name' is listed in data sources list when create a data source.(closed/fixed)
100964 Provide Support for the Eclipse 3.1 Platform Release (resolved/fixed)
100965 Create a RCP version of BIRT Report Designer (resolved/fixed)
100999 Ctrl+Z.Y doesn't work in expression builder (closed/fixed)
101000 Font is not sorted in order.(closed/fixed)
101586 Exception throw out when new a table group with invalid group field (closed/fixed)
101973 Digit number for ruler displays partially when setting bigger value (closed/fixed)
102598 i18n bug mulitplies numbers by 10 (resolved/fixed)
102713 Undo.Redo can't be refreshed right away after setting hyperlink.(closed/fixed)
102969 Paste should be disabled when nothing is copied (closed/wontfix)
102973 Table group interval shouldn't change after preview (closed/fixed)
103126 hyperlink content in property editor can't be cleared (closed/fixed)
103158 NPE throw out when click on edit group in cheat sheet when delete table group (closed/fixed)
103171 edit the dynamic text won't restore last expression to expression builder (closed/invalid)
103526 New Data Set dialog box has red square on right side (resolved/fixed)
103788 Display inconsistantly in BIRT GUI (closed/fixed)
103962 RCP:Project icon can not displayed (closed/wontfix)
104184 The button in Dataset.Filters can not work (closed/fixed)
104307 when group on a double type field, set interval less than zero should be permitted (closed/fixed)
104617 In chinese testing environment, translation need to be improved.(closed/fixed)
104623 Highlight preview doesn't work when change two highlight rules order.(closed/fixed)
104764 Acceptance Test: New Report repeatly produces same name of file (closed/fixed)
101403 Smoke Test: Property editor view doesn't work.(closed/fixed)
101407 NullPointerException when selecting Save As in top menu (closed/fixed)
Report Engine (14)
96357 Projects contain errors when opened in Eclipse (resolved/worksforme)
101361 Bugs in org.eclipse.birt.report.engine.extension.internal.ExtensionManager (resolved/fixed)
101685 Unable to use the Report Item Extension framework, when no query exists (resolved/fixed)
101751 Enhance IImagehandler interface to allow full customization of birt image handling mechanism (resolved/fixed)
103050 PDF Hyperlinks (resolved/fixed)
103106 Generates incompatible FOP files (resolved/fixed)
103120 Hyperlink file can't be retrived when click it in PDF page (closed/invalid)
103169 Format number with Symbol prefix should display right size when preview in Linux (closed/wontfix)
103449 Log BIRT extension loading details information (resolved/fixed)
103622 Inline for two grids doesn't work in layout view and pdf preview.(closed/duplicate)
104172 Blank pages will be generated when set Page Break to always.left.right.(closed/invalid)
104239 Value-Of Problem (resolved/fixed)
104457 Set table drop to all, preview does not take effect.(closed/worksforme)
104629 Generating report in custom plugin cause exception fop.xml malformed URL (resolved/fixed)
Report Viewer (5)
Birt Report Pojo Data Source Example
100596 DateTime parameters not functioning as report parameters (resolved/invalid)
104177 Spaces in parameter value which is entered are trimmed when previewed in html.(closed/wontfix)
104462 There is a parameter in a parameter group, 'show report parameters' button is always grayed out when previewed.(closed/fixed)
104759 Image imported from a related path in file system can't be previewed.(closed/invalid)
104962 Smoke Test: Data can't be displayed when previewed if data source type is 'sample datasource' or 'JDBC Data Source' except 'JDBCODBC driver'.(closed/fixed)
Test Suite (1)
100968 Provide Daily Build Test Reports on eclipse.org.birt Web Site (closed/fixed)
In a previous blog post I created a skeleton class for rendering a report using BIRT runtime. You can pass it the report parameters, the report definition (rptdesign) and an OutputStream and it will render HTML to that stream.
If your report definition contains graphs we run into a problem. Normally, in HTML an image is a separate resource. BIRT will generate the images containing your graphs in a temporary directory and will link to them in your HTML. For this to work, you will have to configure the Platform to write the images to a publicly accessible directory and write the links using the correct domains. Furthermore, you’ll probably need some process to clean up the images after the reports have been viewed. If your reports are being used in some website and generated on the fly, this is most likely quite difficult to determine. Maybe when the user logs out?
Luckily, in modern browsers we can embed the images in the same stream, bypassing the need of a temporary directory. The following trick will encode the image with base64 and embed it directly into the HTML stream using css data . This will work on most modern browsers but of course Internet Explorer lags a bit behind. PNG support is available up until 32kb in Internet Explorer 8 and SVG not at all. Internet Explorer 9 works fine, as well as the other major browsers.
So how does it work? First, we explicitly tell the render engine to use PNG or SVG. SVG provides sharper images but will not work in Internet Explorer 8 as mentioned above. Next, we inject our own HTMLServerImageHandler which encodes the image data to base64.
Birt Pojo Data Source Example
2
4
6
8
10
12
14
16
18
20
22
24
privateHTMLRenderOption getHtmlRenderOptions(OutputStream outs)(
HTMLRenderOption options=newHTMLRenderOption();
options.setSupportedImageFormats('SVG');
options.setSupportedImageFormats('PNG');
setupImageHandler(options);
options.setOutputFormat('html');
)
privatevoidsetupImageHandler(finalHTMLRenderOption options)(
options.setImageHandler(newHTMLServerImageHandler()(
protectedStringhandleImage(IImage image,Objectcontext,Stringprefix,booleanneedMap)(
StringembeddedImage=Base64.encode(image.getImageData(),false);
return'data:'+image.getMimeType()+';base64,'+embeddedImage;
));
Birt Pojo Data Source Examples
Some references:
1 note
·
View note
Text
Incubators: Taking The Startup Ecosystem In Central India To The Level Next
Posted by admin on March 19, 2021
The sole purpose for the existence of a ‘Startup Incubator’ is to help entrepreneurs & startups convert an idea into a successful business.
Startup Ecosystem In Madhya Pradesh Known for its rich cultural heritage and natural resources, Madhya Pradesh, at the heart of India, is also one of the emerging startup ecosystems of India. Powered by a startup-friendly initiatives by the central as well as the state government itself, Madhya Pradesh earned its spot as one of the emerging startup ecosystems in DPIIT’s 2020-2021 annual report.
One of the interesting aspects about the state is the abundance of skilled technical workforce, thereby providing a tailor-made platform to promote startups in the state. In order to ignite the spirit of entrepreneurship and innovation for people in the state and converting ideas into potential businesses, the state government, in 2016, outlined a startup policy to provide an enabling environment to achieve this objective
On the back of which the state have been a consistent performer in the year-wise rankings of States/UTs in the State Reform Action Plans (SRAPs) from last four years.
Year-wise rankings of States/UTs in the State Reform Action Plans (SRAPs) Role Of Incubators As Ecosystem Enablers
Incubation support is an integral element of the startup ecosystem that supports entrepreneurs to grow their businesses and assists new startups to succeed. In order to promote startups, the state governments collaborate with organisations, corporates or industry associates to establish incubators, to support startups in the form of capital expenditure or operational expenditure.
Startup incubators are institutions that help entrepreneurs to develop their business, especially in the initial stages. Incubator support includes providing technological facilities and advices, initial growth funds, network and linkages, co-working spaces, lab facilities, mentoring and advisory support.
Startup incubators in India Government’s startup policy gives prime role to incubators by giving them recognition, regulation guidelines and financial help. The identified incubators have to provide the various assistance to startups. Atal Innovation Mission promotes Atal Incubation Centres to realize its mission objectives.
Overall, there around 250 recognized incubators in the country (including the 56 under the startup policy) now and several of them are sponsored by esteemed educational institutions like IIMs, IITs and specialized startup agencies like Kerala Startup Mission.
Atal Incubation Centres (AICs) AIM (Atal Innovation Mission) has supported the launch of incubation centres called Atal Incubation Centres (AICs) to create world class incubation facilities across India with suitable physical infrastructure. The AICs should provide capital equipment, operating facilities and experts for mentoring the start-ups, business planning support, supply of seed capital, providing industry partners, and trainings etc., required for encouraging innovative start-ups.
To take forward this initiative of the central & state government in the state of Madhya Pradesh, AIC-Prestige Inspire Foundation is working to make the startup ecosystem in the state more prominent and take it to the next level.
AIC-Prestige Inspire Foundation: Inspiring Innovators To Scale Up AIC-PIF is a modern incubation center at Indore for in-campus and virtual incubation of startups. It functions under the Atal Innovation Mission Scheme of NITI Aayog, Government of India.
It supports innovative and disruptive start-ups to become viable business ventures start from next time. Overall ecosystem support to startups for prototyping, validation scaleup and expansion.
Incubation Services And Facilities For Startups At AIC Prestige
AIC-Prestige Is Helping Startups To Grow And Scale Up By Providing Them With
More than 40 Startups from different sectors viz. Healthcare, Med-tech, EVs, Edutech, SaaS along with other evolving sectors are currently getting incubated at AIC-Prestige. As we work with an objective to promote entrepreneurship wherein innovators and startups are supported and mentored to be successful entrepreneurs.
www.aic-prestigeinspirefoundation.in Leave a Reply Your email address will not be published. Required fields are marked *
Comment You may use these HTML tags and attributes: <a href="" title=""> <abbr title=""> <acronym title=""> <b> <blockquote cite=""> <cite> <code> <del datetime=""> <em> <i> <q cite=""> <s> <strike> <strong>
Name * Email * Website
1 note
·
View note
Text
Recover Table Structure From InnoDB Dictionary
When a table gets dropped, MySQL removes the respective .frm file. This post explains how to recover the table structure if the table was dropped. You need the table structure to recover a dropped table from the InnoDB tablespace. The B+tree structure of the InnoDB index doesn’t contain any information about field types. MySQL needs to know that in order to access records of the InnoDB table. Normally, MySQL gets the table structure from the .frm file. But when MySQL drops a table the respective frm file removed too. Fortunately, there’s one more place where MySQL keeps the table structure. It’s the InnoDB dictionary. The InnoDB dictionary is a set of tables where InnoDB keeps information about the tables. I reviewed them in detail in a separate InnoDB Dictionary post earlier. After the DROP, InnoDB deletes records related to the dropped table from the dictionary. So, we need to recover deleted records from the dictionary and then get the table structure. Compiling Data Recovery Tool First, we need to get the source code. The code is hosted on GitHub. git clone https://github.com/twindb/undrop-for-innodb.git To compile it, we need gcc, bison and flex. Install these packages with a package manager (yum/apt/etc). Then, time to compile. # make cc -g -O3 -I./include -c stream_parser.c cc -g -O3 -I./include -pthread -lm stream_parser.o -o stream_parser flex sql_parser.l bison -o sql_parser.c sql_parser.y sql_parser.y: conflicts: 6 shift/reduce cc -g -O3 -I./include -c sql_parser.c cc -g -O3 -I./include -c c_parser.c cc -g -O3 -I./include -c tables_dict.c cc -g -O3 -I./include -c print_data.c cc -g -O3 -I./include -c check_data.c cc -g -O3 -I./include sql_parser.o c_parser.o tables_dict.o print_data.o check_data.o -o c_parser -pthread -lm cc -g -O3 -I./include -o innochecksum_changer innochecksum.c Recover The InnoDB Dictionary Now, let’s create dictionary tables in the sakila_recovered database. The data recovery tool comes with the structure of the dictionary tables. # cat dictionary/SYS_* | mysql sakila_recovered The dictionary is stored in the ibdata1 file. So, let’s parse it. ./stream_parser -f /var/lib/mysql/ibdata1 ... Size to process: 79691776 (76.000 MiB) Worker(0): 84.13% done. 2014-09-03 16:31:20 ETA(in 00:00:00). Processing speed: 7.984 MiB/sec Worker(2): 84.21% done. 2014-09-03 16:31:20 ETA(in 00:00:00). Processing speed: 8.000 MiB/sec Worker(1): 84.21% done. 2014-09-03 16:31:21 ETA(in 00:00:00). Processing speed: 4.000 MiB/sec All workers finished in 2 sec Now, we need to extract the dictionary records from the InnoDB pages. Let’s create a directory for the table dumps. # mkdir -p dumps/default And now we can generate table dumps and LOAD INFILE commands to load the dumps. We also need to specify the -D option to the c_parser because the records we need were deleted from the dictionary when the table was dropped. SYS_TABLES # ./c_parser -4Df pages-ibdata1/FIL_PAGE_INDEX/0000000000000001.page -t dictionary/SYS_TABLES.sql > dumps/default/SYS_TABLES 2> dumps/default/SYS_TABLES.sql SYS_INDEXES # ./c_parser -4Df pages-ibdata1/FIL_PAGE_INDEX/0000000000000003.page -t dictionary/SYS_INDEXES.sql > dumps/default/SYS_INDEXES 2> dumps/default/SYS_INDEXES.sql SYS_COLUMNS # ./c_parser -4Df pages-ibdata1/FIL_PAGE_INDEX/0000000000000002.page -t dictionary/SYS_COLUMNS.sql > dumps/default/SYS_COLUMNS 2> dumps/default/SYS_COLUMNS.sql SYS_FIELDS # ./c_parser -4Df pages-ibdata1/FIL_PAGE_INDEX/0000000000000004.page -t dictionary/SYS_FIELDS.sql > dumps/default/SYS_FIELDS 2> dumps/default/SYS_FIELDS.sql With the generated LOAD INFILE commands it’s easy to load the dumps. # cat dumps/default/*.sql | mysql sakila_recovered Now we have the InnoDB dictionary loaded into normal InnoDB tables. Compiling sys_parser ys_parser is a tool that reads the dictionary from tables stored in MySQL and generates the CREATE TABLE structure for a table. To compile it we need MySQL libraries and development files. Depending on distribution, they may be in -devel or -dev package. On RedHat based systems, you can check it with the command yum provides “*/mysql_config” . On my server it was the mysql-community-devel package. If all necessary packages are installed, the compilation boils down to a simple command: # make sys_parser /usr/bin/mysql_config cc `mysql_config --cflags` `mysql_config --libs` -o sys_parser sys_parser.c Recover Table Structure Now sys_parser can do its magic. Just run it to get the CREATE statement in the standard output. # ./sys_parser sys_parser [-h ] [-u ] [-p ] [-d ] databases/table It will use “root” as the username to connect to MySQL, “querty” – as the password. The dictionary is stored in SYS_* tables in the sakila_recovered database. What we want to recover is sakila.actor. InnoDB uses a slash “/” as a separator between database name and table name, so does sys_parser. # ./sys_parser -u root -p qwerty -d sakila_recovered sakila/actor CREATE TABLE `actor`( `actor_id` SMALLINT UNSIGNED NOT NULL, `first_name` VARCHAR(45) CHARACTER SET 'utf8' COLLATE 'utf8_general_ci' NOT NULL, `last_name` VARCHAR(45) CHARACTER SET 'utf8' COLLATE 'utf8_general_ci' NOT NULL, `last_update` TIMESTAMP NOT NULL, PRIMARY KEY (`actor_id`) ) ENGINE=InnoDB; # ./sys_parser -u root -p qwerty -d sakila_recovered sakila/customer CREATE TABLE `customer`( `customer_id` SMALLINT UNSIGNED NOT NULL, `store_id` TINYINT UNSIGNED NOT NULL, `first_name` VARCHAR(45) CHARACTER SET 'utf8' COLLATE 'utf8_general_ci' NOT NULL, `last_name` VARCHAR(45) CHARACTER SET 'utf8' COLLATE 'utf8_general_ci' NOT NULL, `email` VARCHAR(50) CHARACTER SET 'utf8' COLLATE 'utf8_general_ci', `address_id` SMALLINT UNSIGNED NOT NULL, `active` TINYINT NOT NULL, `create_date` DATETIME NOT NULL, `last_update` TIMESTAMP NOT NULL, PRIMARY KEY (`customer_id`) ) ENGINE=InnoDB; There are few caveats though. InnoDB doesn’t store all information you can find in the .frm file. For example, if a field is AUTO_INCREMENT, the InnoDB dictionary knows nothing about it. Therefore, sys_parser won’t recover that property. If there were any field or table level comments, they’ll be lost. sys_parser generates the table structure eligible for further data recovery. It could but it doesn’t recover secondary indexes, or foreign keys. InnoDB stores the DECIMAL type as a binary string. It doesn’t store the precision of a DECIMAL field. So, that information will be lost. For example, table payment uses DECIMAL to store money. # ./sys_parser -u root -p qwerty -d sakila_recovered sakila/payment CREATE TABLE `payment`( `payment_id` SMALLINT UNSIGNED NOT NULL, `customer_id` SMALLINT UNSIGNED NOT NULL, `staff_id` TINYINT UNSIGNED NOT NULL, `rental_id` INT, `amount` DECIMAL(6,0) NOT NULL, `payment_date` DATETIME NOT NULL, `last_update` TIMESTAMP NOT NULL, PRIMARY KEY (`payment_id`) ) ENGINE=InnoDB; Fortunately, Oracle is planning to extend the InnoDB dictionary and finally get rid of .frm files. I salute that decision, having the structure in two places leads to inconsistencies. Image credit: m.khajoo https://twindb.com/recover-table-structure-from-innodb-dictionary-recover-table-structure-from-innodb-dictionary/
1 note
·
View note