#Power BI REST API
Explore tagged Tumblr posts
Visit Tumblr Blog
Explore Tumblr blogs with no restrictions, modern design and the best experience.
Last Seen Tumblr Blogs


Fun Fact
Tumblr has been banned in Indonesia for providing people with access to pornographic content.
Text
Fabric Rest API ahora en SimplePBI
La Data Web trae un regalo para esta navidad. Luego de un gran tiempo de trabajo, hemos incorporado una gran cantidad de requests provenientes de la API de Fabric a la librería SimplePBI de python . Los llamados globales ya están en preview y hemos intentado abarcar los más destacados.
Este es el comienzo de un largo camino de desarrollo que poco a poco intentar abarcar cada vez más categorías para facilitar el uso como venimos haciendo con Power Bi hace años.
Este artículo nos da un panorama de que hay especificamente y como comenzar a utilizarla pronto.
Para ponernos en contexto comenzamos con la teoría. SimplePBI es una librería de Python open source que vuelve mucho más simple interactuar con la PowerBi Rest API. Ahora incorpora también Fabric Rest API. Esto significa que no tenemos que instalar una nueva librería sino que basta con actualizarla. Esto podemos hacerlo desde una consola de comandos ejecutando pip siempre y cuando tengamos python instalado y PIP en las variables de entorno. Hay dos formas:
pip install --upgrade SimplePBI pip install -U SimplePBI
Necesitamos una versión 1.0.1 o superior para disponer de la nueva funcionalidad.
Pre requisitos
Tal como lo hacíamos con la PowerBi Rest API, lo primero es registrar una app en azure y dar sus correspondientes permisos. De momento, todos los permisos de Fabric se encuentran bajo la aplicación delegada "Power Bi Service". Podes ver este artículo para ejecutar el proceso: https://blog.ladataweb.com.ar/post/740398550344728576/seteo-powerbi-rest-api-por-primera-vez
Características
La nueva incorporación intentará cubrir principalmente dos categorías indispensables de la Rest API. Veamos la documentación para guiarnos mejor: https://learn.microsoft.com/en-us/rest/api/fabric/articles/api-structure
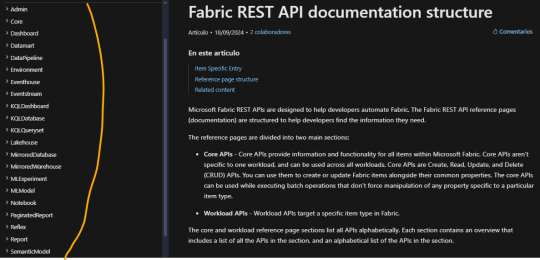
A la izquierda podemos ver todas las categorías bajo las cuales consultar u operar siempre y cuando tengamos permisos. Fabric ha optado por denominar "Items" a cada tipo de contenido creable en su entorno. Por ejemplo un item podría ser un notebook, un modelo semántico o un reporte. En este primer release, hemos decidido enfocarnos en las categorías más amplias. Estamos hablando de Admin y Core. Cada una contiene una gran cantidad métodos. Una enfocada en visión del tenant y otro en operativo de la organización. Admin contiene subcategorías como domains, items, labels, tenant, users, workspaces. En core encontraremos otra como capacities, connections, deployment pipelines, gateways, items, job scheduler, long running operations, workspaces.
La forma de uso es muy similar a lo que simplepbi siempre ha presentado con una ligera diferencia en su inicialización de objeto, puesto que ahora tenemos varias clases en un objeto como admin o core.
Para importar llamaremos a fabric desde simplepbi aclarando la categoría deseada
from simplepbi.fabric import core
Para autenticar vamos a necesitar valores de la app registrada. Podemos hacerlo por service principal con un secreto o nuestras credenciales. Un ejemplo para obtener un token que nos permita utilizar los objetos de la api con service principal es:
t = token.Token(tenant_id, app_client_id, None, None, app_secret_key, use_service_principal=True)
Vamos intentar que las categorías de la documentación coincidan con el nombre a colocar luego de importar. Sin embargo, puede que algunas no coincidan como "Admin" de fabric no puede usarse porque ya existe en simplepbi. Por lo tanto usariamos "adminfab". Luego inicializamos el objeto con la clase deseada de la categoría de core.
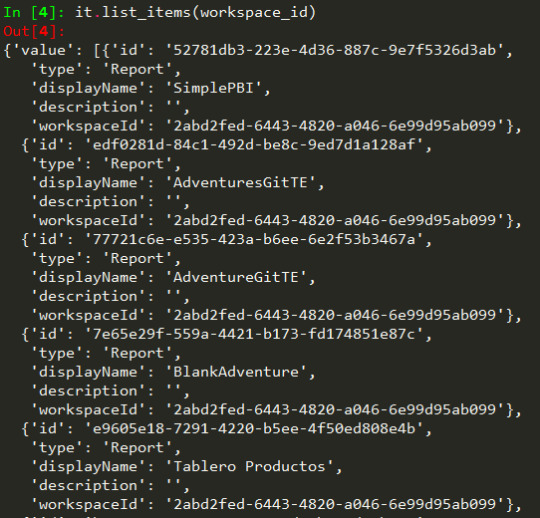
it = core.Items(t.token)
De este modo tenemos accesibilidad a cada método en items de core. Por ejemplo listarlos:
Consideraciones
No todos los requests funcionan con Service Principal. La documentación especifica si podremos usar dicha autenticación o no. Leamos con cuidado en caso de fallas porque podría no soportar ese método.
Nuevos lanzamientos en core y admin. Nos queda un largo año en que buscaremos tener esas categorías actualizadas y poco a poco ir planificando bajo prioridad cuales son las más atractivas para continuar.
Para conocer más, seguirnos o aportar podes encontrarnos en pypi o github.
Recordemos que no solo la librería esta incorporando estos requests como preview sino también que la Fabric API esta cambiando cada día con nuevos lanzamientos y modificaciones que podrían impactar en su uso. Por esto les pedimos feedback y paciencia para ir construyendo en comunidad una librería más robusta.
#fabric#microsoftfabric#fabric tutorial#fabric training#fabric tips#fabric rest api#power bi rest api#fabric python#ladataweb#simplepbi#fabric argentina#fabric cordoba#fabric jujuy
0 notes
Text
Empowering Indian Enterprises with Microsoft Dynamics 365 Business Central: Your Path to Scalable Growth.Microsoft Dynamics 365 Business Central India | Microsoft Dynamics 365 Business Central providers India
In the competitive Indian market, businesses are progressively adopting advanced, cloud-based ERP solutions that offer flexibility, scalability, and profound business insights. Microsoft Dynamics 365 Business Central India has emerged as a top choice for small and medium-sized businesses (SMEs) looking to improve operational efficiency, obtain real-time insight, and promote long-term development. Business Central is a reliable and resilient system that combines finance, operations, sales, and customer support to help businesses prosper in a data-driven market.
Choosing the appropriate ERP partner is important for success. That is why businesses across industries are turning to reputable Microsoft Dynamics 365 Business Central suppliers in India who understand local difficulties and provide specialized implementation and integration solutions. Preeminent SoftCom is a major Dynamics 365 Business Central integration partner that enables Indian organizations with customized ERP systems, easy integrations, and ongoing support.

Why Microsoft Dynamics 365 Business Central India is Transforming SMEs
Microsoft Dynamics 365 Business Central India is more than just an ERP tool; it is a full-fledged business management solution designed to streamline and improve key activities. With capabilities such as financial management, inventory monitoring, supply chain automation, project delivery, and customer relationship management, Indian SMEs may obtain complete control over their company activities.
Furthermore, this cloud-native platform offers anytime, anywhere access, making it appropriate for India's booming mobile and remote-first enterprises. Integration with Microsoft technologies such as Power BI, Outlook, and Teams provides better collaboration and faster decision-making.
Benefits of Partnering with Microsoft Dynamics 365 Business Central Providers India
Implementing an ERP system like company Central involves extensive technical knowledge, strategic planning, and a thorough grasp of Indian company procedures. That is why working with experienced Microsoft Dynamics 365 Business Central suppliers India is critical for a successful setup.
Top suppliers, such as Preeminent SoftCom, provide regional market expertise, agile processes, and post-implementation support to help organizations maximize the ROI on their ERP investment. Whether you're replacing outdated systems or require a new cloud solution, the proper supplier will customize Business Central to fit your operating structure.
Why Integration Matters: Choosing the Right Dynamics 365 Business Central Integration Partner
As firms in India use more specialized IT solutions, integration becomes increasingly important. Connecting Microsoft Dynamics 365 Business Central with other systems, such as CRM platforms, eCommerce sites, third-party logistics, or payroll, involves the use of an experienced Dynamics 365 Business Central integration partner.
A knowledgeable integration partner guarantees that your ERP system connects with external apps seamlessly, removing silos and cumbersome data management. Preeminent SoftCom, as a renowned Dynamics 365 Business Central integration partner, provides comprehensive integration capabilities that use REST APIs, web services, and bespoke connectors to create a cohesive digital environment.
Why Preeminent SoftCom is Your Best Choice
Preeminent SoftCom, one of the most well-known Microsoft Dynamics 365 Business Central providers in India, combines years of installation expertise, qualified consultants, and industry-specific solutions customized to Indian organizations.
Here’s what sets Preeminent SoftCom apart:
Localized Expertise: We understand the complexities of the Indian market, tax systems (GST), and compliance requirements.
Scalable Implementations: From 10 to 10,000 users, we build scalable ERP environments that grow with your business.
Advanced Integration: As your dedicated Dynamics 365 Business Central integration partner, we enable end-to-end connectivity with your existing digital infrastructure.
Post-Go-Live Support: Our team provides continuous maintenance, training, and process optimization services.
Real-World Applications of Microsoft Dynamics 365 Business Central in India
Businesses across industries—manufacturing, retail, distribution, healthcare, and services—are turning to Microsoft Dynamics 365 Business Central India for real-time visibility and operational agility. For example:
A retail chain in Mumbai used Business Central to unify inventory management across 50+ outlets.
A manufacturing firm in Pune integrated Business Central with IoT devices to monitor equipment efficiency.
A service provider in Delhi streamlined billing, project tracking, and resource allocation using the platform.
These success stories are made possible by skilled Microsoft Dynamics 365 business Central providers in India and adept Dynamics 365 Business Central integration partners such as Preeminent SoftCom, who customize each deployment to match unique business goals.
Conclusion: Start Your ERP Journey Today
In India's rapidly changing corporate landscape, digital transformation is no longer an option—it is a requirement. Microsoft Dynamics 365 Business Central India provides a single, intelligent, and scalable platform for streamlining essential business activities and increasing operational visibility.
To get the most out of this sophisticated ERP solution, work with skilled Microsoft Dynamics 365 Business Central suppliers in India who understand your particular difficulties. Don't underestimate the importance of dealing with a reputable Dynamics 365 Business Central integration partner that can guarantee your systems function together seamlessly.
Partner with Preeminent SoftCom now and take the first step toward a more intelligent, agile company future. Contact us
0 notes
Text

Automation Product Architect
Job SummaryWe are seeking a talented Automation Product Architect (10 Years) to join our team. If you're passionate about coding, problem-solving, and innovation, wed love to hear from you!About CodeVyasa: We're a fast-growing multinational software company with offices in Florida and New Delhi. Our clientele spans across the US, Australia, and the APAC region. We're proud to collaborate with Fortune 500 companies and offer opportunities to work alongside the top 0.1 percent of developers in the industry. You'll report to IIT/BITS graduates with over 10 years of development experience. Ready to elevate your career? Visit us at codevyasa.com. Must-Have Skills:
Microsoft Power Platform (Power Automate, Power Apps, Power BI)
UiPath (RPA Development, Orchestrator, Bot Management)
Strong understanding of automation design principles and business process optimization
Experience with data sources like SharePoint, SQL, Excel, and Dataverse
Scripting and expression writing (Power Fx, VB.Net, Python, or JavaScript)
API integration and knowledge of REST/JSON services
Good troubleshooting, debugging, and performance tuning skillsGood-to-Have Skills:
Familiarity with Azure Logic Apps or Azure Functions
Experience working with Agile/Scrum teams
Exposure to custom connectors and low-code/no-code governance frameworks
Basic knowledge of Power Virtual Agents
Why Join CodeVyasa?Work on innovative, high-impact projects with a team of top-tier professionals.
Continuous learning opportunities and professional growth.
Flexible work environment with a supportive company culture.
Competitive salary and comprehensive benefits package.
Free healthcare coverage.
Budget- Upto 55 lakhs
Location- Chennai
Must Have skills- Ui Path, Power platforms
Job Type
Payroll
Categories
Product Specialists (Sales)
Systems Analysts (Information Design and Documentaion)
Software Engineer (Software and Web Development)
Data Engineer (Software and Web Development)
Automation Engineer (Software and Web Development)
Business Process Analyst (Information Design and Documentaion)
Architect (Contruction )
Must have Skills
PowerApps - 10 Years
UiPath - 10 Years
Power BI - 8 Years
SQL - 4 YearsIntermediate
SharePoint - 4 YearsIntermediate
REST - 4 YearsIntermediate
Azure - 4 YearsIntermediate
Apply Now: https://crazysolutions.in/job-openings/
0 notes
Text
Services in Web Development – NextGen2AI
Empowering Digital Innovation with Intelligent Web Solutions
At NextGen2AI, we don’t just build websites—we engineer intelligent digital experiences that shape the future. Our web development services combine cutting-edge design with AI-powered functionality to help businesses grow, adapt, and thrive online.
Here’s a closer look at the wide range of web development services we offer:
1. Custom Website Development
We build responsive, scalable websites tailored to your brand and goals. Whether it's a corporate site, landing page, or portfolio, our custom designs ensure top-notch performance and user experience.
Features:
Mobile-first, responsive design
SEO-ready structure
Fast loading & optimized performance
2. AI-Integrated Web Applications
Harness the power of machine learning, natural language processing, and predictive analytics to create smart web applications that learn, adapt, and respond.
Use Cases:
Smart chatbots
Personalized content delivery
Intelligent recommendations
3. Frontend Development
Our frontend team creates sleek, interactive user interfaces using the latest technologies like React, Angular, and Vue.js.
Key Benefits:
Enhanced UX/UI
Real-time interactivity
Clean, modern design
4. Backend Development & APIs
We build powerful backend systems that ensure seamless operations, data processing, and secure integrations.
Technologies:
Node.js, Python, PHP
REST & GraphQL APIs
Secure authentication systems
5. E-Commerce Development
Boost your online business with scalable, user-friendly e-commerce solutions powered by AI for product suggestions, smart search, and personalized shopping experiences.
Platforms:
Shopify
WooCommerce
Custom-built e-commerce platforms
6. CMS Solutions
We deliver flexible, easy-to-manage websites using content management systems like WordPress, Webflow, or custom CMS tools.
Highlights:
No-code or low-code editing
Role-based content control
Blog, news, and media management
7. Data Visualization Dashboards
Our web dashboards bring data to life—helping businesses make decisions based on real-time insights through interactive graphs and AI analytics.
Tools We Use:
Chart.js, D3.js
Power BI integration
Custom dashboards with Python/JS
8. Progressive Web Apps (PWAs)
We develop web apps that work offline, load instantly, and feel like native mobile apps—perfect for improving reach and performance.
Why Choose NextGen2AI?
AI-First Approach Customized Development Scalable & Secure Systems End-to-End Support
Ready to Elevate Your Digital Presence?
Let NextGen2AI help you build future-proof web experiences. Whether you're a startup or an enterprise, our web development services will transform your ideas into intelligent, engaging platforms.
🔗 Visit us: Next Gen2AI
0 notes
Text
Extract Amazon Product Prices with Web Scraping | Actowiz Solutions
Introduction
In the ever-evolving world of e-commerce, pricing strategy can make or break a brand. Amazon, being the global e-commerce behemoth, is a key platform where pricing intelligence offers an unmatched advantage. To stay ahead in such a competitive environment, businesses need real-time insights into product prices, trends, and fluctuations. This is where Actowiz Solutions comes into play. Through advanced Amazon price scraping solutions, Actowiz empowers businesses with accurate, structured, and actionable data.
Why extract Amazon Product Prices?

Price is one of the most influential factors affecting a customer’s purchasing decision. Here are several reasons why extracting Amazon product prices is crucial:
Competitor Analysis: Stay informed about competitors’ pricing.
Dynamic Pricing: Adjust your prices in real time based on market trends.
Market Research: Understand consumer behavior through price trends.
Inventory & Repricing Strategy: Align stock and pricing decisions with demand.
With Actowiz Solutions’ Amazon scraping services, you get access to clean, structured, and timely data without violating Amazon’s terms.
How Actowiz Solutions Extracts Amazon Price Data

Actowiz Solutions uses advanced scraping technologies tailored for Amazon’s complex site structure. Here’s a breakdown:
1. Custom Scraping Infrastructure
Actowiz Solutions builds custom scrapers that can navigate Amazon’s dynamic content, pagination, and bot protection layers like CAPTCHA, IP throttling, and JavaScript rendering.
2. Proxy Rotation & User-Agent Spoofing
To avoid detection and bans, Actowiz employs rotating proxies and multiple user-agent headers that simulate real user behavior.
3. Scheduled Data Extraction
Actowiz enables regular scheduling of price scraping jobs — be it hourly, daily, or weekly — for ongoing price intelligence.
4. Data Points Captured
The scraping service extracts:
Product name & ASIN
Price (MRP, discounted, deal price)
Availability
Ratings & Reviews
Seller information
Real-World Use Cases for Amazon Price Scraping

A. Retailers & Brands
Monitor price changes for own products or competitors to adjust pricing in real-time.
B. Marketplaces
Aggregate seller data to ensure competitive offerings and improve platform relevance.
C. Price Comparison Sites
Fuel your platform with fresh, real-time Amazon price data.
D. E-commerce Analytics Firms
Get historical and real-time pricing trends to generate valuable reports for clients.
Dataset Snapshot: Amazon Product Prices

Below is a snapshot of average product prices on Amazon across popular categories:
Product CategoryAverage Price (USD)Electronics120.50Books15.75Home & Kitchen45.30Fashion35.90Toys & Games25.40Beauty20.60Sports50.10Automotive75.80
Benefits of Choosing Actowiz Solutions

1. Scalability: From thousands to millions of records.
2. Accuracy: Real-time validation and monitoring ensure data reliability.
3. Customization: Solutions are tailored to each business use case.
4. Compliance: Ethical scraping methods that respect platform policies.
5. Support: Dedicated support and data quality teams
Legal & Ethical Considerations

Amazon has strict policies regarding automated data collection. Actowiz Solutions follows legal frameworks and deploys ethical scraping practices including:
Scraping only public data
Abiding by robots.txt guidelines
Avoiding high-frequency access that may affect site performance
Integration Options for Amazon Price Data

Actowiz Solutions offers flexible delivery and integration methods:
APIs: RESTful APIs for on-demand price fetching.
CSV/JSON Feeds: Periodic data dumps in industry-standard formats.
Dashboard Integration: Plug data directly into internal BI tools like Tableau or Power BI.
Contact Actowiz Solutions today to learn how our Amazon scraping solutions can supercharge your e-commerce strategy.Contact Us Today!
Conclusion: Future-Proof Your Pricing Strategy
The world of online retail is fast-moving and highly competitive. With Amazon as a major marketplace, getting a pulse on product prices is vital. Actowiz Solutions provides a robust, scalable, and ethical way to extract product prices from Amazon.
Whether you’re a startup or a Fortune 500 company, pricing intelligence can be your competitive edge. Learn More
#ExtractProductPrices#PriceIntelligence#AmazonScrapingServices#AmazonPriceScrapingSolutions#RealTimeInsights
0 notes
Text
Unlock Full-Stack Potential with Techmindz’s Advanced MERN Stack Course in Kochi
In today’s digital-first world, businesses and startups are rapidly shifting toward scalable web applications. To keep up with this demand, developers need robust, full-stack skills—and that’s where the MERN stack comes in. If you're in search of a career-boosting opportunity, Techmindz’s Advanced MERN Stack Course in Kochi is your perfect launchpad.
Why Choose the MERN Stack?
The MERN stack—MongoDB, Express.js, React.js, and Node.js—is one of the most sought-after technology stacks in modern web development. With JavaScript as the backbone of all four technologies, MERN offers seamless development and integration from front-end to back-end. This makes it ideal for building powerful, responsive, and real-time web applications.
What Sets Techmindz Apart?
Located at the heart of Kochi’s IT hub in Infopark, Techmindz offers an industry-oriented Advanced MERN Stack training program tailored for real-world applications. The course is designed by experienced developers and delivered by professionals who understand the current industry needs.
Key Features of the Program:
💡 Hands-On Learning: Real-time projects and code-along sessions.
👨🏫 Expert Mentorship: Learn from experienced full-stack developers.
📈 Career Support: Resume building, mock interviews, and placement assistance.
💼 Corporate Exposure: Training within an active IT ecosystem at Infopark.
📚 Advanced Curriculum: Includes authentication, REST APIs, deployment, and state management with Redux.
Who Can Join?
Whether you're a fresh graduate, a working professional looking to upskill, or a tech enthusiast wanting to build real-world apps, this course is tailored for you. Basic knowledge of HTML, CSS, and JavaScript is recommended, but not mandatory—Techmindz starts from the basics and moves into advanced concepts at a comfortable pace.
Real Projects. Real Skills. Real Growth.
What makes Techmindz’s MERN stack training unique is its project-based approach. Students will build scalable applications from scratch, integrating front-end and back-end systems seamlessly. By the end of the course, you'll not only understand the core of MERN but also deploy full-stack apps on cloud platforms.
Ready to Elevate Your Career?
The tech world values developers who can manage the complete development cycle. With the Advanced MERN Stack Course in Kochi offered by Techmindz, you’re not just learning a stack—you’re building a future-proof career.
📞 Get in touch with Techmindz today and start building the future you deserve.
0 notes
Text
InsightGen AI Services by Appit: Unlock Real-Time Business Intelligence
Redefining Data-Driven Decision Making in the AI Era
In today’s hyperconnected and competitive environment, businesses can no longer rely on static reports or delayed analytics. The need for real-time insights, predictive intelligence, and data democratization is more critical than ever. Enter InsightGen AI Services by Appit—a cutting-edge solution designed to empower organizations with instant, actionable business intelligence powered by artificial intelligence and machine learning.
With InsightGen, Appit is revolutionizing how businesses understand data, forecast outcomes, and make mission-critical decisions—in real time.
What Is InsightGen AI?
InsightGen AI is a next-gen platform developed by Appit that enables businesses to extract deeper, smarter, and faster insights from structured and unstructured data. Unlike traditional BI tools, InsightGen combines AI-driven analytics, real-time data processing, and intuitive visualization dashboards to give decision-makers an always-on, intelligent pulse of their organization.
🧠 Core Capabilities:
Real-time analytics and dashboards
Predictive modeling and forecasting
Natural language query interface (NLQ)
AI-powered anomaly detection
Automated data storytelling and alerts
Integration with ERPs, CRMs, data lakes & cloud platforms
Why InsightGen Matters in 2025 and Beyond
⏱️ Real-Time Decision Making
In a world where trends shift by the minute, InsightGen enables organizations to act on data as it happens, not after it’s too late.
🔮 Predict the Future with Confidence
With built-in ML models, users can accurately forecast sales, churn, demand, and risk, allowing leadership to prepare for future scenarios with data-backed confidence.
🌐 Unify Data Across Sources
From siloed systems to cloud-native environments, InsightGen ingests data from various sources—SAP, Oracle, Salesforce, AWS, Azure, and more—to present a single source of truth.
💬 Ask Questions in Plain English
With Natural Language Query capabilities, even non-technical users can ask questions like "What was our top-selling product last quarter?" and receive instant visual answers.
🔔 Instant Alerts and Automation
InsightGen detects outliers, anomalies, and trends in real-time and sends automated alerts—preventing costly delays and enabling proactive actions.
Use Cases: Driving Intelligence Across Industries
🛒 Retail & eCommerce
Track inventory and sales in real time
Analyze customer buying behavior and personalize offers
Forecast seasonal demand with AI models
🏭 Manufacturing
Monitor production KPIs in real-time
Predict equipment failure using predictive maintenance AI
Optimize supply chain operations and reduce downtime
💼 Financial Services
Real-time fraud detection and transaction monitoring
Investment performance analytics
Compliance tracking and risk forecasting
🧬 Healthcare
Patient data analysis and treatment outcome prediction
Hospital resource planning and optimization
Monitor patient flow and emergency response trends
🎓 Education
Analyze student performance and dropout risks
Real-time reporting on admissions and operations
Personalized learning analytics for better outcomes
Security, Scalability, and Compliance
Appit designed InsightGen AI with enterprise-grade architecture, offering:
🔐 Role-based access control and end-to-end encryption
☁️ Cloud, on-prem, and hybrid deployment options
📊 Support for GDPR, HIPAA, CCPA, and other data regulations
⚙️ Auto-scaling and high availability infrastructure
InsightGen ensures that your data is safe, compliant, and available—always.
The Technology Behind InsightGen AI
InsightGen is built using a powerful technology stack including:
AI/ML Engines: TensorFlow, PyTorch, Scikit-learn
Data Platforms: Apache Kafka, Snowflake, Google BigQuery, Redshift
Visualization Tools: Custom dashboards, embedded BI, Power BI integration
Integration APIs: RESTful services, JSON, XML, Webhooks
AI Assistants: Integrated chat support for querying reports and insights
Case Study: Fortune 500 Firm Unlocks $12M in Cost Savings
Client: Global logistics and warehousing company Challenge: Disconnected data systems, slow insights, reactive decision-making Solution: Appit deployed InsightGen AI with real-time inventory tracking, predictive maintenance alerts, and automated KPI reporting. Results:
📉 $12M saved in operational inefficiencies
📊 65% faster decision cycles
🔄 90% automation of manual reporting
📈 40% improvement in customer SLA compliance
Getting Started with InsightGen AI Services
Whether you're a mid-sized enterprise or a Fortune 1000 company, InsightGen is scalable to meet your analytics maturity level. Appit offers end-to-end support from:
Data strategy and planning
Deployment and integration
Custom dashboard design
AI model training and tuning
Ongoing analytics support and optimization
Why Choose Appit for AI-Powered Business Intelligence?
✅ Decade-long expertise in enterprise software and AI
✅ Tailored analytics solutions for multiple industries
✅ Fast deployment with low-code/no-code customization options
✅ 24/7 support and continuous model refinement
✅ Trusted by leading organizations worldwide
With InsightGen AI, you’re not just collecting data—you’re unlocking real-time, business-changing intelligence.
The Future Is Now: Make Smarter Decisions with InsightGen
In 2025, businesses that react fast, predict accurately, and personalize effectively will win. InsightGen AI by Appit delivers the intelligence layer your enterprise needs to stay ahead of the curve.
Don’t let your data gather dust. Activate it. Understand it. Act on it.
0 notes
Text
How Coding Brushup Prepares You for Job-Ready Skills with Hands-On Industrial Training
In the fast-paced tech industry, having a degree is no longer enough to land a top job. Employers are now looking for professionals who are job-ready—individuals who can hit the ground running from day one. This is where Coding Brushup comes in. Through its job-oriented industrial training courses, Coding Brushup equips aspiring tech professionals with real-world skills that are in high demand across the industry.

Let’s explore how Coding Brushup’s hands-on training model ensures that students gain practical knowledge, build confidence, and become competitive candidates in the job market.
Bridging the Gap Between Education and Employment
Many traditional education systems focus heavily on theory and outdated curricula. This often leaves graduates unprepared for real-world challenges. Coding Brushup’s job-oriented industrial training course is specifically designed to address this gap by aligning with current industry standards and hiring expectations.
Unlike conventional classroom settings, Coding Brushup’s programs are structured to simulate real-world environments. Students are placed in project-based learning modules that teach them how to work in agile teams, solve complex problems, and deliver solutions that mirror real-world demands.
Why Job-Oriented Industrial Training Matters
The tech job market is highly competitive, especially in the United States. Whether you’re a college student, a recent graduate, or a career switcher, having hands-on experience is what truly makes a difference. A job-oriented industrial training course is a fast-track path to mastering tools, technologies, and workflows used by modern tech companies.
Coding Brushup integrates:
Practical coding assignments
Industry-specific projects
Soft skills training
Career mentorship
All of these components help learners develop job-ready skills that employers actively seek in today’s dynamic work environment.
Hands-On Training That Simulates the Workplace
At the heart of Coding Brushup’s approach is hands-on training. Students don’t just learn how to write code—they build actual applications, deploy websites, analyze data sets, and participate in collaborative development environments.
Key features of the hands-on training model include:
Live project work: Build apps and software used in real-world scenarios.
Code reviews: Learn to write clean, efficient, and scalable code.
Agile methodology: Work in sprints and scrums to simulate tech team workflows.
Version control systems: Get proficient with Git, GitHub, and CI/CD pipelines.
This level of immersion helps students develop not just technical expertise, but also the collaborative and critical thinking skills needed in the tech industry.
Real-Time Projects That Enhance Employability
One of the standout features of Coding Brushup’s job-oriented industrial training course is the opportunity to work on real-time projects. These are not academic exercises—they are complex, industry-simulated tasks that closely mimic what professionals face in their daily work.
Examples include:
Developing an e-commerce platform with payment integration
Creating a data visualization dashboard using Python and Power BI
Designing and launching mobile applications on Android/iOS
Building and deploying RESTful APIs for modern web apps
Such projects allow learners to build a strong portfolio that demonstrates their ability to deliver tangible results, which significantly increases their chances of landing interviews and job offers.
Customized Learning Paths for Different Tech Careers
Coding Brushup understands that one size doesn’t fit all. That’s why its job-oriented industrial training courses are tailored for various career paths, including:
Full-stack development
Data science and analytics
Cybersecurity
Mobile app development
Software testing and automation
Each course is structured with progressive modules that start from foundational concepts and advance to specialized topics, ensuring that students receive a comprehensive and personalized learning experience.
Career Services and Job Support
The support doesn’t end with training. Coding Brushup also offers career development services that help students transition from training to employment.
Career support includes:
Resume and LinkedIn optimization
Technical interview preparation
Mock interviews and live feedback
Job placement assistance and referrals
These services are designed to give students the tools they need to navigate the job market with confidence and professionalism. The result? Graduates who are not only job-ready but highly marketable.
Built by Experts, Trusted by Industry
All courses at Coding Brushup are designed and led by industry professionals who bring years of hands-on experience. The curriculum is constantly updated based on current market needs and emerging technologies.
What sets Coding Brushup apart is its commitment to staying relevant. Technologies like React, Node.js, AWS, Docker, Python, and SQL are covered in depth, ensuring students graduate with skills that match what U.S.-based companies are actually using.
Designed for the U.S. Job Market Relevance
Coding Brushup’s job-oriented industrial training course is designed with the U.S. job market in mind. From the tools and technologies taught to the communication and team management practices embedded in the training, every aspect prepares students to succeed in an American workplace setting.
Training programs also incorporate:
Business communication workshops
U.S. job interview etiquette and best practices
Understanding workplace diversity and culture
This ensures that learners are not only technically equipped but also culturally competent, which is critical in multinational and U.S.-based tech companies.
Affordable, Flexible, and Results-Driven
One of the greatest benefits of enrolling in a Coding Brushup program is its affordable pricing and flexible schedule. Whether you're working part-time, studying, or balancing other responsibilities, you can choose from full-time, part-time, and self-paced formats.
Combined with high ROI in terms of employability, Coding Brushup delivers exceptional value for aspiring tech professionals looking to enter the U.S. job market.
Final Thoughts
Becoming job-ready in the tech industry requires more than just classroom knowledge. It demands real experience, practical skills, and the confidence to deliver in fast-paced environments. With its job-oriented industrial training courses, hands-on learning approach, and dedicated career support, Coding Brushup is helping thousands of learners bridge the gap between education and employment.
If you're looking to build a successful tech career, gain job-ready skills, and stand out to U.S. employers, now is the time to start your journey with a training program built for results.
#job-oriented industrial training courses#coding brushup#coding brushup for python#coding brushup for java programming
0 notes
Text
[SimplePBI] Get tablas, medidas, columnas o roles de un modelo con código Python
Al día de hoy PowerBi esta instaurado masivamente. Ya lo usan muchísimas empresas y la cantidad de modelos e informes deployados es enorme. Esto hace que los desafíos de hoy, ya no sean los de antes.
Antes había más concentración en la comunidad por aprender PowerBi tips, buscar como armar una característica puntual de experiencia de usuario. Esto se daba porque eran los primeros informes de muchas empresas. Hoy nos toca entender informes ya implementados por otras personas o empresas. ¿Cómo entender que hay detrás de un modelo semántico publicado? El nuevo update/release de la librería de Python, SimplePBI, para leer la PowerBi Rest API puede ayudarnos a obtener información de tablas, medidas, columnas y hasta roles que existen en el modelo.
Cuando necesitamos editar, dar soporte y comprender algún modelo semántico en producción. Puede ser un gran desafío si no contamos con las prácticas adecuadas de versionado. Si necesitamos entender rápidamente sobre un linaje fino (tabla) del origen y no tenemos un catálogo de gobernanza apropiado hay un inconveniente.
Para estas situaciones y muchísimas más, SimplePBI incorporó la posibilidad de preguntar fácilmente con código python por información de un modelo semántico. ¿Qué podemos consultar?
Tablas: datos de las tablas del modelo.
Medidas: todas las medidas del modelo, sus expresiones y a que tabla pertencen.
Columns datos de las columnas del modelo y a que tabla pertenecen.
Roles: datos de roles de RLS creados en el modelo.
Veamos que simple que es consultar el modelo.
Pre requisitos
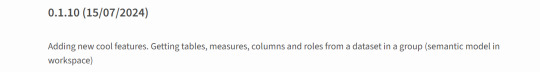
Lo primero que necesitamos es conocer como se utiliza la PowerBi Rest API, para ello podes dar tus primeros pasos con este artículo. Lo segundo es asegurarnos que tenemos una versión 0.1.10 o superior de la librería:
Si ya tenian la librería pueden correr en consola:
pip install SimplePBI --upgrade
Obtener información del modelo
A partir de ese momento podremos consultar un modelo semántico o conjunto de datos de un área de trabajo puntual.
Autenticamos y generamos un token:
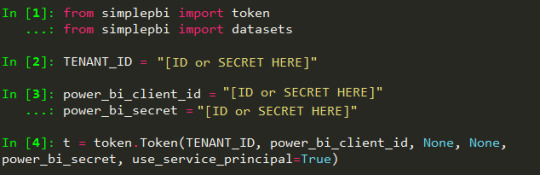
Creamos el objeto de la categoría que nos gustaría ejecutar. En este caso datasets hace referencia a modelos semánticos:
d = datasets.Dataset(t.token)
Aún siendo desarrollo propio de la librería, los métodos a ejecutar tienen nombre amigables muy similares a los que ya existían en la documentación de la API:
get_tables_from_dataset_in_group
get_measures_from_dataset_in_group
get_columns_from_dataset_in_group
get_tables_from_dataset_in_group
Podemos obtener el id de área de trabajo y del modelo semántico desde la URL del navegador cuando abrimos el modelo. Se ve así:
https://app.powerbi.com/groups/[Workspace ID]/datasets/[Dataset ID]/details?experience=power-bi
Así ejecutaríamos las medidas:

Como podemos apreciar, es una simple linea que trae toda la información. Cada item de la lista de rows en el diccionario de respuesta tiene una medida. En este caso podemos ver tres medidas de la tabla "MEDIDAS". Entre los datos de mayor interes vemos su nombre, tipo de datos y expresión.
Espero que esto los ayude a investigar más sobre modelos deployados para aprender en caso de dar soporte, mejorar nuestras estructuras de catálogos o revisar rápidamente expresiones de medidas. El uso en definitiva tiene como límite su creatividad.
#powerbi#power bi#power bi tips#power bi tutorial#power bi training#power bi service#power bi rest api#python#simplepbi#ladataweb#power bi argentina#power bi jujuy#power bi cordoba
1 note
·
View note
Text
Top 10 AI Tools for Embedded Analytics and Reporting (May 2025)
New Post has been published on https://thedigitalinsider.com/top-10-ai-tools-for-embedded-analytics-and-reporting-may-2025/
Top 10 AI Tools for Embedded Analytics and Reporting (May 2025)
Embedded analytics refers to integrating interactive dashboards, reports, and AI-driven data insights directly into applications or workflows. This approach lets users access analytics in context without switching to a separate BI tool. It’s a rapidly growing market – valued around $20 billion in 2024 and projected to reach $75 billion by 2032 (18% CAGR).
Organizations are embracing embedded analytics to empower end-users with real-time information. These trends are fueled by demand for self-service data access and AI features like natural language queries and automated insights, which make analytics more accessible.
Below we review top tools that provide AI-powered embedded analytics and reporting. Each tool includes an overview, key pros and cons, and a breakdown of pricing tiers.
AI Tools for Embedded Analytics and Reporting (Comparison Table)
AI Tool Best For Price Features Explo Turnkey, white-label SaaS dashboards Free internal · embed from $795/mo No-code builder, Explo AI NLQ, SOC 2/HIPAA ThoughtSpot Google-style NL search for data in apps Dev trial free · usage-based quote SpotIQ AI insights, search & Liveboards embed Tableau Embedded Pixel-perfect visuals & broad connectors $12–70/user/mo Pulse AI summaries, drag-drop viz, JS API Power BI Embedded Azure-centric, cost-efficient scaling A1 capacity from ~$735/mo NL Q&A, AutoML visuals, REST/JS SDK Looker Governed metrics & Google Cloud synergy Custom (≈$120k+/yr) LookML model, secure embed SDK, BigQuery native Sisense OEMs needing deep white-label control Starter ≈$10k/yr · Cloud ≈$21k/yr ElastiCube in-chip, NLQ, full REST/JS APIs Qlik Associative, real-time data exploration $200–2,750/mo (capacity-based) Associative engine, Insight Advisor AI, Nebula.js Domo Everywhere Cloud BI with built-in ETL & sharing From ~$3k/mo (quote) 500+ connectors, alerts, credit-based scaling Yellowfin BI Data storytelling & flexible OEM pricing Custom (≈$15k+/yr) Stories, Signals AI alerts, multi-tenant Mode Analytics SQL/Python notebooks to embedded reports Free · Pro ≈$6k/yr Notebooks, API embed, Visual Explorer
(Source: Explo)
Explo is an embedded analytics platform designed for product and engineering teams to quickly add customer-facing dashboards and reports to their apps. It offers a no-code interface for creating interactive charts and supports white-labeled embedding, so the analytics blend into your product’s UI.
Explo focuses on self-service: end-users can explore data and even build ad hoc reports without needing developer intervention. A standout feature is Explo AI, a generative AI capability that lets users ask free-form questions and get back relevant charts automatically.
This makes data exploration as easy as typing a query in natural language. Explo integrates with many databases and is built to scale from startup use cases to enterprise deployments (it’s SOC II, GDPR, and HIPAA compliant for security).
Pros and Cons
Drag-and-drop dashboards—embed in minutes
Generative AI (Explo AI) for NLQ insights
Full white-label + SOC 2 / HIPAA compliance
Young platform; smaller community
Costs rise with large end-user counts
Cloud-only; no on-prem deployment
Pricing: (Monthly subscriptions – USD)
Launch – Free: Internal BI use only; unlimited internal users/dashboards.
Growth – from $795/month: For embedding in apps; includes 3 embedded dashboards, 25 customer accounts.
Pro – from $2,195/month: Advanced embedding; unlimited dashboards, full white-label, scales with usage.
Enterprise – Custom: Custom pricing for large scale deployments; includes priority support, SSO, custom features.
Visit Explo →
ThoughtSpot is an AI-driven analytics platform renowned for its search-based interface. With ThoughtSpot’s embedded analytics, users can type natural language queries (or use voice) to explore data and instantly get visual answers.
This makes analytics accessible to non-technical users – essentially a Google-like experience for your business data. ThoughtSpot’s in-memory engine handles large data volumes, and its AI engine (SpotIQ) automatically finds insights and anomalies.
For embedding, ThoughtSpot provides low-code components and robust REST APIs/SDKs to integrate interactive Liveboards (dashboards) or even just the search bar into applications. It’s popular for customer-facing analytics in apps where end-users need ad-hoc querying ability.
Businesses in retail, finance, and healthcare use ThoughtSpot to let frontline employees and customers ask data questions on the fly. The platform emphasizes ease-of-use and fast deployment, though it also offers enterprise features like row-level security and scalability across cloud data warehouses.
Pros and Cons
Google-style NL search for data
SpotIQ AI auto-surfaces trends
Embeds dashboards, charts, or just the search bar
Enterprise-grade pricing for SMBs
Limited advanced data modeling
Setup needs schema indexing expertise
Pricing: (Tiered, with consumption-based licensing – USD)
Essentials – $1,250/month (billed annually): For larger deployments; increased data capacity and features.
ThoughtSpot Pro: Custom quote. Full embedding capabilities for customer-facing apps (up to ~500 million data rows).
ThoughtSpot Enterprise: Custom quote. Unlimited data scale and enterprise SLA. Includes multi-tenant support, advanced security, etc.
Visit ThoughtSpot →
Tableau (part of Salesforce) is a leading BI platform known for its powerful visualization and dashboarding capabilities. Tableau Embedded Analytics allows organizations to integrate Tableau’s interactive charts and reports into their own applications or websites.
Developers can embed Tableau dashboards via iFrames or using the JavaScript API, enabling rich data visuals and filtering in-app. Tableau’s strength lies in its breadth of out-of-the-box visuals, drag-and-drop ease for creating dashboards, and a large user community.
It also has introduced AI features – for example, in 2024 Salesforce announced Tableau Pulse, which uses generative AI to deliver automated insights and natural language summaries to users. This augments embedded dashboards with proactive explanations.
Tableau works with a wide range of data sources and offers live or in-memory data connectivity, ensuring that embedded content can display up-to-date info. It’s well-suited for both internal embedded use (e.g. within an enterprise portal) and external customer-facing analytics, though licensing cost and infrastructure must be planned accordingly.
Pros and Cons
Market-leading visual library
New “Pulse” AI summaries & NLQ
Broad data connectors + massive community
License cost balloons at scale
Requires Tableau Server/Cloud infrastructure
Styling customization via JS API only
Pricing: (Subscription per user, with role-based tiers – USD)
Creator – $70 per user/month: Full authoring license (data prep, dashboard creation). Needed for developers building embedded dashboards.
Explorer – $35 per user/month: For users who explore and edit limited content. Suitable for internal power users interacting with embedded reports.
Viewer – $12 per user/month: Read-only access to view dashboards. For end viewers of embedded analytics.
Visit Tableau →
Microsoft Power BI is a widely-used BI suite, and Power BI Embedded refers to the Azure service and APIs that let you embed Power BI visuals into custom applications. This is attractive for developers building customer-facing analytics, as it combines Power BI’s robust features (interactive reports, AI visuals, natural language Q&A, etc.) with flexible embedding options.
You can embed full reports or individual tiles, control them via REST API, and apply row-level security for multi-tenant scenarios. Power BI’s strengths include tight integration with the Microsoft ecosystem (Azure, Office 365), strong data modeling (via Power BI Desktop), and growing AI capabilities (e.g. the Q&A visual that allows users to ask questions in plain English).
Pros and Cons
Rich BI + AI visuals (NL Q&A, AutoML)
Azure capacity pricing scales to any user base
Deep Microsoft ecosystem integration
Initial setup can be complex (capacities, RLS)
Devs need Power BI Pro licenses
Some portal features absent in embeds
Pricing: (Azure capacity-based or per-user – USD)
Power BI Pro – $14/user/month: Enables creating and sharing reports. Required for developers and any internal users of embedded content.
Power BI Premium Per User – $24/user/month: Enhanced features (AI, larger datasets) on a per-user basis. Useful if a small number of users need premium capabilities instead of a full capacity.
Power BI Embedded (A SKUs) – From ~$735/month for A1 capacity (3 GB RAM, 1 v-core). Scales up to ~$23,500/month for A6 (100 GB, 32 cores) for high-end needs. Billed hourly via Azure, with scale-out options.
Visit Power BI →
Looker is a modern analytics platform now part of Google Cloud. It is known for its unique data modeling layer, LookML, which lets data teams define business metrics and logic centrally.
For embedded analytics, Looker provides a robust solution: you can embed interactive dashboards or exploratory data tables in applications, leveraging the same Looker backend. One of Looker’s core strengths is consistency – because of LookML, all users (and embedded views) use trusted data definitions, avoiding mismatched metrics.
Looker also excels at integrations: it connects natively to cloud databases (BigQuery, Snowflake, etc.), and because it’s in the Google ecosystem, it integrates with Google Cloud services (permissions, AI/ML via BigQuery, etc.).
Pros and Cons
LookML enforces single source of truth
Secure embed SDK + full theming
Tight BigQuery & Google AI integration
Premium six-figure pricing common
Steep LookML learning curve
Visuals less flashy than Tableau/Power BI
Pricing: (Custom quotes via sales; example figures)
Visit Looker →
Sisense is a full-stack BI and analytics platform with a strong focus on embedded analytics use cases. It enables companies to infuse analytics into their products via flexible APIs or web components, and even allows building custom analytic apps.
Sisense is known for its ElastiCube in-chip memory technology, which can mash up data from multiple sources and deliver fast performance for dashboards. In recent years, Sisense has incorporated AI features (e.g. NLQ, automated insights) to stay competitive.
A key advantage of Sisense is its ability to be fully white-labeled and its OEM-friendly licensing, which is why many SaaS providers choose it to power their in-app analytics. It offers both cloud and on-premises deployment options, catering to different security requirements.
Sisense also provides a range of customization options: you can embed entire dashboards or individual widgets, and use their JavaScript library to deeply customize look and feel. It’s suited for organizations that need an end-to-end solution – from data preparation to visualization – specifically tailored for embedding in external applications.
Pros and Cons
ElastiCube fuses data fast in-memory
White-label OEM-friendly APIs
AI alerts & NLQ for end-users
UI learning curve for new users
Quote-based pricing can be steep
Advanced setup often needs dev resources
Pricing: (Annual license, quote-based – USD)
Starter (Self-Hosted) – Starts around $10,000/year for a small deployment (few users, basic features). This would typically be an on-prem license for internal BI or limited OEM use.
Cloud (SaaS) Starter – ~$21,000/year for ~5 users on Sisense Cloud (cloud hosting carries ~2× premium over self-host).
Growth/Enterprise OEM – Costs scale significantly with usage; mid-range deployments often range $50K-$100K+ per year. Large enterprise deals can reach several hundred thousand or more if there are very high numbers of end-users.
Visit Sisense →
Qlik is a long-time leader in BI, offering Qlik Sense as its modern analytics platform. Qlik’s embedded analytics capabilities allow you to integrate its associative data engine and rich visuals into other applications.
Qlik’s differentiator is its Associative Engine: users can freely explore data associations (making selections across any fields) and the engine instantly updates all charts to reflect those selections, revealing hidden insights.
In an embedded scenario, this means end-users can get powerful interactive exploration, not just static filtered views. Qlik provides APIs (Capability API, Nebula.js library, etc.) to embed charts or even build fully custom analytics experiences on top of its engine. It also supports standard embed via iframes or mashups.
Qlik has incorporated AI as well – the Insight Advisor can generate insights or chart suggestions automatically. For developers, Qlik’s platform is quite robust: you can script data transformations in its load script, use its security rules for multi-tenant setups, and even embed Qlik into mobile apps.
Pros and Cons
Associative engine enables free exploration
Fast in-memory performance for big data
Robust APIs + Insight Advisor AI
Unique scripting → higher learning curve
Enterprise-level pricing
UI can feel dated without theming
Pricing: (USD)
Starter – $200 / month (billed annually): Includes 10 users + 25 GB “data for analysis.” No extra data add-ons available.
Standard – $825 / month: Starts with 25 GB; buy more capacity in 25 GB blocks. Unlimited user access.
Premium – $2,750 / month: Starts with 50 GB, adds AI/ML, public/anonymous access, larger app sizes (10 GB).
Enterprise – Custom quote: Begins at 250 GB; supports larger app sizes (up to 40 GB), multi-region tenants, expanded AI/automation quotas.
Visit Qlik →
Domo is a cloud-first business intelligence platform, and Domo Everywhere is its embedded analytics solution aimed at sharing Domo’s dashboards outside the core Domo environment. With Domo Everywhere, companies can distribute interactive dashboards to customers or partners via embed codes or public links, while still managing everything from the central Domo instance.
Domo is known for its end-to-end capabilities in the cloud – from data integration (500+ connectors, built-in ETL called Magic ETL) to data visualization and even a built-in data science layer.
For embedding, Domo emphasizes ease of use: non-technical users can create dashboards in Domo’s drag-and-drop interface, then simply embed them with minimal coding. It also offers robust governance so you can control what external viewers see.
Pros and Cons
End-to-end cloud BI with 500+ connectors
Simple drag-and-embed workflow
Real-time alerts & collaboration tools
Credit-based pricing tricky to budget
Cloud-only; no on-prem option
Deeper custom UI needs dev work
Pricing: (Subscription, contact Domo for quote – USD)
Basic Embedded Package – roughly $3,000 per month for a limited-user, limited-data scenario. This might include a handful of dashboards and a moderate number of external viewers.
Mid-size Deployment – approximately $20k–$50k per year for mid-sized businesses. This would cover more users and data; e.g., a few hundred external users with regular usage.
Enterprise – $100k+/year for large-scale deployments. Enterprises with thousands of external users or very high data volumes can expect costs in six figures. (Domo often structures enterprise deals as unlimited-user but metered by data/query credits.)
Visit Domo →
Yellowfin is a BI platform that has carved a niche in embedded analytics and data storytelling. It offers a cohesive solution with modules for dashboards, data discovery, automated signals (alerts on changes), and even a unique Story feature for narrative reporting.
For embedding, Yellowfin Embedded Analytics provides OEM partners a flexible licensing model and technical capabilities to integrate Yellowfin content into their applications. Yellowfin’s strength lies in its balanced focus: it’s powerful enough for enterprise BI but also streamlined for embedding, with features like multi-tenant support and white-labeling.
It also has NLP query (natural language querying) and AI-driven insights, aligning with modern trends. A notable feature is Yellowfin’s data storytelling – you can create slide-show style narratives with charts and text, which can be embedded to give end-users contextual analysis, not just raw dashboards.
Yellowfin is often praised for its collaborative features (annotations, discussion threads on charts) which can be beneficial in an embedded context where you want users to engage with the analytics.
Pros and Cons
Built-in Stories & Signals for narratives
OEM pricing adaptable (fixed or revenue-share)
Multi-tenant + full white-label support
Lower brand recognition vs. “big three”
Some UI elements feel legacy
Advanced features require training
Pricing: (Custom – Yellowfin offers flexible models)
Visit Yellowfin →
Mode is a platform geared towards advanced analysts and data scientists, combining BI with notebooks. It’s now part of ThoughtSpot (acquired in 2023) but still offered as a standalone solution.
Mode’s appeal in an embedded context is its flexibility: analysts can use SQL, Python, and R in one environment to craft analyses, then publish interactive visualizations or dashboards that can be embedded into web apps. This means if your application’s analytics require heavy custom analysis or statistical work, Mode is well-suited.
It has a modern HTML5 dashboarding system and recently introduced “Visual Explorer” for drag-and-drop charting, plus AI assist features for query suggestions. Companies often use Mode to build rich, bespoke analytics for their customers – for example, a software company might use Mode to develop a complex report, and then embed that report in their product for each customer with the data filtered appropriately.
Mode supports white-label embedding, and you can control it via their API (to provision users, run queries, etc.). It’s popular with data teams due to the seamless workflow from coding to sharing insights.
Pros and Cons
Unified SQL, Python, R notebooks → dashboards
Strong API for automated embedding
Generous free tier for prototyping
Analyst skills (SQL/Python) required
Fewer NLQ/AI features for end-users
Visualization options less extensive than Tableau
Pricing: (USD)
Studio (Free) – $0 forever for up to 3 users. This includes core SQL/Python/R analytics, private data connections, 10MB query limit, etc. Good for initial development and testing of embedded ideas.
Pro (Business) – Starts around ~$6,000/year (estimated). Mode doesn’t list fixed prices, but third-party sources indicate pro plans in the mid four-figure range annually for small teams.
Enterprise – Custom pricing, typically five-figure annually up to ~$50k for large orgs. Includes all Pro features plus enterprise security (SSO, advanced permissions), custom compute for heavy workloads, and premium support.
Visit Mode →
How to Choose the Right Embedded Analytics Tool
Selecting an embedded analytics solution requires balancing your company’s needs with each tool’s strengths. Start with your use case and audience: Consider who will be using the analytics and their technical level. If you’re embedding dashboards for non-technical business users or customers, a tool with an easy UI could be important. Conversely, if your application demands highly custom analyses or you have a strong data science team, a more flexible code-first tool might be better.
Also evaluate whether you need a fully managed solution (more plug-and-play, e.g. Explo or Domo) or are willing to manage more infrastructure for a potentially more powerful platform (e.g. self-hosting Qlik or Sisense for complete control). The size of your company (and engineering resources) will influence this trade-off – startups often lean towards turnkey cloud services, while larger enterprises might integrate a platform into their existing tech stack.
Integration and scalability are critical factors. Look at how well the tool will integrate with your current systems and future architecture. Finally, weigh pricing and total cost of ownership against your budget and revenue model. Embedded analytics tools vary from per-user pricing to usage-based and fixed OEM licenses. Map out a rough projection of costs for 1 year and 3 years as your user count grows.
FAQs (Embedded Analytics and Reporting)
1. What are the main differences between Tableau and Power BI?
Tableau focuses on advanced visual design, cross-platform deployment (on-prem or any cloud), and a large viz library, but it costs more per user. Power BI is cheaper, tightly integrated with Microsoft 365/Azure, and great for Excel users, though some features require an Azure capacity and Windows-centric stack.
2. How does Sisense handle large datasets compared to other tools?
Sisense’s proprietary ElastiCube “in-chip” engine compresses data in memory, letting a single node serve millions of rows while maintaining fast query response; benchmarks show 500 GB cubes on 128 GB RAM. Competing BI tools often rely on external warehouses or slower in-memory engines for similar workloads.
3. Which embedded analytics tool offers the best customization options?
Sisense and Qlik are stand-outs: both expose full REST/JavaScript APIs, support deep white-labeling, and let dev teams build bespoke visual components or mashups—ideal when you need analytics to look and feel 100 % native in your app.
4. Are there any free alternatives to Tableau and Sisense?
Yes—open-source BI platforms like Apache Superset, Metabase, Redash, and Google’s free Looker Studio deliver dashboarding and basic embedded options at zero cost (self-hosted or SaaS tiers), making them good entry-level substitutes for smaller teams or tight budgets.
#000#2023#2024#2025#250#Accounts#ADD#ai#ai tools#AI-powered#AI/ML#alerts#amp#analyses#Analysis#Analytics#anomalies#Apache#API#APIs#app#applications#approach#apps#architecture#automation#autoML#azure#benchmarks#Best Of
0 notes
Text
Modern API Design Patterns for Custom Applications

In today’s fast-paced digital ecosystem, building scalable, maintainable, and efficient applications is more crucial than ever. Custom software developers play a vital role in this transformation by leveraging robust API design patterns to ensure seamless communication between services, apps, and systems. APIs are no longer just bridges between applications—they are core components of modern software architectures, especially for businesses looking to offer highly tailored solutions.
Let’s explore some of the most impactful API design patterns that are shaping how custom applications are being developed in 2025.
1. RESTful API: Still the Foundation
Although not exactly new, RESTful APIs continue to be a cornerstone in modern API architecture. They offer a straightforward approach to resource management using HTTP methods. The stateless nature of REST makes it ideal for scalable, modular application development.
Custom applications—whether web platforms or mobile solutions—rely heavily on REST for simplicity and broad compatibility. By adhering to REST principles, developers ensure that applications remain loosely coupled and easy to maintain or scale.
2. GraphQL: The Flexible Alternative
For applications requiring complex data fetching with minimal overhead, GraphQL has emerged as a powerful alternative to REST. Unlike REST, which requires multiple endpoints for different resources, GraphQL uses a single endpoint and allows clients to request exactly the data they need.
This precision is extremely valuable for frontend-heavy applications, such as SPAs (Single Page Applications) or mobile apps with bandwidth constraints. Custom software developers often use GraphQL to improve performance, reduce latency, and enhance the client experience.
3. gRPC: High-Performance Communication
Google’s gRPC is ideal for internal service-to-service communication. It’s especially useful in microservices architectures where speed and efficiency are critical. gRPC uses Protocol Buffers (Protobuf) for serialization, which is much faster than JSON.
gRPC supports bi-directional streaming and strong typing, which is great for building real-time applications like messaging platforms, live dashboards, or financial trading systems. For developers building custom enterprise systems, gRPC offers both speed and type safety.
4. API Gateway Pattern
As applications become more complex, managing multiple APIs efficiently becomes essential. That’s where the API Gateway pattern shines. Acting as a single entry point for all client requests, an API gateway handles routing, load balancing, authentication, and even caching.
This pattern simplifies client-side logic and secures backend services. For businesses offering multiple services or products through a single app, an API Gateway ensures smooth and secure communication without exposing internal architecture.
5. Backend for Frontend (BFF)
In multi-platform environments—where different interfaces like web, mobile, and IoT devices consume the same data—a Backend for Frontend (BFF) pattern is especially useful. Instead of one backend serving all clients, each client type has a specialized backend that caters to its unique needs.
This design reduces the complexity of frontend logic and improves performance. For example, a mobile app might need a trimmed-down response compared to the desktop web version. BFF allows for tailored responses without burdening a single backend with all variations.
Mobile App Considerations: Performance Meets Budget
Modern APIs also influence project costs, especially in mobile development. Choosing the right pattern can save time, money, and resources. This is where a mobile app cost calculator comes in handy. It helps estimate the cost implications of different architectural choices and API strategies before writing a single line of code.
If you're planning a mobile app and wondering how your API choices will affect the budget, try out a mobile app cost calculator to make data-driven decisions from day one.
Want to tailor your app’s API strategy for better performance and scalability? Book an Appointment with our experts and get personalized guidance for your project.
6. Event-Driven API Pattern
Real-time and asynchronous systems benefit greatly from event-driven APIs. Instead of waiting for client requests, these APIs push updates when events occur. This is useful for applications like notifications systems, stock tickers, or order tracking platforms.
Event-driven architecture typically uses tools like Kafka or WebSockets and is a powerful choice for building responsive, low-latency systems. It also enhances decoupling between services, improving maintainability and fault tolerance.
7. OpenAPI (Swagger) for Standardization
Standardization through tools like OpenAPI (formerly Swagger) helps ensure consistent API design across large teams. It allows developers to document APIs, generate client SDKs, and even auto-generate test cases.
For businesses relying on teams of custom software developers, OpenAPI fosters better collaboration and faster onboarding by providing a single source of truth for how APIs are structured and behave.
Wrapping Up: Building Future-Proof APIs
As application ecosystems continue to evolve, so too must the APIs that support them. Whether you're building mobile apps, enterprise dashboards, or IoT integrations, the right API design pattern can significantly impact your product’s performance, scalability, and maintainability.
From REST to GraphQL, and from API gateways to event-driven architectures, modern patterns provide flexibility to match a wide range of use cases. Investing in good API design not only enhances the developer experience but also delivers better end-user satisfaction.
If you're considering building or upgrading your digital product, now is the time to embrace these modern API design patterns. They’re not just trends—they're foundational to how applications will be built in the future.
Need help navigating these choices? We offer custom software development services tailored to your business needs. Reach out today and let's bring your vision to life.
0 notes
Text
How to Automate Tableau to Power BI Migration for Faster Results
As businesses continue to evolve, so do their analytics needs. Many organizations are moving from Tableau to Power BI to leverage Microsoft’s broader ecosystem, tighter integration with Office 365, and cost efficiency. But migrating from one powerful BI platform to another isn’t a plug-and-play operation—it requires strategy, tools, and automation to ensure speed and accuracy.
At OfficeSolution, we specialize in streamlining your analytics journey. Here’s how you can automate your Tableau to Power BI migration and accelerate results without losing data integrity or performance.
Why Consider Migration to Power BI?
While Tableau offers rich data visualization capabilities, Power BI brings a robust suite of benefits, especially for organizations already embedded in Microsoft’s ecosystem. These include:
Seamless integration with Azure, Excel, and SharePoint
Scalable data models using DAX
Lower licensing costs
Embedded AI and natural language querying
Migrating doesn’t mean starting from scratch. With the right automation approach, your dashboards, data models, and business logic can be transitioned efficiently.
Step 1: Inventory and Assessment
Before automating anything, conduct a full inventory of your Tableau assets:
Dashboards and worksheets
Data sources and connectors
Calculated fields and filters
User roles and access permissions
This phase helps prioritize which dashboards to migrate first and which ones need redesigning due to functional differences between Tableau and Power BI.
Step 2: Use Automation Tools for Conversion
There are now tools and scripts that can partially automate the migration process. While full one-to-one conversion isn’t always possible due to the structural differences, automation can significantly cut manual effort:
Tableau to Power BI Converter Tools: Emerging tools can read Tableau workbook (TWB/TWBX) files and extract metadata, data sources, and layout designs.
Custom Python Scripts: Developers can use Tableau’s REST API and Power BI’s PowerShell modules or REST API to programmatically extract data and push it into Power BI.
ETL Automation Platforms: If your Tableau dashboards use SQL-based data sources, tools like Azure Data Factory or Talend can automate data migration and transformation to match Power BI requirements.
At OfficeSolution, we’ve developed proprietary scripts that map Tableau calculations to DAX and automate the bulk of the report structure transformation.
Step 3: Validate and Optimize
After automation, a manual review is crucial. Even the best tools require human oversight to:
Rebuild advanced visualizations
Validate data integrity and filters
Optimize performance using Power BI best practices
Align with governance and compliance standards
Our team uses a rigorous QA checklist to ensure everything in Power BI mirrors the original Tableau experience—or improves upon it.
Step 4: Train and Transition Users
The success of any migration depends on end-user adoption. Power BI offers a different interface and experience. Conduct hands-on training sessions, create Power BI templates for common use cases, and provide support as users transition.
Conclusion
Automating Tableau to Power BI migration isn’t just about saving time—it’s about ensuring accuracy, scalability, and business continuity. With the right combination of tools, scripting, and expertise, you can accelerate your analytics modernization with confidence.
At OfficeSolution, we help enterprises unlock the full value of Power BI through intelligent migration and ongoing support. Ready to upgrade your analytics stack? Let’s talk.
0 notes
Text
Interactive Web Application Development

Web development is no longer about just static pages. Users now expect responsive, real-time, and engaging experiences. In this post, we’ll explore how to develop interactive web applications that provide dynamic content and respond to user input instantly.
What is an Interactive Web Application?
An interactive web app is a website that responds to user actions in real time without needing to reload the entire page. Examples include:
Live chats
Form validations
Dynamic dashboards
Online games and quizzes
Social media feeds and comment systems
Key Technologies for Interactivity
HTML & CSS: Structure and style your app.
JavaScript: The core language for interactivity.
Frontend Frameworks: React, Vue.js, or Angular for building dynamic UIs.
AJAX & Fetch API: Load data without page reloads.
WebSockets: Real-time communication (e.g., chat apps, live notifications).
Backend Technologies: Node.js, Python, Ruby, or PHP for handling logic and databases.
Databases: MySQL, MongoDB, Firebase for storing and retrieving data.
1. Plan Your Application
Start by mapping out user flows and interactions. Identify:
What actions users will take (e.g., login, click, scroll)
How the app should respond (e.g., show a modal, fetch data)
What data is needed and where it comes from
2. Build a Responsive UI
Use CSS Flexbox or Grid for layout
Make it mobile-friendly with media queries
Add transitions and animations for smoother interactions
3. Add Dynamic Behavior with JavaScript
Use JavaScript or a frontend framework to:
Handle user events like clicks, inputs, and scrolls
Update content without reloading the page
Manipulate the DOM (Document Object Model)
4. Connect to a Backend
Use APIs to send and receive data from the server:
Use fetch() or axios to make HTTP requests
Implement RESTful APIs or GraphQL
Secure endpoints and handle authentication
5. Real-Time Features
For real-time functionality, use:
WebSockets: For bi-directional communication
Firebase Realtime Database or Firestore: For instant data syncing
Pusher or Socket.io: Libraries that simplify real-time integration
6. Test and Optimize
Test responsiveness on different screen sizes
Use tools like Lighthouse or WebPageTest for performance analysis
Minify and bundle JavaScript and CSS for faster loading
7. Deploy Your App
Use services like:
Vercel or Netlify for frontend hosting
Render, Heroku, or Railway for full-stack apps
GitHub Actions for CI/CD automation
Popular Use Cases of Interactive Web Apps
Interactive data dashboards
E-commerce platforms with live product updates
Educational platforms with quizzes and code editors
Project management tools like Trello or Notion
Conclusion
Interactive web applications create engaging and efficient user experiences. With a solid understanding of JavaScript, a powerful frontend framework, and modern backend tools, you can build apps that users love to interact with. Start simple, focus on clean UX, and keep improving your skills!
0 notes
Text
Using Azure Data Factory for Government Data Pipelines

Introduction
Government agencies handle vast amounts of data, ranging from citizen records and tax information to law enforcement and healthcare data. Managing, processing, and integrating such data securely and efficiently is a significant challenge.
Azure Data Factory (ADF) provides a scalable, cloud-based ETL (Extract, Transform, Load) solution that enables government agencies to securely move and transform data while ensuring compliance with regulatory requirements. This blog explores how ADF can be leveraged for government data pipelines, key features, and best practices for secure data processing.
Why Azure Data Factory for Government Data?
1. Compliance with Government Regulations
Government agencies must adhere to strict data security and compliance requirements such as:
FedRAMP (Federal Risk and Authorization Management Program) — Ensuring cloud security for U.S. government agencies
GDPR (General Data Protection Regulation) — Protecting personal data of EU citizens
HIPAA (Health Insurance Portability and Accountability Act) — For handling healthcare data
CJIS (Criminal Justice Information Services) Compliance — Data protection for law enforcement agencies
Azure Data Factory supports compliance by offering role-based access control (RBAC), encryption, audit logging, and private network security to safeguard sensitive government data.
2. Secure and Scalable Data Movement
Government agencies often have hybrid infrastructures with data spread across on-premises servers, legacy systems, and cloud platforms. ADF facilitates seamless data movement and transformation across these environments while maintaining security through:
Self-Hosted Integration Runtimes for secure on-premises data access
Private Link to restrict network exposure
Built-in encryption (both at rest and in transit)
3. Integration with Multiple Data Sources
ADF supports integration with a wide range of structured and unstructured data sources, including:
SQL Server, Oracle, PostgreSQL (On-Premises and Cloud)
Azure Blob Storage, Azure Data Lake Storage
REST APIs, SAP, Salesforce, and more
This flexibility enables government agencies to centralize disparate datasets, ensuring seamless interoperability.
Key Features for Government Data Pipelines
1. Secure Data Integration
ADF enables secure data ingestion from multiple sources while enforcing access policies. Data transformation can be performed within Azure Synapse Analytics, Databricks, or other processing engines, ensuring compliance with government security standards.
2. Data Security & Governance
Managed Private Endpoints — Ensuring data does not traverse the public internet
Azure Policy & RBAC — Controlling who can access and manage data pipelines
Data Masking & Encryption — Protecting personally identifiable information (PII)
3. Automated Workflows & Monitoring
Government agencies require scheduled and event-driven data workflows for regulatory reporting and citizen services. ADF provides:
Triggers and Scheduling for automated ETL workflows
Monitoring & Logging with Azure Monitor for real-time visibility
Alerts & Notifications for pipeline failures
4. Hybrid Connectivity for Legacy Systems
Government organizations often rely on legacy systems that need modernization. ADF allows secure connectivity to on-premises databases and file servers using self-hosted integration runtimes, ensuring smooth data migration and transformation.
Use Cases of ADF in Government Data Processing
1. Citizen Services & Public Portals
Government portals require real-time data processing for services like tax filings, unemployment claims, and benefits distribution. ADF enables:
Data ingestion from APIs and databases for up-to-date citizen information
Data validation and transformation for accurate reporting
Integration with Power BI for visual analytics and dashboards
2. Regulatory Compliance & Auditing
Agencies must comply with data retention, auditing, and security policies. ADF helps:
Automate compliance checks by monitoring data movements
Ensure audit logs are stored securely in Azure Storage or Data Lake
Apply data masking to protect sensitive records
3. Law Enforcement & Security Data Processing
ADF helps police and security agencies manage and analyze large volumes of crime records, surveillance footage, and biometric data by:
Extracting data from multiple sources (CCTV, databases, IoT sensors)
Transforming and analyzing crime patterns using Azure Synapse
Ensuring strict access controls and encryption
4. Healthcare & Public Welfare Data Pipelines
Government healthcare agencies need to process large volumes of patient records, medical claims, and research data. ADF can:
Integrate hospital databases with public health systems
Anonymize sensitive healthcare data for research purposes
Enable real-time processing of pandemic-related data
1. Implement Private Links and Managed Virtual Networks
Use Azure Private Link to connect ADF securely to Azure resources
Set up Managed Virtual Networks to restrict data pipeline access
2. Use Azure Policy for Governance
Enforce RBAC policies to limit data access
Automate compliance monitoring to detect unauthorized data movements
3. Encrypt Data at Rest and in Transit
Utilize Azure Key Vault for managing encryption keys
Enable TLS encryption for all data transmissions
4. Set Up Data Masking & Row-Level Security
Apply dynamic data masking to protect sensitive information
Implement row-level security to restrict access based on user roles
5. Automate Compliance Checks with Azure Monitor
Use Azure Monitor & Log Analytics to track ADF pipeline activities
Set up alerts for anomalies to detect potential security threats
Conclusion
Azure Data Factory provides a powerful solution for secure, scalable, and compliant data pipelines in government agencies. By leveraging ADF’s integration capabilities, security features, and automation tools, agencies can modernize their data workflows while ensuring regulatory compliance.
Adopting Azure Data Factory for government data pipelines can enhance data security, operational efficiency, and citizen services, making data-driven decision-making a reality for public institutions.
WEBSITE: https://www.ficusoft.in/azure-data-factory-training-in-chennai/
0 notes
Text
Essential Skills Required for an Oracle Fusion Financials Consultant.

Oracle Fusion Financials is a powerful cloud-based ERP solution that helps organizations streamline their financial operations. As businesses increasingly migrate to Oracle Fusion Financials, the demand for skilled consultants continues to grow. Whether you are an aspiring consultant or an experienced professional looking to upskill, mastering key competencies is essential for success in this field. In this blog, we will explore the essential skills required for an Oracle Fusion Financials Consultant.
1. Strong Knowledge of Financial Modules
An Oracle Fusion Financials Consultant must have in-depth knowledge of the various financial modules, including:
General Ledger (GL): Managing financial statements and reporting.
Accounts Payable (AP): Handling supplier invoices and payments.
Accounts Receivable (AR): Managing customer invoices and collections.
Fixed Assets (FA): Tracking asset acquisitions and depreciation.
Cash Management (CM): Overseeing bank accounts, cash flow, and reconciliation.
Expense Management (EXM): Managing employee expenses and reimbursements.
2. Understanding of Oracle Cloud Architecture
Oracle Fusion Financials operates in a cloud environment, requiring consultants to understand:
Cloud deployment models (SaaS, PaaS, IaaS)
Oracle Cloud Infrastructure (OCI)
Security and compliance aspects
Integration capabilities with third-party applications
3. Configuration and Implementation Skills
Consultants must be proficient in configuring Oracle Fusion Financials based on business requirements. This includes:
Setting up financial modules
Defining ledgers, chart of accounts, and financial calendars
Implementing financial reporting structures
Configuring tax and payment setups
4. Functional and Technical Expertise
A successful consultant should have both functional and technical expertise:
Functional skills: Understanding business processes, financial best practices, and regulatory compliance.
Technical skills: Familiarity with SQL, BI Publisher, Oracle Integration Cloud (OIC), Web Services, and Fast Formulas for customizing reports and automating tasks.
5. Analytical and Problem-Solving Skills
Oracle Fusion Financials Consultants must be able to analyze complex business problems and provide effective solutions. They should:
Identify and troubleshoot system issues
Optimize financial workflows
Enhance reporting accuracy and efficiency
6. Data Migration and Reporting Knowledge
Migrating financial data from legacy systems to Oracle Fusion Financials is a critical task. Consultants should understand:
Data extraction, transformation, and loading (ETL) processes
Oracle Financial Reporting tools (OTBI, Smart View, FRS, BI Publisher)
Data validation and reconciliation techniques
7. Integration and API Knowledge
Consultants must be proficient in integrating Oracle Fusion Financials with other applications, such as payroll systems, banks, and third-party tax software. Skills in:
REST and SOAP APIs
Oracle Integration Cloud (OIC)
Middleware tools (like MuleSoft and Dell Boomi)
are highly beneficial.
8. Knowledge of Security and Role-Based Access Control (RBAC)
Security is crucial in financial systems. Consultants must understand:
User roles and permissions
Role-Based Access Control (RBAC)
Data security policies and segregation of duties (SoD)
9. Project Management and Communication Skills
Oracle Fusion Financials Consultants work closely with stakeholders, requiring strong project management and communication skills. They should be able to:
Gather and document business requirements
Provide training and support to end-users
Manage project timelines and deliverables
10. Continuous Learning and Certification
The Oracle Fusion Financials landscape is constantly evolving. Staying updated with new features and enhancements is vital. Consultants should:
Obtain Oracle Cloud certifications (e.g., Oracle Financials Cloud: General Ledger 2023 Implementation Professional)
Join Oracle communities and forums
Attend training programs and webinars
Conclusion
Becoming an Oracle Fusion Financials Consultant requires a combination of technical, functional, and soft skills. By mastering financial modules, understanding cloud architecture, developing integration capabilities, and continuously learning, professionals can position themselves as valuable assets in the ERP consulting industry. Investing in Oracle training and certification will further boost career opportunities in this high-demand field.
If you're looking to build a successful career as an Oracle Fusion Financials Consultant, consider enrolling in a structured training program to gain hands-on experience and industry-relevant expertise. To Your bright future join Oracle Fusion Financials.
#jobguarantee#oraclefusion#oraclefusionfinancials#financecareers#financejobs#erptraining#100jobguarantee#hyderabadtraining#erptree#careergrowth
0 notes