#ProcessMapping
Explore tagged Tumblr posts
Visit Tumblr Blog
Explore Tumblr blogs with no restrictions, modern design and the best experience.
Last Seen Tumblr Blogs


Fun Fact
Tumblr posted its first advertisements in May 2012 and subsequently earned $13M in revenue.
Text
Process mapping is a visual representation of a process, outlining each step and decision point from start to finish. It's essentially a flowchart that helps teams understand and improve how work is done. By visualizing the process, organizations can identify bottlenecks, inefficiencies, and areas for improvement.
0 notes
Text
Napkin.ai : Transforming Text into Visuals | futuretiative | Napkin AI
Stop wasting time drawing diagrams! Napkin.ai automates the process, turning your text into professional flowcharts in seconds. See how it can simplify your workflow. #Efficiency #AItools #NapkinAI #ProjectManagement #ProjectManagers #WorkflowOptimization #BusinessTools #ProcessMapping #Agile #Scrum #AItechnology #ArtificialIntelligence #FutureOfWork #TechInnovation #MindBlown #AIArt #DigitalTools #Efficiency #Workflow #ProductivityHacks #AItools #Diagramming #SaveTime #Automation #TechTips
Napkin.ai is a tool that focuses on transforming text into visual representations, primarily flowcharts and diagrams. Here's a summary of its key aspects:
Key Features and Strengths:
Text-to-Visual Conversion:
Its core functionality is the ability to generate flowcharts and other visuals from textual input. This can save users significant time and effort.
It handles various text inputs, from simple lists to detailed descriptions.
User-Friendly Interface:
Users generally find the interface intuitive and easy to use, minimizing the learning curve.
Customization Options:
Napkin.ai offers customization features, allowing users to adjust the appearance of their visuals with colors, styles, and layouts.
Efficiency and Speed:
The tool is praised for its quick processing times, efficiently converting text into visuals.
Collaboration features:
The ability to collaborate on the visuals, with commenting, and real time editing, is a very strong feature.
Limitations and Considerations:
Language Limitations:
Currently, the tool performs best with English text.
Accuracy:
Like all AI tools, it can have some accuracy issues, and it is important to review the generated visual.
Feature limitations:
Some users have stated that it is really a text to template converter, and that it can struggle with more abstract requests.
Development Stage:
As with many AI tools, it is in constant development, so features and abilities are likely to change.
Overall:
Napkin.ai appears to be a valuable tool for individuals and teams who need to create flowcharts and diagrams quickly.
Its ability to automate the conversion of text to visuals can significantly improve productivity.
It is important to remember that it is an AI tool, and that reviewing the output is always important.
In essence, Napkin.ai is a promising tool for simplifying data visualization, particularly for those who need to quickly create flowcharts and diagrams from text.
Visit the napkin.ai website to learn more
Don't forget to like, comment, and subscribe for more AI content!
Napkin.ai, AI flowchart generator, text to flowchart, AI diagram generator, text to diagram, AI visualization tool, automated diagram creation, AI mind map generator, easy flowchart creation, fast diagram creation, productivity tools, workflow optimization, AI tools for business, diagramming software, online flowchart maker, visual communication tools, Napkin.ai review, Napkin.ai tutorial, how to use Napkin.ai, Napkin.ai demo, Napkin.ai alternatives, how to create flowcharts from text with AI, best AI tool for creating diagrams from text, Napkin.ai review for project managers, free AI flowchart generator from text.
#Efficiency#AItools#NapkinAI#ProjectManagement#ProjectManagers#WorkflowOptimization#BusinessTools#ProcessMapping#Agile#Scrum#AItechnology#ArtificialIntelligence#FutureOfWork#TechInnovation#MindBlown#AIArt#DigitalTools#Workflow#ProductivityHacks#Diagramming#SaveTime#Automation#TechTips#innovation#ai#tech#technology#Napkin.ai#AI flowchart generator#text to flowchart
1 note
·
View note
Text
Formatting Your Maps in PowerPoint: Color, Font, and Style Adjustments
Data Visualization: Frequently Asked Inquiries Explained
1.How to create a map legend in PowerPoint?
To create a map legend in PowerPoint, follow these steps:
1. Insert your map slide.
2. Use the "Shapes" tool to create rectangles or circles representing different categories.
3. Label each shape by adding text boxes beside them, detailing what each symbol represents.
4. Customize colors and styles to match your map’s theme.
5. Group the shapes and text boxes together for easy movement.
6. Position the legend in a clear area on the slide for visibility.
Adjust the size and layout as needed to enhance clarity and aesthetics.
2. How do you link a map in PowerPoint?
To link a map in PowerPoint, first, insert the map image or shape into your slide. Then, select the map, go to the "Insert" tab, and click on "Link" or "Hyperlink." Enter the URL of the online map or destination you want to link to. Click "OK" to create the link. Now, when you present, clicking on the map will direct your audience to the linked content. Ensure that your device is connected to the internet for the hyperlink to work.
3. How do I create a process map in PowerPoint?
To create a process map in PowerPoint, follow these steps:
1. Open PowerPoint and select a blank slide.
2. Go to the “Insert” tab and choose “Shapes” to select flowchart shapes (like rectangles, diamonds, and arrows).
3. Draw the shapes on the slide to represent different steps in the process.
4. Use arrows to connect the shapes, indicating the flow of the process.
5. Add text to each shape by clicking inside and typing.
6. Customize colors and styles using the “Format” tab to enhance clarity.
7. Save your work when finished.
4. How do I format a Map in PowerPoint?
To format a map in PowerPoint, first, insert the map by selecting "Insert" > "SmartArt" or "Shapes." If using a built-in map, go to "Insert" > "Map" (available in Office 365). Once added, click on the map to access the "Format" tab. Here, you can customize colors, styles, and effects. Use the "Shape Fill" and "Shape Outline" options to change colors and apply effects like shadows or 3D. To add labels or data, use text boxes or the "Insert" option. Adjust the size by dragging the corners to fit your slide design.
5. How do I put a stock chart in PowerPoint?
To insert a stock chart in PowerPoint, first open your PowerPoint presentation and navigate to the slide where you want the chart. Click on the "Insert" tab, then select "Chart." In the Chart dialog, choose "Stock" from the category options. Select the specific stock chart type you want (e.g., High-Low-Close) and click "OK." PowerPoint will open an Excel sheet where you can input your stock data. After entering the data, close Excel, and your stock chart will appear on the slide. You can then customize its appearance as needed.

Visit: VS Website See: VS Portfolio
0 notes
Text
Memory Processes

Memory processes are the mental functions involved in retaining, recalling, and using information. Understanding these processes is crucial for enhancing learning, improving task management, and navigating daily life.
Key Takeaways
- Memory processes are essential for learning, decision-making, and functioning in daily life. - There are three main stages of memory: encoding, storage, and retrieval. - Dual-process theories explain the fast, automatic processing and slow, deliberate processing of information. - Techniques such as rehearsal, chunking, and mnemonic devices can enhance memory and learning. - Biological factors, including brain-derived neurotrophic factor (BDNF) and phase synchronization, play a role in memory processes. - Memory processes are critical in skill acquisition and are affected by psychological factors and disorders.
Introduction to Memory Processes
Definition of Memory Memory is the faculty by which the brain encodes, stores, and retrieves information. It is a dynamic system that allows individuals to retain experiences and knowledge over time, playing a pivotal role in learning and behavior. Overview of Memory Stages Encoding Encoding is the initial learning of information, where sensory input is transformed into a form that can be processed and stored. Storage Storage refers to maintaining information over periods of time, ranging from brief to extended durations. Retrieval Retrieval is the ability to access stored information when needed, completing the memory process.

How Memory Works
Encoding Information Sensory Input The journey of memory begins with sensory input, where external stimuli are captured by the senses and converted into neural signals. Processing and Combining Information This information is then processed and combined with existing knowledge, a step crucial for the formation of new memories. Storage of Memories Short-Term Memory Short-term memory holds information temporarily, allowing for immediate use and manipulation, a concept closely related to focus and concentration. Long-Term Memory Long-term memory is the extended storage of information, which can be recalled long after the initial learning has occurred. Retrieval of Stored Information Recall Recall is the process of bringing previously learned information to mind without the presence of the original stimulus. Recognition Recognition involves identifying information in the presence of cues, a simpler form of retrieval.

Dual-Process Theory
System 1: Fast and Automatic Processing System 1 operates quickly and effortlessly, handling familiar tasks and making rapid judgments. System 2: Slow and Deliberate Processing System 2 is slower and more deliberate, taking charge of complex problem-solving and unfamiliar situations. Interaction Between the Two Systems The interaction between these systems influences how we learn and make decisions, as detailed in studies on learning and conditioning.

Dual-Process Theories and Learning
Implications for Learning Strategies Engaging Automatic Processing Leveraging automatic processing can make learning more efficient, as it requires less cognitive effort. Engaging Deliberate Processing Deliberate processing, though more demanding, is essential for understanding complex concepts and mastering new skills. Enhancing Memory and Learning Rehearsal Techniques Rehearsal techniques involve the repetition of information to transfer it from short-term to long-term memory. Chunking Information Chunking breaks down large pieces of information into smaller, manageable units, making them easier to remember. Mnemonic Devices Mnemonic devices are memory aids that help encode information in a way that is easier to recall.

Improving Recall
Techniques for Better Memory Effective Rehearsal Effective rehearsal goes beyond simple repetition, involving deeper engagement with the material. Use of Chunking Chunking can be particularly useful in task management, helping to organize and remember various responsibilities. Mnemonic Devices Mnemonic devices, such as acronyms or visual imagery, can significantly improve recall. Practice and Repetition Consistent practice and repetition strengthen the neural connections associated with memories, solidifying them over time. Environmental Factors Influencing Recall The environment in which learning and recall occur can greatly affect memory processes, a concept explored in distraction management.

Biological Aspects of Memory Processes
Brain-Derived Neurotrophic Factor (BDNF) Role in Synaptic Plasticity BDNF is a protein that plays a key role in synaptic plasticity, the ability of synapses to strengthen or weaken over time, which is essential for learning and memory. BDNF/TrkB Signaling Pathway The BDNF/TrkB signaling pathway is involved in the growth and maintenance of neurons, crucial for long-term memory formation (source). Phase Synchronization in the Brain Memory Formation Phase synchronization, the harmonious firing of neurons, is important for the formation of memories. Memory Retrieval Similarly, synchronized neural activity is involved in the retrieval of stored information.

Memory Processes in Skill Acquisition
Learning vs. Performance Distinction Definitions and Differences Learning refers to the acquisition of knowledge or skills, while performance is the application of what has been learned. Memory Processes in Motor Skills Memory processes are particularly important in the acquisition of motor skills, where practice leads to more fluid and automatic performance. Practice and Skill Consolidation Repeated practice not only improves performance but also leads to skill consolidation, where movements become more automatic and require less conscious effort. https://www.youtube.com/watch?v=bSycdIx-C48
The Role of Psychology in Understanding Memory
Psychological Studies on Memory Cognitive Processes Psychological research delves into the cognitive processes involved in memory, exploring how information is encoded, stored, and retrieved. Behavioral Aspects Behavioral aspects of memory examine how our actions and experiences influence and are influenced by our memory processes. Memory Disorders and Their Impact Amnesia Amnesia is a disorder characterized by the inability to remember information, often due to brain injury or disease. Dementia Dementia, including conditions like Alzheimer's disease, involves the deterioration of memory and cognitive function over time.

Conclusion
Summary of Memory Processes The memory processes of encoding, storage, and retrieval are fundamental to our ability to function and thrive in a complex world. Importance of Memory in Daily Life Memory is essential for everyday activities, from learning new skills to navigating social interactions and making decisions. Future Directions in Memory Research Ongoing research continues to unravel the complexities of memory, with the potential to develop new strategies for enhancing memory and treating disorders. Understanding how psychologists study behavior and mental processes, including memory, provides valuable insights into the human mind (source). https://www.youtube.com/watch?v=pMMRE4Q2FGk
Unlock the Mysteries of Your Mind: Memory Processes FAQ
What are the main types of memory processes?The main types of memory processes include encoding, which is the initial learning of information; storage, which involves maintaining information over time; and retrieval, which is the ability to access information when you need it. These processes work together to allow us to take in new information, store it, and recall it later on.How does short-term memory differ from long-term memory?Short-term memory, also known as working memory, is the capacity to hold a small amount of information in an active, readily available state for a short period of time. Long-term memory, on the other hand, refers to the storage of information over an extended period. While short-term memory has a limited capacity and duration, long-term memory can store larger quantities of information for potentially unlimited durations.Can we improve our memory processes?Yes, memory processes can be improved through various techniques such as regular mental exercises, mnemonic devices, adequate sleep, healthy nutrition, and staying physically active. Engaging in activities that challenge your brain, like puzzles or learning new skills, can also enhance memory.What role does attention play in memory?Attention is critical for memory because it influences the initial encoding of information. Without proper attention, information may not be effectively encoded into short-term memory, making it less likely to be transferred into long-term memory. Focused attention helps filter out distractions and enhances the likelihood that an experience will be remembered.Why do we forget information?Forgetting can occur for several reasons, including the failure to encode information properly, the decay of memory traces over time, interference from other information, and retrieval failure. Sometimes, forgetting is a result of the brain's way of prioritizing information and discarding what is no longer relevant.What is the difference between explicit and implicit memory?Explicit memory, or declarative memory, involves conscious recollection of information such as facts and events. It is further divided into episodic memory (personal experiences) and semantic memory (general knowledge). Implicit memory, or non-declarative memory, refers to unconscious memories such as skills and conditioned responses.How does stress affect memory?Stress can both positively and negatively affect memory. Short-term stress can enhance the formation of memories due to the release of stress hormones. However, chronic stress can impair memory processes, particularly the retrieval of information, by damaging areas of the brain such as the hippocampus, which is crucial for memory.What is memory consolidation?Memory consolidation is the process by which short-term memories are transformed into long-term memories. This involves the stabilization and integration of new information into existing knowledge networks in the brain. Consolidation typically occurs during sleep, highlighting the importance of a good night's rest for memory formation.Are there any diseases that specifically affect memory?Yes, there are several diseases that can affect memory, with Alzheimer's disease being one of the most well-known. Alzheimer's disease and other forms of dementia can lead to progressive memory loss. Other conditions like stroke, traumatic brain injury, and certain infections can also impact memory processes.Is it possible to have a 'photographic' memory?The concept of a 'photographic' or eidetic memory, where a person can recall images, sounds, or objects with high precision, is a subject of debate among psychologists. While some individuals may have exceptional memory abilities, a true photographic memory has not been conclusively proven to exist in scientific studies. Read the full article
0 notes
Text
Process Improvement Techniques for Operational Success
Process improvement techniques identify inefficiencies, streamline workflows, and optimise operations, resulting in increased efficiency and reduced costs.
Read More: https://balancedscorecard.ltslean.com/software-blogs-details/process-improvement-techniques-for-operational-success

#processimprovement#operationalsuccess#improvementmethodologies#Agilemethodology#processmapping#5Whys#Kanban#dmaic#Customersatisfaction#continuousimprovement#vsm#TQM#Gembawalk#pdcacycle#justintime#leanmanufacturing#demingcycle#dmaicprocess#Standardwork#Dailyhuddles#kaizen#kaizenmethodology#kaizenlean#processefficiency#sixsigmaapproach#dmaicapproach#dmaiccycle#leanimprovement#datapoint#balancedscorecard
1 note
·
View note
Text
Conducting Effective Business Process Improvement

Business Process Improvement (BPI) is the systematic approach to helping an organization optimize its core processes for greater efficiency, effectiveness, and adaptability.
1. Understand the Current State ("As-Is")
Map Out Existing Processes
Use process mapping tools like:
SIPOC (Suppliers, Inputs, Process, Outputs, Customers)
Flowcharts
Value Stream Mapping (VSM)
Collect Data
Key metrics: Cycle time, error rates, cost per transaction, throughput
Interview stakeholders, observe workflows, review logs and KPIs
Tip: Get cross-functional input to avoid blind spots.
2. Define Clear Goals and Metrics
Use the SMART framework:
Specific – What process needs to improve?
Measurable – What metrics define success?
Achievable – Is it realistic with current resources?
Relevant – Does it align with strategic goals?
Time-bound – When should results be achieved?
Examples:
Reduce invoice processing time by 40% in 90 days
Eliminate 80% of manual handoffs in customer onboarding
3. Analyze the Root Causes
Use proven diagnostic tools:
5 Whys Analysis
Fishbone (Ishikawa) Diagram
Pareto Analysis (80/20 rule)
Process mining tools for digital workflows
Look for:
Bottlenecks
Redundancies
Manual tasks that could be automated
Communication failures
4. Design the Improved Process ("To-Be")
Use Lean, Six Sigma, and Agile Principles:
Eliminate waste (Lean: TIMWOOD – Transport, Inventory, Motion, Waiting, Overproduction, Overprocessing, Defects)
Reduce variation (Six Sigma)
Shorten feedback loops (Agile)
Redesign for:
Simplicity
Speed
Scalability
Automation where possible (e.g., RPA, workflow platforms)
Create To-Be maps, RACI charts, and updated SOPs.
5. Implement the New Process
Focus Areas:
Change Management – Train teams, communicate clearly, and manage resistance
Pilot Testing – Try improvements on a small scale before a full rollout
Project Management – Use agile sprints or phased rollouts to maintain momentum
Key Tools:
Communication plan
Training modules
Feedback loops (daily standups, weekly reviews)
6. Monitor, Optimize, and Sustain
Track KPIs:
Real-time dashboards
Weekly metrics reviews
Before vs. after comparisons
Continuous Improvement:
Encourage feedback from frontline users
Use Kaizen or PDCA cycles to keep iterating
Build a culture of accountability and excellence
7. Document and Standardize
Finalize new SOPs and documentation
Create playbooks or handbooks
Assign process owners for ongoing accountability
Tip: Use a centralized knowledge base or BPM tool to manage version control.
Bonus Tools & Frameworks
Tool/MethodUse CaseLean Six Sigma (DMAIC)Structured process improvementBusiness Process Model and Notation (BPMN)Process design and documentationKPI Tree / Metrics TreeLinking process improvements to business goalsVoice of the Customer (VoC)Ensure customer impact is central to changes
Summary Cheat Sheet
StepFocus1. Assess Current ProcessMap + Measure2. Define GoalsAlign with business impact3. Root Cause AnalysisFind what's broken4. Design Future StateLean + tech + feedback5. Implement ChangesTraining + testing + rollout6. Measure & ImproveMonitor, adapt, optimize7. Document & SustainSOPs, ownership, culture shift
0 notes
Text
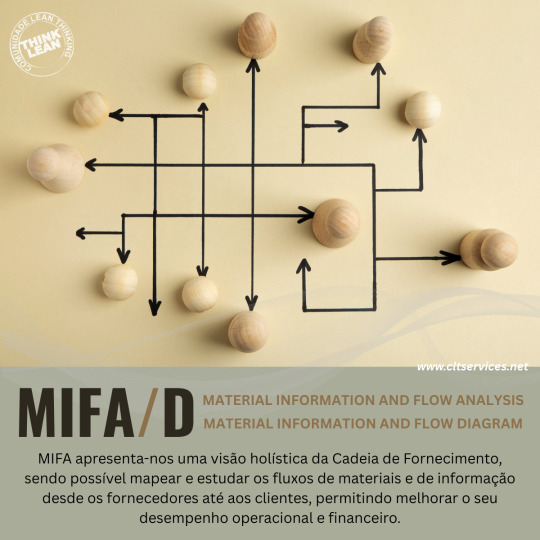
MIFA (análise do fluxo de materiais e de informação), 2ª Edição (formação de curta duração com uma sessão síncrona em horário pós-laboral, €65.00) #lean #MIFA #processmapping
1 note
·
View note
Text
Untitled
Untitled https://benmuallens.weebly.com/blog/untitled2749880 Process Mapping for Improved Performance - KamyarShah - Medium https://interimcoo.medium.com/process-mapping-for-improved-performance-4cd6624a17e4 #ProcessMapping #WorkflowOptimization #BusinessEfficiency #OperationalExcellence #ProcessImprovement #LeanManagement #ContinuousImprovement #BusinessProcess #PerformanceEnhancement #ProcessDesign from businessconsulting https://mastodon.social/@businessconsulting/113686589332886008 via https://mastodon.social/@businessconsulting via Pro Business Consulting - Blog https://probusinessexpert.weebly.com/blog/untitled3479529 via Ben Mullins - Blog https://benmuallens.weebly.com/blog December 20, 2024 at 12:49PM
0 notes
Text
Process Mapping for Improved Performance – KamyarShah – Medium https://interimcoo.medium.com/process-mapping-for-improved-performance-4cd6624a17e4 #ProcessMapping #WorkflowOptimization #BusinessEfficiency #OperationalExcellence #ProcessImprovement #LeanManagement #ContinuousImprovement #BusinessProcess #PerformanceEnhancement #ProcessDesign from businessconsulting…
0 notes
Text
Carbon Footprint Management Market Analysis, Trends till 2033
Carbon Footprint Management Market was valued at USD 10.3 billion in 2023, and is projected to reach USD 19.67billion by 2033, growing at a CAGR of 7% from 2024 to 2033.
The competitive analysis of the Carbon Footprint Management Market offers a comprehensive examination of key market players. It encompasses detailed company profiles, insights into revenue distribution, innovations within their product portfolios, regional market presence, strategic development plans, pricing strategies, identified target markets, and immediate future initiatives of industry leaders. This section serves as a valuable resource for readers to understand the driving forces behind competition and what strategies can set them apart in capturing new target markets.
Market projections and forecasts are underpinned by extensive primary research, further validated through precise secondary research specific to the Carbon Footprint Management Market. Our research analysts have dedicated substantial time and effort to curate essential industry insights from key industry participants, including Original Equipment Manufacturers (OEMs), top-tier suppliers, distributors, and relevant government entities.
Receive the FREE Sample Report of Carbon Footprint Management Market Research Insights @ https://stringentdatalytics.com/sample-request/carbon-footprint-management-market/13386/
Market Segmentations:
Global Carbon Footprint Management Market: By Company • Carbon Footprint Ltd • Dakota Software Corporation • ENGIE • IsoMetrix • ibm corporation • ProcessMAP • Schneider Electric • SAP • Wolters Kluwer N.V. Global Carbon Footprint Management Market: By Component • Solution • Service Global Carbon Footprint Management Market: By Industry Vertical • Energy and Utilities • Manufacturing • Residential and Commercial Buildings • Transportation and Logistics • IT and Telecom
Regional Analysis of Global Carbon Footprint Management Market
All the regional segmentation has been studied based on recent and future trends, and the market is forecasted throughout the prediction period. The countries covered in the regional analysis of the Global Carbon Footprint Management market report are U.S., Canada, and Mexico in North America, Germany, France, U.K., Russia, Italy, Spain, Turkey, Netherlands, Switzerland, Belgium, and Rest of Europe in Europe, Singapore, Malaysia, Australia, Thailand, Indonesia, Philippines, China, Japan, India, South Korea, Rest of Asia-Pacific (APAC) in the Asia-Pacific (APAC), Saudi Arabia, U.A.E, South Africa, Egypt, Israel, Rest of Middle East and Africa (MEA) as a part of Middle East and Africa (MEA), and Argentina, Brazil, and Rest of South America as part of South America.
Click to Purchase Carbon Footprint Management Market Research Report @ https://stringentdatalytics.com/purchase/carbon-footprint-management-market/13386/?license=single
Key Report Highlights:
Key Market Participants: The report delves into the major stakeholders in the market, encompassing market players, suppliers of raw materials and equipment, end-users, traders, distributors, and more.
Comprehensive Company Profiles: Detailed company profiles are provided, offering insights into various aspects including production capacity, pricing, revenue, costs, gross margin, sales volume, sales revenue, consumption patterns, growth rates, import-export dynamics, supply chains, future strategic plans, and technological advancements. This comprehensive analysis draws from a dataset spanning 12 years and includes forecasts.
Market Growth Drivers: The report extensively examines the factors contributing to market growth, with a specific focus on elucidating the diverse categories of end-users within the market.
Data Segmentation: The data and information are presented in a structured manner, allowing for easy access by market player, geographical region, product type, application, and more. Furthermore, the report can be tailored to accommodate specific research requirements.
SWOT Analysis: A SWOT analysis of the market is included, offering an insightful evaluation of its Strengths, Weaknesses, Opportunities, and Threats.
Expert Insights: Concluding the report, it features insights and opinions from industry experts, providing valuable perspectives on the market landscape.
Report includes Competitor's Landscape:
➊ Major trends and growth projections by region and country ➋ Key winning strategies followed by the competitors ➌ Who are the key competitors in this industry? ➍ What shall be the potential of this industry over the forecast tenure? ➎ What are the factors propelling the demand for the Carbon Footprint Management? ➏ What are the opportunities that shall aid in significant proliferation of the market growth? ➐ What are the regional and country wise regulations that shall either hamper or boost the demand for Carbon Footprint Management? ➑ How has the covid-19 impacted the growth of the market? ➒ Has the supply chain disruption caused changes in the entire value chain? Customization of the Report:
This report can be customized to meet the client’s requirements. Please connect with our sales team ([email protected]), who will ensure that you get a report that suits your needs. You can also get in touch with our executives on +1 346 666 6655 to share your research requirements.
About Stringent Datalytics
Stringent Datalytics offers both custom and syndicated market research reports. Custom market research reports are tailored to a specific client's needs and requirements. These reports provide unique insights into a particular industry or market segment and can help businesses make informed decisions about their strategies and operations.
Syndicated market research reports, on the other hand, are pre-existing reports that are available for purchase by multiple clients. These reports are often produced on a regular basis, such as annually or quarterly, and cover a broad range of industries and market segments. Syndicated reports provide clients with insights into industry trends, market sizes, and competitive landscapes. By offering both custom and syndicated reports, Stringent Datalytics can provide clients with a range of market research solutions that can be customized to their specific needs.
Reach US
Stringent Datalytics
+1 346 666 6655
Social Channels:
Linkedin | Facebook | Twitter | YouTube
0 notes
Text
Process Safety Services Market to Witness Excellent Revenue Growth Owing to Rapid Increase in Demand
Latest Report Available at Advance Market Analytics, “Process Safety Services Market” provides pin-point analysis for changing competitive dynamics and a forward looking perspective on different factors driving or restraining industry growth. The global Process Safety Services market focuses on encompassing major statistical evidence for the Process Safety Services industry as it offers our readers a value addition on guiding them in encountering the obstacles surrounding the market. A comprehensive addition of several factors such as global distribution, manufacturers, market size, and market factors that affect the global contributions are reported in the study. In addition the Process Safety Services study also shifts its attention with an in-depth competitive landscape, defined growth opportunities, market share coupled with product type and applications, key companies responsible for the production, and utilized strategies are also marked.
Some key players in the global Process Safety Services market are:
UL LLC (United States)
HSE Integrated Ltd. (Canada)
Trinity Consultants Inc. (United States)
Intelex Technologies (Canada)
Enhesa Inc. (Belgium)
ProcessMAP Corporation (United States)
CSA Group Company (Canada)
Jaama Ltd (United States)
SGS Group (Switzerland)
Bureau Veritas (France)
HIMA Paul Hildebrandt (Germany)
PrSM Corporation (United States) Process safety and risk management is a part of an overall safety management plan and emphases on major hazards that impact safety, environmental damage and business loss. It also help to increase operability, productivity, stability and quality output, which will, in turn, lead to the specification of safeguards against undesirable events. Process Safety is a corporate culture in the organization. Process safety management certification is the first step to understand all the issues and potential hazards so that these safeguards can be implemented effectively throughout the company.What's Trending in Market: Increase in Process Automation among End-Users
Improving Safety Standards and Related Developments
Challenges: High Cost of Process Safety Services
Market Growth Drivers: Increasing Adoption of Safe Operational Practices in Process Industries
Higher Adoption of Software by Large Industries to Enhance Operational Capabilities
The Global Process Safety Services Market segments and Market Data Break Down23839
Presented By
AMA Research & Media LLP
0 notes
Text
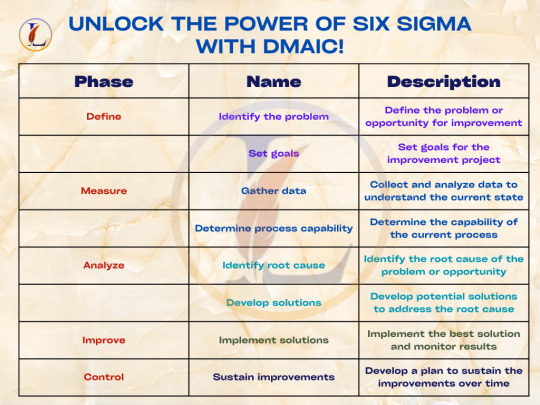
Streamline your processes and optimize your results with DMAIC - the tried and true methodology of Six Sigma 📈💯
learn more>>
#DMAIC#SixSigma#ProcessImprovement#QualityControl#DataAnalysis#ProblemSolving#ContinuousImprovement#BusinessImprovement#Efficiency#Productivity#LeanSixSigma#ProjectManagement#Metrics#RootCauseAnalysis#StatisticalProcessControl#Kaizen#ProcessMapping#ProcessOptimization#BusinessExcellence#PerformanceImprovement#pmp#pmpcertifiction#pmpcertificationtraining#pmp exam#pmp online#projectmanagement#pmp certification#pmp training#scrum#project management
0 notes
Photo

A Swim Lane Flowchart, also known as a cross-functional flowchart, is a type of process mapping tool that is used to visually represent the flow of a process and the various roles and responsibilities involved in that process. The methodology of the Swim Lane Flowchart comes from the field of Lean management and operational excellence, which emphasizes the importance of efficiency and continuous improvement in business operations. The Swim Lane Flowchart is used to clearly identify and document the steps in a process, as well as the individuals or groups responsible for each step. This allows for a clear understanding of the process and helps to identify areas for improvement. The Swim Lane Flowchart is particularly useful for identifying bottlenecks and delays in a process, as well as for identifying areas where multiple teams or departments are involved in a single process. One of the key benefits of the Swim Lane Flowchart is that it helps to break down silos and promote cross-functional collaboration. By clearly documenting the roles and responsibilities of different teams and departments, the Swim Lane Flowchart helps to identify areas where different teams can work together more effectively. This can lead to increased efficiency and improved communication among different teams and departments. Read the full article and see how you can use it for your organization at operationsinsider.com Link in BIO 📚 language of lean Like❤️/Share✅/comment👇/follow👉@operationsinsider #operationsinsider #opex #waste #wasteattack #operationalexcellence #LeanManagement #SwimLaneFlowchart #processmapping #OperationsManagement #ContinuousImprovement #ProcessOptimization #WorkflowOptimization #ManufacturingOptimization #QualityControl #CostReduction #OperationalExcellence #VisualManagement #ProcessVisualization #BusinessOptimization #EfficiencyBoost #WorkplaceOrganization #EfficiencyExpert #StreamlineOperations #LayoutOptimization #OptimizeProcesses #Standardization #MaximizeProductivity #ReduceWaste #EliminateInefficiency #workplaceefficiency (hier: Dell Round Rock 2 West) https://www.instagram.com/p/Cn7iVhboieq/?igshid=NGJjMDIxMWI=
#operationsinsider#opex#waste#wasteattack#operationalexcellence#leanmanagement#swimlaneflowchart#processmapping#operationsmanagement#continuousimprovement#processoptimization#workflowoptimization#manufacturingoptimization#qualitycontrol#costreduction#visualmanagement#processvisualization#businessoptimization#efficiencyboost#workplaceorganization#efficiencyexpert#streamlineoperations#layoutoptimization#optimizeprocesses#standardization#maximizeproductivity#reducewaste#eliminateinefficiency#workplaceefficiency
0 notes
Text
Analysing with Precision: 5 Root Cause Analysis Techniques
Implementing Root Cause Analysis techniques in organisations helps to enhance organisational efficiency, resolve issues, and drive continuous improvement.
Read More: https://balancedscorecard.ltslean.com/software-blogs-details/analysing-with-precision-root-cause-analysis-techniques

#lts#lean#leantransitionsolutions#Datapoint#balancedscorecard#balancedscorecardsoftware#rootcause#fishbonediagram#fmea#ishikawadiagram#paretoanalysis#paretochart#5whys#processmapping#ishikawa#fishboneanalysis#paretodiagram#fmeaanalysis#paretograph#fmeaprocess#fishbonechart#5whysmethod#faulttree#rcaanalysis#rcareport#fivewhysanalysis#causeeffectanalysis#fmeatool#fishbonemodel#paretoplot
0 notes
Text
Process Mapping
So this is my process map, over the company i'm currently working in. Many danes know this company, both good and bad things to say about it.
My teacher told me, to do a process map and explain where the things in the process can go wrong, and believe me, THERE IS A LOT that can go wrong! You know the workplace well, especially after 5 years of working there.
The red boxes are things that can go wrong in the process of dispatching a customer.

1 note
·
View note
Video
youtube
Wednesday Workshop 09 29 21 Division of Labor Hear from a Manager, Mi...
#cj#safe#agile#pmp#labor#union#scrum#kanban#agilepmp#leadership#executive#procurement#politics#testprep#processmapping#projectmanager#projectmanagement#projectmanagerinterview
0 notes