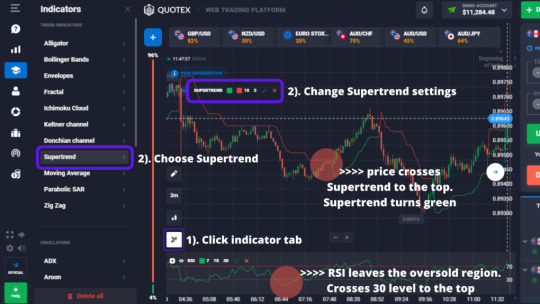
#Supertrend Indicator
Text
How to Trade with Supertrend: A Comprehensive Guide
Trading in the financial markets can be a daunting task, especially for beginners. However, with the right tools and strategies, anyone can enhance their trading skills and increase their chances of success. One such powerful tool is the Supertrend indicator. In this blog post, we’ll delve deep into how to trade using the Supertrend indicator, covering its features, how to set it up, and various…
View On WordPress
#Backtesting Supertrend strategy#Buy and sell signals#How to trade with Supertrend#Optimize Supertrend indicator#Risk management in trading#Supertrend and moving averages#Supertrend and RSI#Supertrend breakout strategy#Supertrend for beginners#Supertrend in forex trading#Supertrend in stock trading#supertrend indicator#Supertrend indicator settings#Supertrend parameters#Supertrend scalping strategy#Supertrend setup#Supertrend signals#Supertrend trading strategy#Trading Strategies#Trend-following indicator
0 notes
Text
youtube
7 Best Indicators For Crypto Grid Bots
Are you struggling to make profits with your crypto grid bots? In this video, I'll show you how to use 7 powerful indicators to make your bots more profitable.
By using these indicators, you can set your price ranges, choose the best time to start a bot, set stop losses and take profits.
I'll explain in detail the 7 best indicators for crypto grid bots: ATR, Supertrend, ATR Percentile, Bollinger Bands, EMAs, SMAs, and Fibonacci Retracements.
I'll also provide precise concepts and explanations, and add in some chart examples for each indicator.
To help you get started with your own crypto grid bot, I'm providing a Free Grid Bot Template which you can download and use with your grid bot of choice.
You can also get a free trial for Bitsgap.
Watch this video to learn how to improve your bot's profitability with these seven powerful indicators.
#indicators for crypto grid bots#indicators for trading crypto#how to make money with crypto trading bots#best trading indicators for crypto#best crypto trading indicators#trading indicators for crypto#crypto trading bots#crypto grid trading#crypto trading#crypto grid bots#crypto indicators#crypto grid trading bot#crypto#cryptocurrency#grid bot#grid trading#trading strategy#trading bot#atr#supertrend#ema#sma#bollinger bands#fibonacci retracements#Youtube
1 note
·
View note
Text
SUPERTREND
SuperTrend is a technical indicator used by traders to identify trend direction and potential entry and exit points. It is a popular indicator among traders who use trend-following strategies.The SuperTrend indicator is based on the Average True Range (ATR) and the price movement of the asset being traded. The ATR is used to determine the volatility of the asset, and this information is then used…

View On WordPress
1 note
·
View note
Text
Supertrend Indicator: How to Use to Trade Binary Options
Supertrend Indicator: How to Use to Trade Binary Options
If you are looking for an easy-to-use trend-following indicator with some added features, look no further than SuperTrend. This indicator is plotted on prices and its placement indicates the current trend.
But picking trends isn’t the only use the Supertrend indicator has, you can also use it as either a support or resistance level.
In this post, I will not only teach you how the Supertrend…
View On WordPress
#2 supertrend strategy#3 supertrend combination supertrends 2022 credit suisse#3 supertrend indicator strategy#3 supertrend scanner#3 supertrend strategy afl#3 supertrend strategy tradingview#3x supertrend indicator#4h supertrend#best combination with supertrend indicator#best settings for supertrend indicator#best supertrend indicator#best supertrend settings for nifty#best time frame for supertrend indicator#best way to use supertrend indicator#does supertrend indicator repaint#does supertrend indicator work#does supertrend work#forex supertrend indicator#formula for supertrend indicator#free charts with supertrend indicator#github supertrend python#gold supertrend#how accurate is supertrend#how accurate is supertrend indicator#how does supertrend indicator work#how does supertrend work#how is supertrend calculated#how is supertrend indicator calculated#how is the supertrend indicator calculated#how many super troopers are there
1 note
·
View note
Text
The popular meme-inspired cryptocurrency, WIF, is facing uncertain times as its price dips amidst Market volatility. Investors are now speculating whether WIF will be able to reach the elusive $10 mark in the near future. Stay tuned as we track the latest developments and price predictions for this quirky crypto coin.
Click to Claim Latest Airdrop for FREE
Claim in 15 seconds
Scroll Down to End of This Post
const downloadBtn = document.getElementById('download-btn');
const timerBtn = document.getElementById('timer-btn');
const downloadLinkBtn = document.getElementById('download-link-btn');
downloadBtn.addEventListener('click', () =>
downloadBtn.style.display = 'none';
timerBtn.style.display = 'block';
let timeLeft = 15;
const timerInterval = setInterval(() =>
if (timeLeft === 0)
clearInterval(timerInterval);
timerBtn.style.display = 'none';
downloadLinkBtn.style.display = 'inline-block';
// Add your download functionality here
console.log('Download started!');
else
timerBtn.textContent = `Claim in $timeLeft seconds`;
timeLeft--;
, 1000);
);
Win Up To 93% Of Your Trades With The World's #1 Most Profitable Trading Indicators
[ad_1]
Solana-based memecoin dogwifhat [WIF] has experienced a 16.36% decrease in value over the past month. Despite this recent dip, WIF has seen an impressive 1,650% surge in price since the beginning of the year, outperforming many other popular memecoins.
Currently priced at $3.02, WIF made a failed attempt to reach $5, hitting a snag at $4.84, its all-time high. However, Market analysts are optimistic about WIF's future, with some predicting a potential surge to $10 or even $15, representing a 5x increase.
Market indicators suggest a bullish trend for WIF, with the potential to break through the $3.25 resistance level and reach $6.50. The Supertrend on the 4-hour chart has shown a buy signal at $3, with the Money Flow Index indicating strong liquidity flow into WIF's Market.
Open Interest for WIF currently stands at $251.38 million, showing a decrease compared to previous months. However, the stablecoin supply held by WIF whales, valued at over $5 million, could fuel a price recovery. If investors continue to pour capital into WIF, a significant price increase may be on the horizon.
While a repeat of WIF's previous 883% increase in 90 days may be unlikely, analysts believe a move to $10 is feasible. The timeline for this potential price surge remains uncertain, but the overall outlook for WIF remains positive.
In conclusion, WIF's price trajectory will largely depend on Market sentiment, liquidity flow, and investor confidence in the project. As the cryptocurrency Market continues to evolve, WIF's performance will be closely monitored by traders and enthusiasts alike.
Win Up To 93% Of Your Trades With The World's #1 Most Profitable Trading Indicators
[ad_2]
1. Can WIF crypto reach $10 amid the recent dip?
- It's possible, but it's hard to predict the exact price movements of memecoins like WIF.
2. Should I invest in WIF for a potential profit of $10?
- Investing in memecoins like WIF can be risky, so make sure to do thorough research before making any decisions.
3. How can I predict the price of WIF crypto?
- Predicting the price of cryptocurrencies is difficult and involves a lot of uncertainty, so be cautious with any predictions.
4. Is it a good time to buy WIF during the recent dip?
- Buying during a dip can sometimes be a good strategy, but it's important to consider the overall Market trends and factors affecting crypto prices.
5. What factors can influence the price of WIF in the future?
- Factors like Market sentiment, adoption rate, and regulatory developments can all impact the price of WIF and other cryptocurrencies.
Win Up To 93% Of Your Trades With The World's #1 Most Profitable Trading Indicators
[ad_1]
Win Up To 93% Of Your Trades With The World's #1 Most Profitable Trading Indicators
Claim Airdrop now
Searching FREE Airdrops 20 seconds
Sorry There is No FREE Airdrops Available now. Please visit Later
function claimAirdrop()
document.getElementById('claim-button').style.display = 'none';
document.getElementById('timer-container').style.display = 'block';
let countdownTimer = 20;
const countdownInterval = setInterval(function()
document.getElementById('countdown').textContent = countdownTimer;
countdownTimer--;
if (countdownTimer < 0)
clearInterval(countdownInterval);
document.getElementById('timer-container').style.display = 'none';
document.getElementById('sorry-button').style.display = 'block';
, 1000);
0 notes
Text
Neste artigo, apresento três maneiras de interpretar a negociação de tendências com três técnicas diferentes: Momentum de Tendência, Dinâmica com TMA (Média Móvel Triangular) e Tendência em Tendência. A estratégia é baseada em uma sólida definição de tendência estabelecida no Supertrend lento, resultando em três modelos diferentes com cronometragens distintas com base nas definições propostas.
Negociando com a Antologia de Tendências
Configuração da Estratégia
Período de tempo: 15 minutos ou superior.
Pares de moedas: qualquer.
Indicadores Metatrader 4
SuperTrend Slow (5, 10): Indicador de tendência.
Viper 1: Indicador.
Viper 2: Indicador.
Indicator Trading Flash: Indicador dinâmico (repintura).
Scalper 3 (7 períodos): Indicador.
Modelo 1 - Momentum de Tendência
Supertrend + Viper1 e Viper 2
Compra
Setas azuis do Supertrend.
Setas azuis do Viper 1 e Viper 2.
Venda
Setas vermelhas do Supertrend.
Setas brancas do Viper 1 e Viper 2.
Modelo 2 - Dinâmica com seta TMA (repintura)
Recomenda-se usar prazos de 15 minutos ou superiores.
Compra
Setas azuis do Supertrend.
Seta de compra do indicador TMA.
Venda
Setas vermelhas do Supertrend.
Seta de venda do indicador TMA.
Observação: O indicador TMA é mencionado como tendo repintura, o que significa que as setas de compra/venda podem mudar retroativamente após o fechamento da vela.
Modelo 3 - Tendência em Tendência
Compra
Setas azuis do Supertrend.
Seta de compra do indicador Scalper.
Venda
Setas vermelhas do Supertrend.
Seta de venda do indicador Scalper.
Qual modelo é o melhor depende do tipo de mercado e da discrição pessoal, sempre mantendo em mente que todo o sistema é baseado em uma boa definição de tendência, graças ao Supertrend lento.
A abordagem mais simples de aplicar é a abordagem de tendência.
Essas são três maneiras diferentes de abordar a negociação de tendências usando indicadores específicos. Como sempre, é crucial testar e praticar essas estratégias em uma conta de demonstração antes de aplicá-las a negociações com dinheiro real. Além disso, a gestão de riscos e a disciplina são essenciais para o sucesso na negociação.
[sociallocker id="8062"][fusion_button link="https://forexbinarias.com/wp-content/uploads/2023/09/Trade-with-the-Trend-Anthology.zip" title="" target="_blank" link_attributes="" alignment_medium="" alignment_small="" alignment="center" modal="" hide_on_mobile="small-visibility,medium-visibility,large-visibility" sticky_display="normal,sticky" class="" id="" color="material-green" button_gradient_top_color_hover="" hue="" saturation="" lightness="" alpha="" button_gradient_top_color="" button_gradient_bottom_color_hover="" button_gradient_bottom_color="" gradient_start_position="" gradient_end_position="" gradient_type="" radial_direction="" linear_angle="180" accent_hover_color="" accent_color="" type="3d" bevel_color="" bevel_color_hover="" border_top="" border_right="" border_bottom="" border_left="" border_radius_top_left="" border_radius_top_right="" border_radius_bottom_right="" border_radius_bottom_left="" border_hover_color="" border_color="" size="large" padding_top="" padding_right="" padding_bottom="" padding_left="" fusion_font_family_button_font="" fusion_font_variant_button_font="" font_size="" line_height="" letter_spacing="" text_transform="" stretch="default" margin_top="20px" margin_right="" margin_bottom="20px" margin_left="" icon="fa-download fas" icon_position="left" icon_divider="no" hover_transition="none" animation_type="" animation_direction="left" animation_color="" animation_speed="0.3" animation_delay="0" animation_offset=""]Download[/fusion_button][/sociallocker]
0 notes
Text
5 Projects Set to Unlock New Tokens and Their Price Predictions
Next week, several projects are scheduled to unlock a new set of tokens and release them into circulation. Some of the projects in this cohort include Sui (SUI), Manta Network (MANTA), dydx (DYDX), Optimism (OP), and SingularityNET (AGIX).
According to data from Token Unlocks, SUI would unlock $7.12 million worth of the token. MANTA plans to release $5.75 million, while DYDX’s token unlock would be worth $111.33 million. In addition, OP’s unlocks would be worth $86.01 million, and YFI’s unlock was valued at $9.34 million.
Most times, token unlocks are associated with price fluctuations and a change in volatility. Here, Coin Edition looks at the price predictions for the tokens when the event takes place.
SUI
At press time, SUI changed hands at $1.80, representing a 4.40% decrease in the last 24 hours. On the 4-hour chart, the Bollinger Bands (BB) indicated extreme volatility with the token. This implies that the price might fluctuate in either direction.
However, the RSI trended downwards, suggesting that the previous bullish momentum had become weak. In a highly bullish case, the price of SUI might extend toward $1.94. But if bears continue to dictate the momentum, the value might fall to $1.54.
SUI/USD 4-Hour Chart (Source: TradingView) MANTA
The Awesome Oscillator (AO) on the 4-hour chart revealed that bulls were trying to force the momentum upward. If this continues, the price of MANTA might head toward $3.45. However, at $3.45, the token might experience a pushback.
Should this be the case, MANTA might retrace to $2.98. But if bulls can defend the support at $2.74, the value might rally back to $3 as the Aroon indicator favored a bullish trend over a bearish one.
MANTA/USD 4-Hour Chart (Source: TradingView) DYDX
From the 4-hour chart, DYDX has been a victim of intense selling pressure since March 9. As a result of that, the value of the token has lost 8.56% of its value in the last seven days.
But bulls have been able to capitalize on seller exhaustion in an attempt to revive the price action. However, signals from the Supertrend showed that the uptrend might be short-lived. This was because of the sell signal at $3.55.
If the price of DYDX increased, it might hit $3.55. But when the tokens are unlocked, the value could be forced back to $3.10.
1 note
·
View note
Text
Miyagi Masters Package
Unlock Your Trading Potential with Miyagi: Where Mastery Meets Profitability.

Miyagi indicators combine multiple trigger conditions and place them in one toolbox for traders to easily use, produce alerts, backtest, reduce risk and increase profitability.
Take your trading to the next level with Miyagi Indicators & simplify TradingView alert management with Miyagi Trading Premium.
Miyagi Pro Package Includes:
All Miyagi Indicators with Alerts and Backtest.
Counter-trend scripts: Miyagi 4in1 + Alerts, Miyagi 6in1 + Alerts, Miyagi 10in1 + Alerts.
Trend scripts: Miyagi PSAR and Miyagi STrend.
Backtester: Miyagi Backtester will allow you to backtest, reduce risk and increase profitability.
Early access alphas & betas to any new indicators.
TVAlertsManager Premium is included to save, load, pause, create, edit & delete alerts with ease.
Miyagi Pro channel + shared BEST Settings to help you stay on top of your game.
Miyagi DegenAlerts
PSAR & Supertrend Oscillator
Miyagi indicators improve profitability and reduce risk, meanwhile TVAlertsManager will help simplify alert management.
Experience peace of mind with our 7-day money-back guarantee. You can easily cancel your subscription with just one click from your account at any time. Subscriptions are automatically activated upon successful payment processing. It’s important to exercise caution when entering your TradingView ID/Discord ID & UUIDs, as they are case-sensitive and vital for automated subscription access.
To view this product visit on this link:
https://miyagitrading.com/shop/miyagi-master/
0 notes
Text
Supertrend and MACD Indicators Signal Bitcoin Breakout Amid $59k Support Zone Tug of War
Bitcoin, the pioneer cryptocurrency, is displaying a distinctive pattern that suggests a significant shift in its trajectory, according to analysis by MikybullCrypto. Over the past two months, Bitcoin has exhibited a pattern resembling a blow-off top, a phenomenon not previously observed in its price history. This intriguing trend, combined with insights from reliable indicators such as the Supertrend and the Moving Average Convergence Divergence (MACD), points towards a crucial moment for Bitcoin.
The Supertrend and MACD, known for their efficacy as forecasting tools, currently indicate that Bitcoin is consolidating within a specific range. This consolidation phase is seen as Bitcoin's strategic move to gather momentum for a potential breakout to new all-time highs. Emphasizing the significance of this period, a critical support zone is identified between $59,000 and $57,000, adding weight to the importance of Bitcoin's current trading range.
The daily timeframe perspective reveals that Bitcoin typically enters a consolidation phase when approaching significant weekly resistance levels, marked by a yellow line on the charts. This behavioral pattern underscores Bitcoin's tendency to stabilize its price action before making substantial moves.
March is historically a month marked by pullbacks for Bitcoin, aligning with its seasonal price tendencies. However, MikybullCrypto suggests that the upcoming April Bitcoin halving could disrupt this usual pattern, potentially altering market expectations. The impending halving event could exert a significant impact on Bitcoin's market dynamics, potentially mitigating the expected seasonal pullback.
As of the latest update, Bitcoin is priced at $62,129.49, with a noteworthy trading volume over the past 24 hours. Despite a slight decrease of 0.68% in the previous day, short-term technical indicators suggest bullish momentum. The 1-day RSI indicates potential overbought conditions in the short term, emphasizing the need for vigilance in the face of potential reversals.
0 notes
Text
Bitcoin Price Metrics Signal Further Gains Above $48K

Bitcoin's price has increased by 6.28% in the last 24 hours, reaching a high of $48,200 on February 9. Several indicators, including technical analysis, Bitcoin ETF shares, and on-chain data, suggest that Bitcoin could surpass its previous high of $49,000.
The SuperTrend indicator on Bitcoin's monthly chart has recently signaled a bullish trend, flipping from red to green and moving below $44,600. Historical data shows that similar confirmations from this indicator in the past have resulted in significant rallies in Bitcoin's price.
Bitcoin ETF shares have also shown positive performance, with an average gain of 4% as Bitcoin's price crossed $47,000 on February 9. ETFs such as the Global X Blockchain & Bitcoin Strategy ETF have experienced significant increases in the past 24 hours.
Additionally, on-chain data suggests that Bitcoin has found support around the $42,500 level. The "in/out of the money around price" (IOMAP) model indicates that many addresses have previously bought Bitcoin within the $41,526–$42,942 range, establishing it as a strong support level.
Overall, these indicators, along with the performance of Bitcoin ETF shares and on-chain data, hint at the potential for Bitcoin to experience further gains above $48,000. The increased interest from institutional investors and the upcoming halving event are factors that could drive Bitcoin's price higher in the future.
Read the original article
#Bitcoin #Cryptocurrency #BTC #BitcoinETF
0 notes
Video
youtube
Supertrend Indicator _ Strong Reversal System For Scalping Trading _ Swi...
#youtube#forex#forextrading#ris#is trading make you rich#is trading worth it in 2023#is trading rea#rush trading#rsi trading strategy pocket option#rsi 2 trading strategy
0 notes
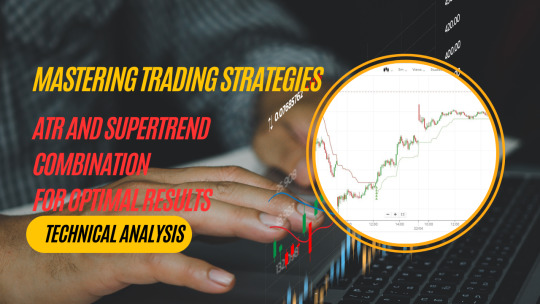
Text
Mastering Trading Strategies: ATR and Supertrend Combination for Optimal Results
Introduction
In the dynamic world of trading, having a robust strategy is paramount for success. Among the myriad of techniques available, combining the Average True Range (ATR) and Supertrend indicators has emerged as a potent method for traders to navigate the markets with confidence.
In this comprehensive guide, we’ll delve into the intricacies of utilizing this powerful combination to…
View On WordPress
#ATR#ATR trading strategy#Entry and exit points#Entry Points#Exit points#learn technical analysis#Position Sizing#Position sizing strategy#Risk Management#Risk management in trading#Risk-Reward Ratio#Risk-reward ratio optimization#Stop-Loss#Stop-loss placement#Supertrend#supertrend indicator#technical analysis#Trading Strategies#Trading with ATR and Supertrend#Trend Following#Trend-following techniques#Volatility#Volatility-based trading
0 notes
Text
Roblox stock price (NYSE: RBLX) recovered approximately 21% from the recent swing high and formed a double bottom pattern. It took support near $25.00 and began to recover from the 52-week low.
RBLX stock price is approaching the 50-day EMA and is trying to climb above to reverse the short-term trend. It recovers by forming higher high candles that indicate that bulls are active and returning back on track.
In August, Roblox Corporation stock price fell badly after the release of the previous quarter’s earnings. It showed a massive gap down and broke the crucial support of $33.00 which hurt the investors’ sentiments and invited further decline.
RBLX share price lost all its previous gains and returned back to the demand zone. Previously, Roblox share price took support multiple times in the range between $21.00 to $25.00.
Luckily, every time buyers came forward, they succeeded in pushing the price higher and showed a decent rally. Therefore, this time, a similar pattern might be repeated.
Roblox stock price closed the previous session at $30.46 with an intraday rise of 2.15%. The market capitalization stood at $18.79 Billion.
Will Roblox Stock Price Break the Neckline?
NYSE: RBLX Daily chart by TradingView
Roblox stock price tested its long-term demand zone and displayed a double-bottom bullish reversal pattern. The confirmation of the bullish trend reversal will come when buyers succeed in breaking the neckline hurdle.
RBLX stock price pattern is mildly bullish but it seems like a temporary pullback. So, the possibility of a neckline breakout is low.
However, if the broader market indices and other stocks of gaming sectors show some positive momentum, the RBLX shares might continue recovery and fill the previous gap.
RBLX Stock Price: When Will the Next Phase of Recovery Trigger?
RBLX stock price formed a bullish engulfing candle on a weekly time frame. Buyers who succeed in giving the follow-up indicate mild bullishness. However, the next phase of recovery is only possible when buyers succeed in breaking the $33.00 hurdle.
The MACD is slow and steady on the rise and showcases the presence of buyers. The RSI at 61 slopes upward denoting the strength of bulls.
The supertrend is also indicating bullishness and favors the bulls. However, the confirmation of strength from the price action is awaited.
Conclusion
Roblox stock price (NYSE: RBLX) recovered approximately 21% after hitting the 52-week low. However, the price reached the 50-day EMA so it will be difficult for the bulls to continue the recovery.
The analysis suggests that RBLX stock price is at crucial resistance. It is too early to judge if it has turned bullish. Therefore, the investors must remain cautious in the coming months.
Technical Levels
Resistance Levels: $33.36 and $40.00
Support Levels: $24.81 and $21.69
0 notes
Text
情報開発と利活用20231007
Recent Posts
何故、スーパートレンドが究極の仮想通貨トレンドのフォロー指標であるのかWhy the Supertrend is the Ultimate Crypto Trend Following Indicator
「積極財政を多数派にしよう!」民主制のルール
先端技術情報20231007
(1)製造業でのブロックチェーン:サプライチェーンマネジメントを通じてビジネス価値の推進Blockchain in Manufacturing: Driving Business Value Through Supply Chain Management
0 notes
Text
📈 Discover the Winning Combo for Stock Traders: SuperTrend + MACD! 🚀
Are you looking to up your stock trading game? Check out our latest article on how SuperTrend and MACD scans can give you the edge you need: [Insert Link]
Learn how to combine these powerful indicators and make more informed trading decisions. Don't miss out on this valuable trading insight! 💰💼
#investing#finance#investors#stock market#trade#tradingtools#intraday trading#market insights#profit#stockcharts#investments#investment#financial planning#investing stocks#financial#income#stockmarket#stock selection#stocks
0 notes
Text
What is The SuperTrend Indicator
Discover the power of the SuperTrend Indicator, a cutting-edge tool in the world of trading. Trading Fuel brings you an insightful guide on how this popular technical analysis tool helps traders identify trends and make informed decisions. Learn how to leverage the SuperTrend Indicator to enhance your trading strategies and stay ahead in today's dynamic financial markets. Unlock the potential of this powerful tool with Trading Fuel's comprehensive analysis and expert tips.
0 notes
Last Seen Blogs