#data visualization with D3.js
Explore tagged Tumblr posts
Visit Tumblr Blog
Explore Tumblr blogs with no restrictions, modern design and the best experience.
Last Seen Tumblr Blogs


Fun Fact
There are dozens of funny blogs to kill time on Tumblr.
Text

Unlock the power of interactive data visualization with D3.js! From complex datasets to visually engaging graphics, D3.js makes it possible to craft dynamic, user-friendly visual experiences. Want to level up your data visualization skills? Check out our latest blog! Read more: https://bit.ly/40Y7Mjy
0 notes
Text
Unleashing the Potential: Dynamic Data Visualizations with D3.js in React Applications

In the era of data-driven decision-making, the ability to present information in a visually captivating and interactive manner is invaluable. React, the popular JavaScript library for building user interfaces, becomes even more powerful when integrated with D3.js, a versatile data visualization library. By combining React's flexibility and component-based structure with D3.js's rich visualization capabilities, developers can create stunning and dynamic data visualizations that captivate audiences. In this article, we will explore the seamless integration of D3.js with React, unlocking a world of possibilities for creating compelling and engaging data visualizations in your React applications.
1. Understanding D3.js:
D3.js, or Data-Driven Documents, is a comprehensive JavaScript library that provides an extensive toolkit for creating dynamic and interactive data visualizations. Built on web standards like HTML, SVG, and CSS, D3.js empowers developers to transform raw data into meaningful visual representations using a wide range of powerful features and techniques.
2. Integrating D3.js with React:
To leverage the full potential of D3.js in your React applications, follow these key steps for seamless integration:
a. Installing and configuring D3.js:
Begin by installing D3.js as a dependency in your React project using package managers like npm or yarn. Then, import the necessary D3 modules into your React components to make them accessible within your application.
b. Harnessing React's lifecycle methods:
React's lifecycle methods, such as `componentDidMount` and `componentDidUpdate`, play a crucial role in integrating D3.js functionality. These methods allow you to initialize and update D3.js visualizations within your React components at the appropriate times.
c. Harmonizing React's Virtual DOM with D3.js:
React manages the rendering through its Virtual DOM, while D3.js manipulates the actual DOM. To ensure compatibility, use React's `ref` attribute to select and manipulate DOM elements directly using D3.js.
d. Data binding and updates:
D3.js's strength lies in its ability to bind data to visual elements dynamically. Take advantage of D3.js's data-driven approach to bind data to React components, facilitating seamless updates and transitions as the data changes.
3. Unleashing the Synergy of React and D3.js:
By combining React and D3.js, developers can leverage the best of both worlds to create powerful, interactive, and scalable data visualizations:
a. Interactive and responsive visualizations:
React's component-based architecture, combined with D3.js's interactivity and event handling capabilities, enables the creation of highly interactive and responsive visualizations. Users can engage with the visualizations, enhancing their understanding of complex data.
b. Effortless updates and animations:
React's Virtual DOM, coupled with D3.js's transitions, facilitates smooth updates and animations as data changes. This dynamic rendering ensures that visualizations remain up to date and visually pleasing.
c. Customization and reusability:
D3.js offers extensive customization options, enabling developers to create visually stunning and tailored visualizations. By integrating D3.js with React's modular architecture, visualizations can be encapsulated into reusable components, promoting scalability and code reusability.
Benefits of Using D3.js with React
Using D3.js with React offers several significant benefits for developers looking to create dynamic and interactive data visualizations. Let's explore the advantages of integrating D3.js with React:
1. Powerful Data Visualization Capabilities:
D3.js is a highly versatile and comprehensive data visualization library. By combining it with React, developers can leverage D3.js's extensive range of features, such as data binding, scales, transitions, and interactive elements. This combination empowers developers to create visually stunning and meaningful data visualizations that effectively convey complex information.
2. Component-Based Architecture:
React's component-based architecture aligns well with D3.js's modular approach. Developers can encapsulate D3.js visualizations into reusable React components, making it easier to manage and maintain complex visualizations. React's component reusability promotes code efficiency and scalability, enabling developers to create a library of customizable visualization components.
3. Seamless Integration:
React's flexibility and lifecycle methods allow for seamless integration with D3.js. Developers can leverage React's lifecycle methods, such as `componentDidMount` and `componentDidUpdate`, to initialize and update D3.js visualizations at the appropriate times. This integration ensures smooth rendering and data updates, providing a seamless user experience.
4. Virtual DOM and Efficient Rendering:
React's Virtual DOM optimizes rendering performance by updating only the necessary components when the underlying data changes. By integrating D3.js with React, developers can take advantage of this efficient rendering process. React's reconciliation algorithm ensures that only the affected components are re-rendered, resulting in improved performance and responsiveness for data visualizations.
5. Enhanced Interactivity:
React's event handling capabilities combined with D3.js's interactive features enable developers to create engaging and interactive data visualizations. React's state management allows for dynamic updates and interactions with the visualizations, providing a seamless and interactive user experience. Users can interact with the visualizations, explore data, and gain insights in a more intuitive and engaging way.
6. Robust Ecosystem and Community Support:
Both React and D3.js have vibrant communities and extensive ecosystems. By integrating D3.js with React, developers can tap into a wealth of resources, tutorials, and community-driven libraries. This support system provides developers with valuable insights, best practices, and tools to create high-quality data visualizations efficiently.
Conclusion: Integrating D3.js with React empowers developers to create dynamic and visually captivating data visualizations within their applications. By combining React's flexibility, component-based structure, and state management with D3.js's powerful data manipulation and visualization capabilities, developers can convey complex information effectively and engage users through interactive visual experiences. So, dive into the world of data visualization with React and D3.js, and elevate your React applications with stunning and meaningful visual representations of data.
#Integrating D3.js with React#react d3#using d3.js in react#data visualization with React and D3.js#d3.js#react application
0 notes
Text
Exploring the Powerhouse: 30 Must-Know JavaScript Libraries and Frameworks for Web Development
React.js: A declarative, efficient, and flexible JavaScript library for building user interfaces.
Angular.js (Angular): A web application framework maintained by Google, used for building dynamic, single-page web applications.
Vue.js: A progressive JavaScript framework for building user interfaces. It is incrementally adaptable and can be integrated into other projects.
Node.js: A JavaScript runtime built on Chrome's V8 JavaScript engine that enables server-side JavaScript development.
Express.js: A web application framework for Node.js that simplifies the process of building web applications.
jQuery: A fast, small, and feature-rich JavaScript library that simplifies HTML document traversal and manipulation, event handling, and animation.
D3.js: A powerful library for creating data visualizations using HTML, SVG, and CSS.
Three.js: A cross-browser JavaScript library and application programming interface (API) used to create and display animated 3D computer graphics in a web browser.
Redux: A predictable state container for JavaScript apps, often used with React for managing the state of the application.
Next.js: A React framework for building server-side rendered and statically generated web applications.
Svelte: A radical new approach to building user interfaces. It shifts the work from the browser to the build step, resulting in smaller, faster applications.
Electron: A framework for building cross-platform desktop applications using web technologies such as HTML, CSS, and JavaScript.
RxJS: A library for reactive programming using Observables, making it easier to compose asynchronous or callback-based code.
Webpack: A module bundler for JavaScript applications. It takes modules with dependencies and generates static assets representing those modules.
Babel: A JavaScript compiler that allows developers to use the latest ECMAScript features by transforming them into browser-compatible JavaScript.
Jest: A JavaScript testing framework designed to ensure the correctness of your code.
Mocha: A feature-rich JavaScript test framework running on Node.js and in the browser.
Chai: A BDD/TDD assertion library for Node.js and the browser that can be paired with any testing framework.
Lodash: A modern JavaScript utility library delivering modularity, performance, and extras.
Socket.io: A library that enables real-time, bidirectional, and event-based communication between web clients and servers.
GraphQL: A query language for APIs and a runtime for executing those queries with your existing data.
Axios: A promise-based HTTP client for the browser and Node.js, making it easy to send asynchronous HTTP requests.
Jasmine: A behavior-driven development framework for testing JavaScript code.
Meteor.js: A full-stack JavaScript platform for developing modern web and mobile applications.
Gatsby.js: A modern website framework that builds performance into every website by leveraging the latest web technologies.
Chart.js: A simple yet flexible JavaScript charting library for designers and developers.
Ember.js: A JavaScript framework for building web applications, with a focus on productivity and convention over configuration.
Nuxt.js: A framework for creating Vue.js applications with server-side rendering and routing.
Grunt: A JavaScript task runner that automates common tasks in the development process.
Sass (Syntactically Awesome Stylesheets): A CSS preprocessor that helps you write maintainable, scalable, and modular styles.
Remember to check each library or framework's documentation and community support for the latest information and updates.
4 notes
·
View notes
Text
The Best Open-Source Tools for Data Science in 2025

Data science in 2025 is thriving, driven by a robust ecosystem of open-source tools that empower professionals to extract insights, build predictive models, and deploy data-driven solutions at scale. This year, the landscape is more dynamic than ever, with established favorites and emerging contenders shaping how data scientists work. Here’s an in-depth look at the best open-source tools that are defining data science in 2025.
1. Python: The Universal Language of Data Science
Python remains the cornerstone of data science. Its intuitive syntax, extensive libraries, and active community make it the go-to language for everything from data wrangling to deep learning. Libraries such as NumPy and Pandas streamline numerical computations and data manipulation, while scikit-learn is the gold standard for classical machine learning tasks.
NumPy: Efficient array operations and mathematical functions.
Pandas: Powerful data structures (DataFrames) for cleaning, transforming, and analyzing structured data.
scikit-learn: Comprehensive suite for classification, regression, clustering, and model evaluation.
Python’s popularity is reflected in the 2025 Stack Overflow Developer Survey, with 53% of developers using it for data projects.
2. R and RStudio: Statistical Powerhouses
R continues to shine in academia and industries where statistical rigor is paramount. The RStudio IDE enhances productivity with features for scripting, debugging, and visualization. R’s package ecosystem—especially tidyverse for data manipulation and ggplot2 for visualization—remains unmatched for statistical analysis and custom plotting.
Shiny: Build interactive web applications directly from R.
CRAN: Over 18,000 packages for every conceivable statistical need.
R is favored by 36% of users, especially for advanced analytics and research.
3. Jupyter Notebooks and JupyterLab: Interactive Exploration
Jupyter Notebooks are indispensable for prototyping, sharing, and documenting data science workflows. They support live code (Python, R, Julia, and more), visualizations, and narrative text in a single document. JupyterLab, the next-generation interface, offers enhanced collaboration and modularity.
Over 15 million notebooks hosted as of 2025, with 80% of data analysts using them regularly.
4. Apache Spark: Big Data at Lightning Speed
As data volumes grow, Apache Spark stands out for its ability to process massive datasets rapidly, both in batch and real-time. Spark’s distributed architecture, support for SQL, machine learning (MLlib), and compatibility with Python, R, Scala, and Java make it a staple for big data analytics.
65% increase in Spark adoption since 2023, reflecting its scalability and performance.
5. TensorFlow and PyTorch: Deep Learning Titans
For machine learning and AI, TensorFlow and PyTorch dominate. Both offer flexible APIs for building and training neural networks, with strong community support and integration with cloud platforms.
TensorFlow: Preferred for production-grade models and scalability; used by over 33% of ML professionals.
PyTorch: Valued for its dynamic computation graph and ease of experimentation, especially in research settings.
6. Data Visualization: Plotly, D3.js, and Apache Superset
Effective data storytelling relies on compelling visualizations:
Plotly: Python-based, supports interactive and publication-quality charts; easy for both static and dynamic visualizations.
D3.js: JavaScript library for highly customizable, web-based visualizations; ideal for specialists seeking full control.
Apache Superset: Open-source dashboarding platform for interactive, scalable visual analytics; increasingly adopted for enterprise BI.
Tableau Public, though not fully open-source, is also popular for sharing interactive visualizations with a broad audience.
7. Pandas: The Data Wrangling Workhorse
Pandas remains the backbone of data manipulation in Python, powering up to 90% of data wrangling tasks. Its DataFrame structure simplifies complex operations, making it essential for cleaning, transforming, and analyzing large datasets.
8. Scikit-learn: Machine Learning Made Simple
scikit-learn is the default choice for classical machine learning. Its consistent API, extensive documentation, and wide range of algorithms make it ideal for tasks such as classification, regression, clustering, and model validation.
9. Apache Airflow: Workflow Orchestration
As data pipelines become more complex, Apache Airflow has emerged as the go-to tool for workflow automation and orchestration. Its user-friendly interface and scalability have driven a 35% surge in adoption among data engineers in the past year.
10. MLflow: Model Management and Experiment Tracking
MLflow streamlines the machine learning lifecycle, offering tools for experiment tracking, model packaging, and deployment. Over 60% of ML engineers use MLflow for its integration capabilities and ease of use in production environments.
11. Docker and Kubernetes: Reproducibility and Scalability
Containerization with Docker and orchestration via Kubernetes ensure that data science applications run consistently across environments. These tools are now standard for deploying models and scaling data-driven services in production.
12. Emerging Contenders: Streamlit and More
Streamlit: Rapidly build and deploy interactive data apps with minimal code, gaining popularity for internal dashboards and quick prototypes.
Redash: SQL-based visualization and dashboarding tool, ideal for teams needing quick insights from databases.
Kibana: Real-time data exploration and monitoring, especially for log analytics and anomaly detection.
Conclusion: The Open-Source Advantage in 2025
Open-source tools continue to drive innovation in data science, making advanced analytics accessible, scalable, and collaborative. Mastery of these tools is not just a technical advantage—it’s essential for staying competitive in a rapidly evolving field. Whether you’re a beginner or a seasoned professional, leveraging this ecosystem will unlock new possibilities and accelerate your journey from raw data to actionable insight.
The future of data science is open, and in 2025, these tools are your ticket to building smarter, faster, and more impactful solutions.
#python#r#rstudio#jupyternotebook#jupyterlab#apachespark#tensorflow#pytorch#plotly#d3js#apachesuperset#pandas#scikitlearn#apacheairflow#mlflow#docker#kubernetes#streamlit#redash#kibana#nschool academy#datascience
0 notes
Text
What are Data Visualization Consulting Services and how can they benefit businesses?
Data Visualization Consulting Services help organizations convert complex data into visual formats that are easier to understand and analyze. These services offer:
Custom dashboard creation using tools like Power BI, Tableau, or D3.js
Data storytelling to highlight key insights for decision-makers
Interactive reports that allow real-time exploration of business metrics
Integration with data sources such as databases, CRMs, or cloud platforms
Performance optimization for large-scale data sets
Conclusion: By using Data Visualization Consulting Services, businesses can make faster, data-driven decisions, improve communication across teams, and identify trends or risks with clarity.
0 notes
Text
Top Reasons Why Your Business Should Hire a Data Visualization Consulting Company
The role of a data visualization consulting company has sparked the way businesses need to thrive in today’s data-driven world. Do you also look for the same for your venture? Before getting in, let’s explore the types of advantages you are likely to conclude with professional data consultants.
Undeniably, businesses generate and collect massive amounts of data and information daily. Organizing customer behavior analytics, marketing metrics, operational performance and financial forecasts can be tricky and overwhelming.
However, do you know the real challenge? It isn’t just collecting data! It’s making sense of it. Professional data visualization consulting companies bring the right approach in place to support businesses across dimensions.
Advantages of Working with a Professional Data Visualization Consulting Company
These specialized firms help businesses across many spheres. They help transform raw data into clear and compelling visuals to deliver actionable insights. These experts are productive for both a start-up or an established enterprise alike. Here is how:
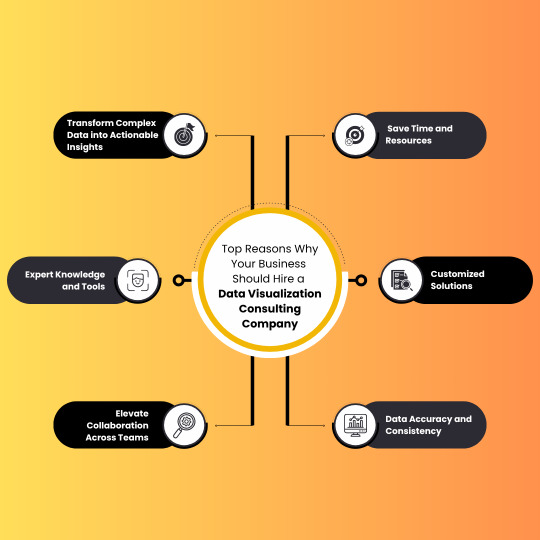
They Transform Complex Data into Actionable Insights
Raw data seems rarely fruitful in spreadsheets or databases at first glance. Data engineering consultants generate charts, graphs, dashboards, and interactive visuals using numbers and information. It makes information accessible and understandable.
Ultimately, it helps decision-makers to identify trends quickly, detect anomalies, monitor KPIs in real time and make informed business decisions.
They Help Save Time and Resources
Generating meaningful data visualizations needs both technical expertise and design sensibility. It requires time as well which most internal teams may not have in abundance.
A professional consulting company showcases ready-made tools, frameworks, and experienced specialists who can deliver high-quality work efficiently. Businesses are likely to reduce the learning curve for internal staff and focus on core operations.
Access to Expert Knowledge and Tools
Knowledge is the key! Professional consultants specialize in platforms like Tableau, Power BI, Looker, D3.js, and more. At the same time, they stay updated with the latest features and best practices. They produce visualizations that are not just pretty, but also technically accurate and optimized for your data infrastructure.
They Offer Customized Solutions for Unique Business Needs
Further, every business comes with its own set of unique data challenges. A data visualization consulting organization pushes customized solutions that align with your goals, industry, and users. For instance, a SaaS company could benefit from user engagement trend analysis. Thankfully, consultants invest time in understanding your business model and tailoring visualizations accordingly.
They Elevate Collaboration Across Teams
With visualization, data becomes a universal language. It can be understood by everyone in the company, regardless of technical expertise. Eventually, sales, marketing, finance, operations, and executive teams can all interpret the same visuals and collaborate more effectively. Interactive dashboards further pass the power to users to explore data on their own and foster curiosity and innovation.
They Ensure Data Accuracy and Consistency
Poor visualizations can misrepresent data. It can further lead to bad decisions and affect the overall performance adversely. Marketing analytics consulting services follow established data storytelling principles. They maintain high standards for accuracy and consistency. This reduces the risk of misinformation and builds trust in the data across the organization.
Scalability and Future-Readiness
As your business grows, so does your data complexity. A data visualization consulting company doesn’t just solve immediate problems. They help future-proof your analytics infrastructure.
This long-term vision ensures your investment in data visualization continues to deliver value as your business evolves.
Conclusion
Needless to say, data visualization is no longer a luxury in the present competitive business environment. It's a necessity for modern business decision-making. Therefore, hiring a data visualization consulting company empowers organizations to unlock the full potential of their data.
These professional firms bring enormous benefits to enterprises. They help save time, improve accuracy and drive strategic insights. Whether you're struggling with messy spreadsheets or trying to communicate insights across departments, a consulting partner can bridge the gap between data and action. In a world where data is power, visualizing it effectively could be your biggest competitive advantage.Looking forward to hiring a reputed data consulting company for your business? Get in touch with Kaliper to grab comprehensive digital solutions. It helps organizations elevate business to new heights and explore unique prospects.
0 notes
Text
From Tableau Extensions to Power BI Custom Visuals: Bridging the Gap
In the fast-paced world of business intelligence, customization plays a pivotal role in delivering actionable insights. Tableau and Power BI—two of the leading BI platforms—both support extensibility through custom components. Tableau offers Extensions that allow developers to enhance dashboards with external applications, while Power BI supports Custom Visuals that extend the visual capabilities beyond default chart types. When migrating from Tableau to Power BI, organizations often face a major question: how do we bridge the gap between Tableau Extensions and Power BI Custom Visuals?
Understanding the Landscape
Tableau Extensions are web-based applications that interact with dashboards using the Extensions API. They are ideal for integrating third-party tools, performing write-back capabilities, or adding tailored user experiences within Tableau dashboards.
On the other hand, Power BI Custom Visuals are open-source visual components built using TypeScript and D3.js or React. They are embedded within Power BI reports and serve to visualize data in innovative ways not available by default.
Though both platforms support custom development, their architectures and ecosystems are quite different. This creates a challenge when migrating, as Tableau Extensions cannot be simply ported into Power BI. A strategic, well-informed approach is essential.
Key Differences That Matter
Technology Stack: Tableau uses JavaScript and relies heavily on iframe-based web integration, whereas Power BI Custom Visuals require knowledge of TypeScript, D3, or React. This often means upskilling teams or outsourcing development during migration.
Integration Scope: Extensions in Tableau can pull or push data from external sources, while Power BI Custom Visuals are sandboxed with limited external data interaction. However, Power BI’s architecture emphasizes data security and controlled deployment through AppSource.
Deployment & Sharing: In Tableau, Extensions are embedded directly in dashboards with fewer restrictions. In Power BI, custom visuals must be certified to be listed in AppSource, or they need to be deployed through organizational visuals, requiring IT governance.
Bridging the Gap: A Strategic Approach
To ensure a smooth transition, the migration strategy should focus on business continuity and usability. The following steps can help organizations bridge the customization gap effectively:
Inventory Custom Components: Start by identifying all Tableau Extensions in use and mapping them to equivalent or similar Power BI visuals, either from AppSource or through custom development.
Leverage Power BI SDKs: Microsoft provides detailed documentation and sample projects to help developers build custom visuals. Utilizing these tools can speed up the conversion process.
Prioritize Based on Impact: Not every Tableau Extension may be critical. Focus on high-impact, business-critical extensions that are essential for decision-making.
Use AI-Powered Tools: Solutions like Pulse Convert (developed by OfficeSolution) accelerate the migration process, ensuring seamless translation of dashboards and visuals with up to 99% accuracy.
Train Your Team: Equip your analysts and developers with the necessary Power BI skills to maintain and evolve custom visuals post-migration.
The Future Is Interoperable
With the growing focus on interoperability and flexibility in BI, organizations must adopt a platform-agnostic mindset. Migrating from Tableau Extensions to Power BI Custom Visuals is not just a technical task—it’s a strategic opportunity to modernize your analytics environment.
For businesses looking to make this shift, OfficeSolution’s expert-led services and AI-powered tools provide the guidance and automation necessary for a seamless experience. Visit https://tableautopowerbimigration.com/ to learn more and begin your journey.
0 notes
Link
0 notes
Text
Services in Web Development – NextGen2AI
Empowering Digital Innovation with Intelligent Web Solutions
At NextGen2AI, we don’t just build websites—we engineer intelligent digital experiences that shape the future. Our web development services combine cutting-edge design with AI-powered functionality to help businesses grow, adapt, and thrive online.
Here’s a closer look at the wide range of web development services we offer:
1. Custom Website Development
We build responsive, scalable websites tailored to your brand and goals. Whether it's a corporate site, landing page, or portfolio, our custom designs ensure top-notch performance and user experience.
Features:
Mobile-first, responsive design
SEO-ready structure
Fast loading & optimized performance
2. AI-Integrated Web Applications
Harness the power of machine learning, natural language processing, and predictive analytics to create smart web applications that learn, adapt, and respond.
Use Cases:
Smart chatbots
Personalized content delivery
Intelligent recommendations
3. Frontend Development
Our frontend team creates sleek, interactive user interfaces using the latest technologies like React, Angular, and Vue.js.
Key Benefits:
Enhanced UX/UI
Real-time interactivity
Clean, modern design
4. Backend Development & APIs
We build powerful backend systems that ensure seamless operations, data processing, and secure integrations.
Technologies:
Node.js, Python, PHP
REST & GraphQL APIs
Secure authentication systems
5. E-Commerce Development
Boost your online business with scalable, user-friendly e-commerce solutions powered by AI for product suggestions, smart search, and personalized shopping experiences.
Platforms:
Shopify
WooCommerce
Custom-built e-commerce platforms
6. CMS Solutions
We deliver flexible, easy-to-manage websites using content management systems like WordPress, Webflow, or custom CMS tools.
Highlights:
No-code or low-code editing
Role-based content control
Blog, news, and media management
7. Data Visualization Dashboards
Our web dashboards bring data to life—helping businesses make decisions based on real-time insights through interactive graphs and AI analytics.
Tools We Use:
Chart.js, D3.js
Power BI integration
Custom dashboards with Python/JS
8. Progressive Web Apps (PWAs)
We develop web apps that work offline, load instantly, and feel like native mobile apps—perfect for improving reach and performance.
Why Choose NextGen2AI?
AI-First Approach Customized Development Scalable & Secure Systems End-to-End Support
Ready to Elevate Your Digital Presence?
Let NextGen2AI help you build future-proof web experiences. Whether you're a startup or an enterprise, our web development services will transform your ideas into intelligent, engaging platforms.
🔗 Visit us: Next Gen2AI
0 notes
Text
Why Modern Businesses Must Hire Data Scientists To Stay Ahead
In today's data-driven world, every click, transaction, and customer interaction holds value. But unlocking that value requires more than just technology—it demands the right people who can transform raw data into strategic decisions. That’s where the need to hire data scientists becomes not just an option, but a necessity for forward-thinking businesses.
From startups to Fortune 500 companies, organizations are investing heavily in data science talent to gain a competitive edge. But what exactly makes data scientists so essential in this digital era? And how can businesses ensure they’re hiring the right experts?
Let’s dive deep into the world of data science, understand its growing importance, and explore how hiring data scientists can radically reshape your business outcomes.
Understanding The Role Of A Data Scientist
A data scientist is not just a statistician or a coder—they are problem solvers, storytellers, and strategists rolled into one. Their core responsibility is to extract actionable insights from massive datasets using a mix of programming, mathematics, machine learning, and business knowledge.
Here’s what a skilled data scientist typically does:
Collects and cleans data from multiple sources.
Analyzes patterns and trends that affect business performance.
Builds predictive models using machine learning algorithms.
Creates data visualizations to communicate complex findings.
Works with decision-makers to implement data-driven strategies.
In essence, they act as a bridge between data and business strategy.
Why Businesses Are Racing To Hire Data Scientists
The sheer volume of data available today is both a blessing and a challenge. With so much information at your fingertips, knowing what to do with it is where the real value lies.
Here are the top reasons why companies are scrambling to hire data scientists:
1. Data-Driven Decision Making
Gut instinct doesn’t cut it anymore. Businesses now rely on data to guide everything from product development to marketing campaigns. Data scientists help decode customer behavior, forecast trends, and identify areas of improvement using real-time analytics.
2. Improved Operational Efficiency
By analyzing internal workflows and system performance, data scientists can identify bottlenecks, inefficiencies, and cost leaks. This enables organizations to streamline operations and boost productivity.
3. Customer Personalization
Ever wondered how Netflix recommends shows or how Amazon knows what you want to buy next? That’s the magic of data science. Personalization algorithms powered by data scientists enhance customer experience and increase engagement.
4. Fraud Detection & Risk Management
In sectors like banking, insurance, and e-commerce, fraud detection is paramount. Data scientists use advanced algorithms to detect suspicious patterns and flag them before any real damage is done.
5. Gaining A Competitive Edge
In saturated markets, data-driven strategies help companies differentiate themselves. By harnessing data insights, brands can innovate faster, respond to customer needs quicker, and outmaneuver competitors.
Key Skills To Look For When You Hire Data Scientists
Finding the right data scientist is not just about hiring someone with a PhD in statistics. The ideal candidate blends technical expertise with business acumen.
Here’s a list of essential skills you should look for:
Technical Skills:
Proficiency in Programming Languages like Python, R, or Scala
Expertise in Machine Learning Frameworks such as TensorFlow, Scikit-learn
Strong Statistical Knowledge
Database Management (SQL, NoSQL)
Data Visualization Tools like Tableau, Power BI, or D3.js
Soft Skills:
Critical Thinking to interpret complex data
Communication Skills to present findings to non-technical teams
Problem-Solving Ability for tackling ambiguous business problems
Collaboration across departments like marketing, product, and engineering
In-House vs. Freelance vs. Outsourcing: What’s The Right Hiring Model?
The way you hire data scientists will depend on your business model, budget, and specific project needs. Here’s a quick comparison:
1. In-House Hiring
Ideal for large enterprises or data-first companies.
Pros: Long-term commitment, deeper understanding of business, consistent output.
Cons: Higher salary costs, longer hiring process.
2. Freelancers
Suitable for short-term projects or startups.
Pros: Cost-effective, flexible, access to global talent.
Cons: Less accountability, limited availability.
3. Outsourcing Agencies
Great for businesses without internal tech expertise.
Pros: Turnkey solutions, expert teams, scalability.
Cons: Less control over process, potential communication gaps.
Whatever path you choose, it’s crucial to have a clear understanding of your objectives before onboarding data science talent.
Common Hiring Mistakes To Avoid
When businesses rush to hire data scientists, they often fall into some common traps. Here are a few to watch out for:
1. Ignoring Business Context
Hiring someone with technical chops but no understanding of your industry can lead to mismatched expectations and underwhelming results.
2. Underestimating The Learning Curve
Even experienced data scientists need time to familiarize themselves with your data infrastructure. Don’t expect instant results.
3. Lack of Clear KPIs
Without defining what success looks like, it’s hard to measure impact. Always set performance goals and evaluation metrics upfront.
4. Neglecting Team Integration
Data science can’t function in a silo. Ensure your hire can collaborate across departments and communicate effectively.
The Cost Of Hiring Data Scientists
Salaries for data scientists vary based on geography, experience, and skill set. Here’s a rough breakdown:
RoleAverage Annual Salary (US)Entry-Level Data Scientist$85,000 – $110,000Mid-Level Data Scientist$110,000 – $140,000Senior Data Scientist$140,000 – $180,000+
Freelancers might charge anywhere from $50 to $200 per hour depending on their expertise and scope of work.
While it may seem like a hefty investment, the ROI from actionable insights, increased efficiency, and innovation more than makes up for the cost.
Industries That Can Benefit Most
While virtually every sector can gain value from data science, here are some that benefit the most:
Healthcare: Predictive modeling for patient outcomes and resource optimization.
Finance: Risk modeling, fraud detection, and algorithmic trading.
Retail & E-commerce: Inventory forecasting, customer segmentation, and personalization.
Logistics: Route optimization and demand prediction.
Marketing: Campaign analytics and customer lifetime value modeling.
Building A Data-Driven Culture
Hiring a data scientist isn’t a silver bullet. For maximum impact, businesses must foster a data-first culture across all levels. This means:
Encouraging curiosity and data literacy.
Training teams to ask the right questions.
Investing in data infrastructure and governance.
Promoting transparency in how data is used.
When everyone understands and respects the power of data, the entire organization becomes more agile and responsive.
Final Thoughts: Data Is The New Currency
We live in a time where data is more valuable than oil. But like crude oil, it must be refined to extract its true worth. That’s the job of a data scientist.
Choosing to hire data scientists today is a step toward building a smarter, faster, and more resilient business. Whether you're a startup looking to uncover customer trends or an enterprise aiming to optimize operations, the insights that data scientists provide can make the difference between surviving and thriving.
So, don’t treat data science as a luxury. It’s a necessity. Invest wisely in talent, and watch your data evolve from a collection of numbers into a compass that guides your every move
0 notes
Text
Master Building Data Visualizations in Vue.js with D3.js
Building Data Visualizations in Vue.js with D3.js 1. Introduction 1.1 Brief Explanation Data visualizations are crucial for transforming raw data into actionable insights. By combining Vue.js, a progressive and flexible frontend framework, with D3.js, a powerful data visualization library, developers can create dynamic and interactive visualizations. This tutorial will guide you through the…
0 notes
Text
Why Modern Businesses Must Hire Data Scientists To Stay Ahead
In today's data-driven world, every click, transaction, and customer interaction holds value. But unlocking that value requires more than just technology—it demands the right people who can transform raw data into strategic decisions. That’s where the need to hire data scientists becomes not just an option, but a necessity for forward-thinking businesses.
From startups to Fortune 500 companies, organizations are investing heavily in data science talent to gain a competitive edge. But what exactly makes data scientists so essential in this digital era? And how can businesses ensure they’re hiring the right experts?
Let’s dive deep into the world of data science, understand its growing importance, and explore how hiring data scientists can radically reshape your business outcomes.
Understanding The Role Of A Data Scientist
A data scientist is not just a statistician or a coder—they are problem solvers, storytellers, and strategists rolled into one. Their core responsibility is to extract actionable insights from massive datasets using a mix of programming, mathematics, machine learning, and business knowledge.
Here’s what a skilled data scientist typically does:
Collects and cleans data from multiple sources.
Analyzes patterns and trends that affect business performance.
Builds predictive models using machine learning algorithms.
Creates data visualizations to communicate complex findings.
Works with decision-makers to implement data-driven strategies.
In essence, they act as a bridge between data and business strategy.
Why Businesses Are Racing To Hire Data Scientists
The sheer volume of data available today is both a blessing and a challenge. With so much information at your fingertips, knowing what to do with it is where the real value lies.
Here are the top reasons why companies are scrambling to hire data scientists:
1. Data-Driven Decision Making
Gut instinct doesn’t cut it anymore. Businesses now rely on data to guide everything from product development to marketing campaigns. Data scientists help decode customer behavior, forecast trends, and identify areas of improvement using real-time analytics.
2. Improved Operational Efficiency
By analyzing internal workflows and system performance, data scientists can identify bottlenecks, inefficiencies, and cost leaks. This enables organizations to streamline operations and boost productivity.
3. Customer Personalization
Ever wondered how Netflix recommends shows or how Amazon knows what you want to buy next? That’s the magic of data science. Personalization algorithms powered by data scientists enhance customer experience and increase engagement.
4. Fraud Detection & Risk Management
In sectors like banking, insurance, and e-commerce, fraud detection is paramount. Data scientists use advanced algorithms to detect suspicious patterns and flag them before any real damage is done.
5. Gaining A Competitive Edge
In saturated markets, data-driven strategies help companies differentiate themselves. By harnessing data insights, brands can innovate faster, respond to customer needs quicker, and outmaneuver competitors.
Key Skills To Look For When You Hire Data Scientists
Finding the right data scientist is not just about hiring someone with a PhD in statistics. The ideal candidate blends technical expertise with business acumen.
Here’s a list of essential skills you should look for:
Technical Skills:
Proficiency in Programming Languages like Python, R, or Scala
Expertise in Machine Learning Frameworks such as TensorFlow, Scikit-learn
Strong Statistical Knowledge
Database Management (SQL, NoSQL)
Data Visualization Tools like Tableau, Power BI, or D3.js
Soft Skills:
Critical Thinking to interpret complex data
Communication Skills to present findings to non-technical teams
Problem-Solving Ability for tackling ambiguous business problems
Collaboration across departments like marketing, product, and engineering
In-House vs. Freelance vs. Outsourcing: What’s The Right Hiring Model?
The way you hire data scientists will depend on your business model, budget, and specific project needs. Here’s a quick comparison:
1. In-House Hiring
Ideal for large enterprises or data-first companies.
Pros: Long-term commitment, deeper understanding of business, consistent output.
Cons: Higher salary costs, longer hiring process.
2. Freelancers
Suitable for short-term projects or startups.
Pros: Cost-effective, flexible, access to global talent.
Cons: Less accountability, limited availability.
3. Outsourcing Agencies
Great for businesses without internal tech expertise.
Pros: Turnkey solutions, expert teams, scalability.
Cons: Less control over process, potential communication gaps.
Whatever path you choose, it’s crucial to have a clear understanding of your objectives before onboarding data science talent.
Common Hiring Mistakes To Avoid
When businesses rush to hire data scientists, they often fall into some common traps. Here are a few to watch out for:
1. Ignoring Business Context
Hiring someone with technical chops but no understanding of your industry can lead to mismatched expectations and underwhelming results.
2. Underestimating The Learning Curve
Even experienced data scientists need time to familiarize themselves with your data infrastructure. Don’t expect instant results.
3. Lack of Clear KPIs
Without defining what success looks like, it’s hard to measure impact. Always set performance goals and evaluation metrics upfront.
4. Neglecting Team Integration
Data science can’t function in a silo. Ensure your hire can collaborate across departments and communicate effectively.
The Cost Of Hiring Data Scientists
Salaries for data scientists vary based on geography, experience, and skill set. Here’s a rough breakdown: RoleAverage Annual Salary (US)Entry-Level Data Scientist$85,000 – $110,000Mid-Level Data Scientist$110,000 – $140,000Senior Data Scientist$140,000 – $180,000+
Freelancers might charge anywhere from $50 to $200 per hour depending on their expertise and scope of work.
While it may seem like a hefty investment, the ROI from actionable insights, increased efficiency, and innovation more than makes up for the cost.
Industries That Can Benefit Most
While virtually every sector can gain value from data science, here are some that benefit the most:
Healthcare: Predictive modeling for patient outcomes and resource optimization.
Finance: Risk modeling, fraud detection, and algorithmic trading.
Retail & E-commerce: Inventory forecasting, customer segmentation, and personalization.
Logistics: Route optimization and demand prediction.
Marketing: Campaign analytics and customer lifetime value modeling.
Building A Data-Driven Culture
Hiring a data scientist isn’t a silver bullet. For maximum impact, businesses must foster a data-first culture across all levels. This means:
Encouraging curiosity and data literacy.
Training teams to ask the right questions.
Investing in data infrastructure and governance.
Promoting transparency in how data is used.
When everyone understands and respects the power of data, the entire organization becomes more agile and responsive.
Final Thoughts: Data Is The New Currency
We live in a time where data is more valuable than oil. But like crude oil, it must be refined to extract its true worth. That’s the job of a data scientist.
Choosing to hire data scientists today is a step toward building a smarter, faster, and more resilient business. Whether you're a startup looking to uncover customer trends or an enterprise aiming to optimize operations, the insights that data scientists provide can make the difference between surviving and thriving.
So, don’t treat data science as a luxury. It’s a necessity. Invest wisely in talent, and watch your data evolve from a collection of numbers into a compass that guides your every move.
0 notes
Text

📊 Struggling with Your COMP 7016 Visualisation Assignment? We Can Help!
Are you a Western Sydney University student feeling overwhelmed by data visualization concepts, tools like Tableau, D3.js, or Python libraries? Don’t worry—our experts are here to guide you!
✅ Customized help with charts, dashboards & interactive visualizations
✅ Expert support for Tableau, Matplotlib, Plotly, and more
✅ Clear explanations to boost your understanding & grades
📩 Message us now for professional assistance!
#COMP7016 #WSU #DataVisualization #AssignmentHelp #WesternSydneyUniversity #StudentSupport #UniLife
0 notes
Text
The Best Data Visualization Techniques and Tools for Strategic Decision-Making
In the age of big data and real-time analytics, the ability to extract insights and communicate them clearly is paramount. Data visualization has emerged as a mission-critical function for business leaders, analysts, and strategists across all industries. But with an abundance of tools, techniques, and design frameworks available, identifying the best data visualization practices is essential for effective decision-making.
This guide explores the most impactful data visualization methods, best-in-class tools, and professional standards to elevate your organization's data strategy in 2025 and beyond.
What is Data Visualization?
Data visualization is the graphical representation of information and data through visual elements such as charts, graphs, infographics, and interactive dashboards. It enables stakeholders to interpret complex datasets, discover trends, and make data-driven decisions with clarity and speed.
High-quality visualizations transform abstract numbers into actionable intelligence, aligning decision-makers across departments and accelerating strategic outcomes.
Why Data Visualization is a Strategic Priority
As organizations generate massive volumes of structured and unstructured data, traditional reporting methods fall short. The best data visualization practices offer significant advantages:
Clarity – Translate complex analytics into digestible visual narratives.
Speed – Enable faster comprehension of trends, anomalies, and correlations.
Alignment – Facilitate clear communication between technical teams and executives.
Actionability – Highlight areas for improvement, opportunity, or intervention.
Engagement – Elevate stakeholder interest and retention through compelling visuals.
In an increasingly competitive landscape, companies that leverage data visualization effectively gain a measurable edge in agility and innovation.
Top Data Visualization Techniques for Business Intelligence
Professionals must select the appropriate visualization type based on the context, audience, and objective of the data. Below are some of the most effective and widely applied methods:
1. Bar and Column Charts
Ideal for comparing discrete categories or values. They are simple, versatile, and suitable for most business dashboards.
2. Line Graphs
Best for tracking changes over time. Common in financial reporting, forecasting, and operational monitoring.
3. Heatmaps
Used for identifying patterns or intensity within data sets. Often deployed in website analytics, correlation matrices, and customer behavior analysis.
4. Scatter Plots
Illustrate relationships and correlations between two variables. Useful in market research, statistical modeling, and quality control.
5. Geographic Maps
Essential for location-based data. Businesses use these to analyze regional performance, logistics networks, or demographic distributions.
6. Treemaps and Sunburst Charts
Efficient in displaying hierarchical data within a compact space. Frequently used in portfolio breakdowns and organizational data.
7. Gantt Charts
Used for project planning and tracking. Visualize tasks, timelines, dependencies, and resource allocation.
8. Interactive Dashboards
Combine multiple visualizations into a single, dynamic interface for real-time monitoring and analysis. Often employed in executive reporting and enterprise-wide KPIs.
Best Data Visualization Tools in 2025
Selecting the right tool is just as important as choosing the right chart. Here are the top-tier platforms professionals use to create powerful visualizations:
Tool
Key Strengths
Use Case Scenarios
Tableau
Enterprise-grade analytics, drag-and-drop UI
Corporate BI, executive dashboards
Microsoft Power BI
Seamless integration with Microsoft ecosystem
Internal reporting, financial data modeling
Looker (Google Cloud)
Embedded analytics, real-time metrics
Cloud-native dashboards, SaaS products
D3.js
Fully customizable via JavaScript
Advanced, interactive, web-based visualizations
Qlik Sense
Associative data model for self-service BI
Departmental analytics, ad hoc exploration
Plotly / Dash
Python-based, high-quality visuals
Scientific research, custom applications
Google Data Studio
Free and easy to use for Google users
Marketing and digital analytics
Infogram
Fast, design-driven infographics
Content marketing, reports, presentations
Best Practices for Professional Data Visualization
Even with the best tools, poor execution can undermine the message. Apply these professional best practices for optimal impact:
✅ Design for the Audience
Tailor visualizations to the data literacy level and expectations of the target audience—executives, analysts, or customers.
✅ Prioritize Clarity Over Aesthetics
Avoid unnecessary embellishments. Every design element should serve a purpose and support data interpretation.
✅ Select the Right Chart for the Right Story
Match the chart type to the analytical question: comparison, composition, distribution, or relationship.
✅ Maintain Data Integrity
Ensure that all visualizations are statistically accurate and contextually honest. Misleading scales or incomplete data can erode trust.
✅ Tell a Story with the Data
Use titles, annotations, and progressive layout to guide the viewer toward the insight—not just the image.
✅ Use Color Intelligently
Colors should highlight key insights, not distract. Stick to accessible palettes and maintain consistency across dashboards.
Industry Applications: Real-World Use Cases
📈 Financial Services
Risk analysis, portfolio monitoring, and regulatory reporting with real-time dashboards and trend visualizations.
🏥 Healthcare
Visualizing patient outcomes, clinical trials, and resource allocation for enhanced operational decisions.
🛒 Retail & E-Commerce
Sales performance tracking, inventory optimization, and customer segmentation through dynamic charts and heatmaps.
🚀 Technology & SaaS
User behavior, product engagement, and A/B test results visualized to inform product and marketing strategies.
🌍 Supply Chain & Logistics
Route optimization, delivery efficiency, and supplier performance monitored through geospatial and temporal data.
Conclusion: Elevating Strategy Through the Best Data Visualization
In an environment where speed, clarity, and precision drive results, the best data visualization practices empower businesses to harness the full potential of their data. By combining the right techniques, tools, and storytelling strategies, organizations can transform raw data into a strategic asset.
0 notes
Text
Data Visualization Developers vs. Data Analysts: Who Should You Hire for Your Project?

Data is merely numbers unless it’s understood and used as insights to yield fruitful results. In the present business context, visualizing complex information has become just as important as collecting it. As more and more tech companies are making data-driven decisions, one key question that often comes up is: should you hire data analysts or data visualization developers for your next project?
While both roles deal with data, their focus, skills, and value to your project are very different. An understanding of these differences can help you make the right hiring decisions. Let’s take a closer look at these.
Choosing the Right Expert to Turn Data Into Actionable Insights
What Data Visualization Developers Bring to the Table
When you hire data visualization developers you are bringing on professionals who specialize in transforming unprocessed datasets into interactive dashboards, reports, and visual narratives. They design and develop visual solutions that enable businesses to swiftly recognize patterns, trends, and opportunities using frameworks like D3.js, Tableau, Power BI, and JavaScript libraries.
A data visualization developer is the best option whether your project calls for creating a unique dashboard, interactive data apps, or graphic elements for a bigger platform. In order to create mobile-friendly data visualizations as part of their solution, many tech organizations who require strong front-end capabilities even pair this hire with an Indian react native developer.
Data visualization developers typically work on the following tasks:
Creating dynamic maps, graphs, and charts.
Including live updating systems and data APIs.
Making sure the visualizations are mobile-friendly and responsive.
Working together to improve the user experience with UX/UI teams.
When You Should Hire Data Analysts
Hire data analysts if you need someone to examine, clean, and understand data instead of creating visual aids. Finding trends, mining insights, and responding to business enquiries are the main goals of analysts. For data manipulation and report generation, they frequently utilize SQL, Excel, R, or Python.
When should you hire a data analyst?
You require performance summaries or monthly reports.
You're looking for hidden trends and correlations in the data.
Dashboards are not enough for your team; they also need actionable business insights.
The project doesn't need a lot of development effort because it is experimental.
When making strategic decisions based on operational indicators, client behaviour, or historical performance, a competent data analyst is crucial.
How About Hiring a Data Scientist?
If the project calls for sophisticated statistical techniques, machine learning models, or predictive analytics, you might want to hire data scientists. More in-depth than data analysts, data scientists frequently develop models that predict future events.
However, concentrating on data visualization talent is frequently the wiser course of action if your immediate objective is to display data to stakeholders, clients, or teams in an engaging, interactive manner.
Final Considerations for Tech Companies
A mix of jobs can even be needed for some projects. For example, you could engage data analysts to provide the clean, usable data, hire software developers to build the platform, and data visualization developers to provide the interactive parts.
Clarity regarding the project's scope, customer requirements, and data sources can help expanding IT organizations decide whether to put more emphasis on analytical or visualization skills first.
Final Thoughts
The objectives of your project will determine whether you should hire a data analyst or a data visualization developer. Hire data visualization developers if you require eye-catching, engaging, and useful visual representations of your data. If your primary concentration is on reporting and gaining insights, a data analyst will be more suitable.
In any case, hiring the proper specialist guarantees that your data is used to inform wise decisions and actual business expansion rather than being left useless.
0 notes
Text
Exploring Data Analytics Tools for Data Visualization
Data analytics tools for data visualization help transform complex data into intuitive visuals, enabling better insights and decision-making. Popular tools include Tableau, known for interactive dashboards; Power BI, which integrates seamlessly with Microsoft products; Google Data Studio for easy sharing and collaboration; and Looker, offering data modeling capabilities. Qlik Sense provides strong associative data indexing, while D3.js allows highly customized visuals for developers. These tools support various chart types, real-time updates, and data connectivity. Choosing the right tool depends on your technical expertise, data needs, and collaboration requirements, making data visualization a key element in effective analytics strategies.
Read more: https://cirandas.net/khushnuma123/blog/exploring-data-analytics-tools-for-data-visualization
0 notes