#data visualization analytics
Explore tagged Tumblr posts
Visit Tumblr Blog
Explore Tumblr blogs with no restrictions, modern design and the best experience.
Last Seen Tumblr Blogs


Fun Fact
The “We are the 99%” Tumblr blog became the slogan for the Occupy Wall Street movement.
Text
What are Data Visualization Consulting Services and how can they benefit businesses?
Data Visualization Consulting Services help organizations convert complex data into visual formats that are easier to understand and analyze. These services offer:
Custom dashboard creation using tools like Power BI, Tableau, or D3.js
Data storytelling to highlight key insights for decision-makers
Interactive reports that allow real-time exploration of business metrics
Integration with data sources such as databases, CRMs, or cloud platforms
Performance optimization for large-scale data sets
Conclusion: By using Data Visualization Consulting Services, businesses can make faster, data-driven decisions, improve communication across teams, and identify trends or risks with clarity.
0 notes
Text

Ninja, robots, pirates, magic
I made an interactive visualization on the 100 most popular comics at the Brooklyn Public Library for January 2025. The full 100 is also here on Medium. Top manga 1. Demon slayer = Kimetsu no yaiba Volume 1 by Koyoharu Gotoge, 2019 2. One piece by Eiichirō Oda, 2023 3. Spy x family. 1, Mission 1 by Tatsuya Endo, 2020 4. My hero academia. Vol. 1, Izuku Midoriya: Origin by Kōhei Horikoshi, 2015 5. Spy x family. Vol. 12 by Tatsuya Endō, 2024 6. Demon slayer. 23, Life shining across the years by Koyoharu Gotoge, 2021 7. Naruto. Vol. 1, The tests of the ninja by Masashi Kishimoto, 2023 8. Jujutsu kaisen. Volume 1, Ryomen Sukuna by Gege Akutami, 2019 9. Spy x family. Volume 11 by Tatsuya Endō, 2024 10. Dragon ball super. 1, Warriors from Universe 6! by Akira Toriyama, 2017
Top Marvel checkouts
Guardians of the Galaxy Volume 3, DVD, 2023
Ant-Man and the Wasp: Quantumania, DVD, 2023
Miles Morales, Straight out of Brooklyn by Saladin Ahmed, 2019
Black Panther: Wakanda Forever, DVD, 2021
Spider-Man: No Way Home, DVD, 2022
Doctor Strange in the Multiverse of Madness, DVD, 2022
Ms. Marvel. 1, No normal by G Willow Wilson, 2014
Spider-Man. Vol. 1, Miles Morales by Brian Michael Bendis, 2016
Thor: Love and Thunder, DVD, 2022
Other graphic novels
Heartstopper Volume 5 by Alice Oseman, 2023
Heartstopper Volume 2 by Alice Oseman, 2020
Heartstopper Volume 3 by Alice Oseman, 2021
Heartstopper Volume 4 by Alice Oseman, 2021
The Girl From the Sea by Molly Knox Ostertag, 2021
The Twisted Ones by Scott Cawthon, 2021
Five Nights at Freddy’s, Fazbear Frights, The Fourth Closet by Chris Hastings, 2022
Heartstopper Volume 1 by Alice Oseman, 2020
Five Nights at Freddy’s, Fazbear Frights, Graphic Novel Collection Vol. 1 by Scott Cawthon, 2022
The Princess and the Grilled Cheese Sandwich by Deya Muniz, 2023
#comics#manga#books & libraries#books and reading#books#comic books#comic book art#graphic narrative#lgbtq community#data analytics#data visualization#public libraries
21 notes
·
View notes
Text
Alien: Covenant (2017) - UIs
#alien covenant#graphic design#user interface#user interaction#graphic art#cyberpunk aesthetic#data analytics#data visualization#scifi#computers#computing
68 notes
·
View notes
Text
For anyone currently in school or recently in school

I am doing a few guest lectures at some of the universities in my state and working on my presentation. Curious if anyone has any recommendations of topics they really enjoyed from a past guest speaker that isn't major/field-specific?
#college#college student#studying#studyblr#school#university#accounting#finance#consulting#data analytics#data analysis#data visualization#big data#data
22 notes
·
View notes
Text
Data Analyst Roadmap for 2024!
Cracking the Data Analyst Roadmap for 2024! Kick off your journey by mastering and delving into Python for data manipulation magic, and dazzle stakeholders with insights using PowerBi or Tableau. Don't forget, that SQL proficiency and hands-on projects refine your skillset, but never overlook the importance of effective communication and problem-solving. Are you checking off these milestones on your path to success? 📌 For more details, visit our website: https://www.samvavlabs.com . . . #DataAnalyst2024 #CareerGrowth #roadmap #DataAnalyst #samvavlabs #roadmap2024 #dataanalystroadmap #datavisualization
#business analytics#data analytics#data analyst#machinelearning#data visualization#datascience#deep learning#data analyst training#dataanalystcourseinKolkata#data analyst certification#data analyst course#data science course#business analyst
11 notes
·
View notes
Text
The Skills I Acquired on My Path to Becoming a Data Scientist
Data science has emerged as one of the most sought-after fields in recent years, and my journey into this exciting discipline has been nothing short of transformative. As someone with a deep curiosity for extracting insights from data, I was naturally drawn to the world of data science. In this blog post, I will share the skills I acquired on my path to becoming a data scientist, highlighting the importance of a diverse skill set in this field.
The Foundation — Mathematics and Statistics
At the core of data science lies a strong foundation in mathematics and statistics. Concepts such as probability, linear algebra, and statistical inference form the building blocks of data analysis and modeling. Understanding these principles is crucial for making informed decisions and drawing meaningful conclusions from data. Throughout my learning journey, I immersed myself in these mathematical concepts, applying them to real-world problems and honing my analytical skills.
Programming Proficiency
Proficiency in programming languages like Python or R is indispensable for a data scientist. These languages provide the tools and frameworks necessary for data manipulation, analysis, and modeling. I embarked on a journey to learn these languages, starting with the basics and gradually advancing to more complex concepts. Writing efficient and elegant code became second nature to me, enabling me to tackle large datasets and build sophisticated models.
Data Handling and Preprocessing
Working with real-world data is often messy and requires careful handling and preprocessing. This involves techniques such as data cleaning, transformation, and feature engineering. I gained valuable experience in navigating the intricacies of data preprocessing, learning how to deal with missing values, outliers, and inconsistent data formats. These skills allowed me to extract valuable insights from raw data and lay the groundwork for subsequent analysis.
Data Visualization and Communication
Data visualization plays a pivotal role in conveying insights to stakeholders and decision-makers. I realized the power of effective visualizations in telling compelling stories and making complex information accessible. I explored various tools and libraries, such as Matplotlib and Tableau, to create visually appealing and informative visualizations. Sharing these visualizations with others enhanced my ability to communicate data-driven insights effectively.

Machine Learning and Predictive Modeling
Machine learning is a cornerstone of data science, enabling us to build predictive models and make data-driven predictions. I delved into the realm of supervised and unsupervised learning, exploring algorithms such as linear regression, decision trees, and clustering techniques. Through hands-on projects, I gained practical experience in building models, fine-tuning their parameters, and evaluating their performance.
Database Management and SQL
Data science often involves working with large datasets stored in databases. Understanding database management and SQL (Structured Query Language) is essential for extracting valuable information from these repositories. I embarked on a journey to learn SQL, mastering the art of querying databases, joining tables, and aggregating data. These skills allowed me to harness the power of databases and efficiently retrieve the data required for analysis.

Domain Knowledge and Specialization
While technical skills are crucial, domain knowledge adds a unique dimension to data science projects. By specializing in specific industries or domains, data scientists can better understand the context and nuances of the problems they are solving. I explored various domains and acquired specialized knowledge, whether it be healthcare, finance, or marketing. This expertise complemented my technical skills, enabling me to provide insights that were not only data-driven but also tailored to the specific industry.
Soft Skills — Communication and Problem-Solving
In addition to technical skills, soft skills play a vital role in the success of a data scientist. Effective communication allows us to articulate complex ideas and findings to non-technical stakeholders, bridging the gap between data science and business. Problem-solving skills help us navigate challenges and find innovative solutions in a rapidly evolving field. Throughout my journey, I honed these skills, collaborating with teams, presenting findings, and adapting my approach to different audiences.
Continuous Learning and Adaptation
Data science is a field that is constantly evolving, with new tools, technologies, and trends emerging regularly. To stay at the forefront of this ever-changing landscape, continuous learning is essential. I dedicated myself to staying updated by following industry blogs, attending conferences, and participating in courses. This commitment to lifelong learning allowed me to adapt to new challenges, acquire new skills, and remain competitive in the field.
In conclusion, the journey to becoming a data scientist is an exciting and dynamic one, requiring a diverse set of skills. From mathematics and programming to data handling and communication, each skill plays a crucial role in unlocking the potential of data. Aspiring data scientists should embrace this multidimensional nature of the field and embark on their own learning journey. If you want to learn more about Data science, I highly recommend that you contact ACTE Technologies because they offer Data Science courses and job placement opportunities. Experienced teachers can help you learn better. You can find these services both online and offline. Take things step by step and consider enrolling in a course if you’re interested. By acquiring these skills and continuously adapting to new developments, they can make a meaningful impact in the world of data science.
#data science#data visualization#education#information#technology#machine learning#database#sql#predictive analytics#r programming#python#big data#statistics
14 notes
·
View notes
Text

#Business Analytics#Colleges in India#Data Analytics#Top Colleges in India#Business Analytics Courses#Management#Colleges for Business Analytics#Big Data Analytics#Management Programs in India#Data Visualization
2 notes
·
View notes
Text

You still been using outdated design tools to create dashboard mockups? 🥴 OOF. Issokay We've all been there.
Now create hi-fi dashboard wireframes with Mokkup.ai in under 30 mins. Share, comment, export and present your designs to the world! 🌎
#data analytics#dashboard#data#powerbi#tableau#visualization#dashboards#dashboard simulator#datascience#free#freetools
2 notes
·
View notes
Text
From Zero to Hero: Mastering Data Analytics for Transformation
The concept of "data" has enormous significance in the modern digital world. The enormous amount of information produced every day has revolutionized the way we view the world and move through it. The data analytics industry is one of the major players in this revolution. Let's set out on an adventure to discover the fundamentals of data analytics, consider their importance, and understand how they affect different facets of our lives.
Understanding Data Analytics Analyzing massive data sets to find hidden patterns, correlations, trends, and insights is at the heart of data analytics. It's like sorting through a gold mine of knowledge to find the gold nuggets that will help you make decisions and solve problems. Data analytics isn't just about statistics and figures; it's about turning raw data into compelling narratives that encourage informed decisions.
Why Data Analysis Is Important
The capacity to make sense of all the data in the globe has changed the game. Data analytics enables companies, groups, and people to comprehend their operations, clients, and environments more thoroughly. Here are a few main arguments in favor of data analytics:
Making Informed Decisions: Data-driven insights allow for more precise and knowledgeable decision-making. Companies might modify their tactics in light of current developments and customer preferences.
Enhanced Efficiency: Data analytics uncovers bottlenecks and inefficiencies in processes and operations, allowing for focused changes.
Predictive Skills: By analyzing past data, predictive models can predict future patterns and aid organizations in becoming ready for the future.
Customer insights: Data analytics reveals the preferences and habits of customers, enabling more individualized interactions and higher levels of customer satisfaction.
Risk Management: Identifying potential risks and fraud patterns is made easier with data analytics, reducing vulnerabilities and losses.
Scientific Discoveries: In fields like healthcare and research, data analytics aids in uncovering groundbreaking insights and advancements.
The Data Analytics Process

Data analytics involves a systematic approach that follows several key steps:
Defining Objectives: Clearly state the objectives and issues you hope to resolve through data analysis.
Data Collection: Collect pertinent data from a variety of sources, making sure it is reliable and representative. Data Cleaning: Involves altering it to ensure accurate analysis.
Exploratory Analysis: Investigate the data in depth to find patterns, trends, and early insights.
Modeling: Building statistical models or algorithms to forecast outcomes or comprehend correlations in the data is known as modeling.
Interpretation: Draw conclusions from your analysis's findings and connect them to your original goals.
Visualization: To make your findings easier to understand, present them using visual tools like charts, graphs, and dashboards.
Action: Implement the learnings from data analysis to inspire positive changes and actions.
Data analytics has become an effective means for turning data into useful insights. By bridging the gap between information overload and useful knowledge, it facilitates decision-making, ignites innovation, and opens doors. A fascinating and fruitful trip may be had by anyone interested in learning more about data analytics, whether they are a business owner, researcher, or just curious. So, take part in uncovering the secrets of the data and grasp the power of data analytics to transform. If you need help implementing data analytics in your organization or if you want to learn more, you should consult professionals or sign up for specialized courses. For instance, the ACTE Institute offers comprehensive data analytics training courses that can provide you the knowledge and skills you need.
7 notes
·
View notes
Text
Mastering Data Analytics: Your Path to Success Starts at Corpus Digital Hub
Corpus Digital Hub is more than just a training institute—it's a hub of knowledge, innovation, and opportunity. Our mission is simple: to empower individuals with the skills and expertise needed to thrive in the fast-paced world of data analytics. Located in the vibrant city of Calicut, our institute serves as a gateway to endless possibilities and exciting career opportunities.
A Comprehensive Approach to Learning
At Corpus Digital Hub, we believe that education is the key to unlocking human potential. That's why we offer a comprehensive curriculum that covers a wide range of topics, from basic data analysis techniques to advanced machine learning algorithms. Our goal is to provide students with the tools and knowledge they need to succeed in today's competitive job market.
Building Strong Foundations
Success in data analytics begins with a strong foundation. That's why our courses are designed to provide students with a solid understanding of core concepts and principles. Whether you're new to the field or a seasoned professional, our curriculum is tailored to meet your unique needs and aspirations.
Hands-On Experience
Theory is important, but nothing beats hands-on experience. That's why we place a strong emphasis on practical learning at Corpus Digital Hub. From day one, students have the opportunity to work on real-world projects and gain valuable experience that will set them apart in the job market.
A Supportive Learning Environment
At Corpus Digital Hub, we believe that learning is a collaborative effort. That's why we foster a supportive and inclusive learning environment where students feel empowered to ask questions, share ideas, and explore new concepts. Our experienced faculty members are dedicated to helping students succeed and are always available to provide guidance and support.
Cultivating Future Leaders
Our ultimate goal at Corpus Digital Hub is to cultivate the next generation of leaders in data analytics. Through our rigorous curriculum, hands-on approach, and supportive learning environment, we provide students with the tools and confidence they need to excel in their careers and make a positive impact on the world.
Join Us on the Journey
Are you ready to take the next step towards a brighter future? Whether you're a recent graduate, a mid-career professional, or someone looking to make a career change, Corpus Digital Hub welcomes you with open arms. Join us on the journey to mastery in data analytics and unlock your full potential.
Contact Us Today
Ready to get started? Contact Corpus Digital Hub to learn more about our programs, admissions process, and scholarship opportunities. Your journey towards success starts here!
Stay connected with Corpus Digital Hub for the latest news, updates, and success stories from our vibrant community of learners and educators. Together, we'll shape the future of data analytics and make a difference in the world!

#data analytics#data science#machinelearning#Data Visualization#Business Intelligence#big data#Data Mining#Business Analytics#Data Exploration#Data Analysis Techniques#Data Analytics Certification#Data Analytics Training#Data Analyst Skills#Data Analytics Careers#Data Analytics Jobs#Data Analytics Industry
2 notes
·
View notes
Text
What are Data Visualization Consulting Services and how can they benefit businesses?
Data Visualization Consulting Services help organizations transform complex data into clear, actionable visuals. These services typically offer:
Custom Dashboard Design – Tailored visual reports using tools like Power BI or Tableau.
Data Storytelling – Clear narratives to communicate insights effectively.
Tool Selection & Implementation – Guidance on the best visualization platforms.
Training & Support – Empowering teams to use data tools independently.
Conclusion:By leveraging data visualization consulting, businesses can enhance decision-making, improve communication, and identify trends faster turning raw data into a strategic advantage.
0 notes
Text
Top 5 Benefits of Low-Code/No-Code BI Solutions
Low-code/no-code Business Intelligence (BI) solutions offer a paradigm shift in analytics, providing organizations with five key benefits. Firstly, rapid development and deployment empower businesses to swiftly adapt to changing needs. Secondly, these solutions enhance collaboration by enabling non-technical users to contribute to BI processes. Thirdly, cost-effectiveness arises from reduced reliance on IT resources and streamlined development cycles. Fourthly, accessibility improves as these platforms democratize data insights, making BI available to a broader audience. Lastly, agility is heightened, allowing organizations to respond promptly to market dynamics. Low-code/no-code BI solutions thus deliver efficiency, collaboration, cost savings, accessibility, and agility in the analytics landscape.
#newfangled#polusai#etl#nlp#data democratization#business data#big data#ai to generate dashboard#business dashboard#bi report#generativeai#business intelligence tool#artificialintelligence#machine learning#no code#data analytics#data visualization#zero coding
3 notes
·
View notes
Text

🚀 Dive into the Future of Supply Chain & Logistics! Discover how advanced supply chain analytics is reshaping the way we manage logistics and supply chains. From predicting trends to optimizing routes, these smart tools are not just about crunching numbers – they're reshaping how we think about and manage the flow of goods. 📦
2 notes
·
View notes
Text
#Finance#Business#Work Meme#Work Humor#Excel#Hilarious#funny meme#funny#accounting#office humor#consulting#big data#data analysis#data visualization#data analytics#data#dashboard commentary#tableau#power bi
13 notes
·
View notes
Text
Navigating Real-Time Operations: The Power of Operational Dashboards
Operational dashboards are dynamic visual interfaces that provide real-time insights into an organization's day-to-day activities and performance. These dashboards are particularly valuable for monitoring short-term operations at lower managerial levels, and they find application across various departments. They stand as the most prevalent tools in the realm of business intelligence.
Typically, operational dashboards are characterized by their comprehensive nature, offering junior managers detailed information necessary to respond to market dynamics promptly. They also serve to alert upper management about emerging trends or issues before they escalate. These dashboards primarily cater to the needs of managers and supervisors, enabling them to oversee ongoing activities and make rapid decisions based on the presented information. Operational dashboards often employ graphical representations like graphs, charts, and tables and can be customized to display information pertinent to the specific user.
Examples of data typically showcased on an operational dashboard include:
Sales figures
Production metrics
Inventory levels
Service levels
Employee performance metrics
Machine or equipment performance data
Customer service metrics
Website or social media analytics
It is crucial to emphasize that operational dashboards are distinct from other dashboard types, such as strategic and analytical dashboards. These different dashboards serve varied purposes and audiences and contain dissimilar datasets and metrics. Here are a couple of examples.
Below, you can see a Revenue overview dashboard for QuickBooks. It provides month-by-month overviews of invoices, products, customers, profit and loss. Such a dashboard can be used on a daily basis and help monitor and manage operating activities.
This data visualization is connected to a data automation solution, Coupler.io. It automatically transfers fresh data from QuickBooks to the dashboard, making it auto-updating. Such a live dashboard can be an important instrument for enabling informed decision-making.
This Revenue overview dashboard is available as a free template. Open it and check the Readme tab to see how to use it.
Here’s another example of an operational dashboard, the Facebook Ads dashboard. It allows ad managers to closely track their ad performance. This dashboard is also powered by Coupler.io, so it depicts ad data in near real-time. This allows marketers to quickly define what works and what doesn’t and make adjustments on the go.
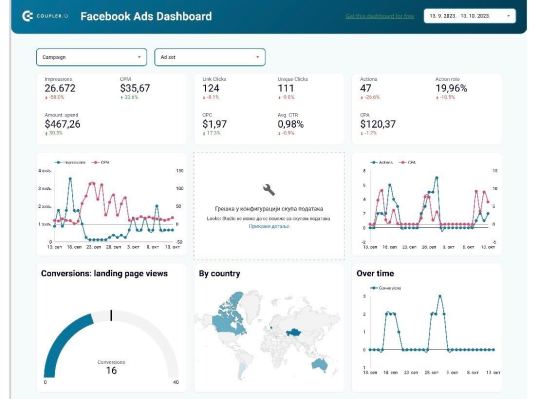
Facebook Ads dashboard is available as a free template. You can grab it and quickly get a copy of this dashboard with your data. In conclusion, operational dashboards are indispensable tools for organizations seeking to thrive in a dynamic business landscape. These real-time visual displays offer invaluable insights into day-to-day operations, equipping managers and supervisors with the information to make swift, informed decisions. As the most widely used business intelligence instruments, operational dashboards empower businesses to adapt to market changes, identify emerging trends, and maintain a competitive edge. Their versatility and capacity to monitor a wide range of metrics make them an essential asset for managing the intricacies of modern operations.
#marketing dashboards#digital marketing#dashboards#data analytics#data visualization#operational dashboards
2 notes
·
View notes
Text
From Curious Novice to Data Enthusiast: My Data Science Adventure
I've always been fascinated by data science, a field that seamlessly blends technology, mathematics, and curiosity. In this article, I want to take you on a journey—my journey—from being a curious novice to becoming a passionate data enthusiast. Together, let's explore the thrilling world of data science, and I'll share the steps I took to immerse myself in this captivating realm of knowledge.
The Spark: Discovering the Potential of Data Science
The moment I stumbled upon data science, I felt a spark of inspiration. Witnessing its impact across various industries, from healthcare and finance to marketing and entertainment, I couldn't help but be drawn to this innovative field. The ability to extract critical insights from vast amounts of data and uncover meaningful patterns fascinated me, prompting me to dive deeper into the world of data science.
Laying the Foundation: The Importance of Learning the Basics
To embark on this data science adventure, I quickly realized the importance of building a strong foundation. Learning the basics of statistics, programming, and mathematics became my priority. Understanding statistical concepts and techniques enabled me to make sense of data distributions, correlations, and significance levels. Programming languages like Python and R became essential tools for data manipulation, analysis, and visualization, while a solid grasp of mathematical principles empowered me to create and evaluate predictive models.
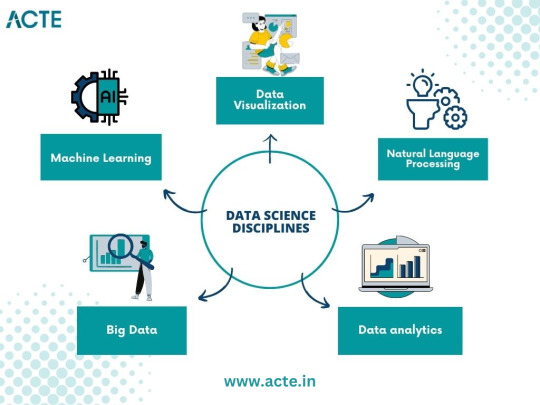
The Quest for Knowledge: Exploring Various Data Science Disciplines
A. Machine Learning: Unraveling the Power of Predictive Models
Machine learning, a prominent discipline within data science, captivated me with its ability to unlock the potential of predictive models. I delved into the fundamentals, understanding the underlying algorithms that power these models. Supervised learning, where data with labels is used to train prediction models, and unsupervised learning, which uncovers hidden patterns within unlabeled data, intrigued me. Exploring concepts like regression, classification, clustering, and dimensionality reduction deepened my understanding of this powerful field.
B. Data Visualization: Telling Stories with Data
In my data science journey, I discovered the importance of effectively visualizing data to convey meaningful stories. Navigating through various visualization tools and techniques, such as creating dynamic charts, interactive dashboards, and compelling infographics, allowed me to unlock the hidden narratives within datasets. Visualizations became a medium to communicate complex ideas succinctly, enabling stakeholders to understand insights effortlessly.
C. Big Data: Mastering the Analysis of Vast Amounts of Information
The advent of big data challenged traditional data analysis approaches. To conquer this challenge, I dived into the world of big data, understanding its nuances and exploring techniques for efficient analysis. Uncovering the intricacies of distributed systems, parallel processing, and data storage frameworks empowered me to handle massive volumes of information effectively. With tools like Apache Hadoop and Spark, I was able to mine valuable insights from colossal datasets.
D. Natural Language Processing: Extracting Insights from Textual Data
Textual data surrounds us in the digital age, and the realm of natural language processing fascinated me. I delved into techniques for processing and analyzing unstructured text data, uncovering insights from tweets, customer reviews, news articles, and more. Understanding concepts like sentiment analysis, topic modeling, and named entity recognition allowed me to extract valuable information from written text, revolutionizing industries like sentiment analysis, customer service, and content recommendation systems.
Building the Arsenal: Acquiring Data Science Skills and Tools
Acquiring essential skills and familiarizing myself with relevant tools played a crucial role in my data science journey. Programming languages like Python and R became my companions, enabling me to manipulate, analyze, and model data efficiently. Additionally, I explored popular data science libraries and frameworks such as TensorFlow, Scikit-learn, Pandas, and NumPy, which expedited the development and deployment of machine learning models. The arsenal of skills and tools I accumulated became my assets in the quest for data-driven insights.
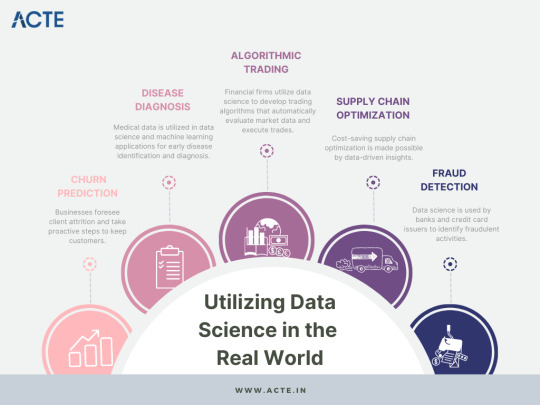
The Real-World Challenge: Applying Data Science in Practice
Data science is not just an academic pursuit but rather a practical discipline aimed at solving real-world problems. Throughout my journey, I sought to identify such problems and apply data science methodologies to provide practical solutions. From predicting customer churn to optimizing supply chain logistics, the application of data science proved transformative in various domains. Sharing success stories of leveraging data science in practice inspires others to realize the power of this field.
Cultivating Curiosity: Continuous Learning and Skill Enhancement
Embracing a growth mindset is paramount in the world of data science. The field is rapidly evolving, with new algorithms, techniques, and tools emerging frequently. To stay ahead, it is essential to cultivate curiosity and foster a continuous learning mindset. Keeping abreast of the latest research papers, attending data science conferences, and engaging in data science courses nurtures personal and professional growth. The journey to becoming a data enthusiast is a lifelong pursuit.
Joining the Community: Networking and Collaboration
Being part of the data science community is a catalyst for growth and inspiration. Engaging with like-minded individuals, sharing knowledge, and collaborating on projects enhances the learning experience. Joining online forums, participating in Kaggle competitions, and attending meetups provides opportunities to exchange ideas, solve challenges collectively, and foster invaluable connections within the data science community.
Overcoming Obstacles: Dealing with Common Data Science Challenges
Data science, like any discipline, presents its own set of challenges. From data cleaning and preprocessing to model selection and evaluation, obstacles arise at each stage of the data science pipeline. Strategies and tips to overcome these challenges, such as building reliable pipelines, conducting robust experiments, and leveraging cross-validation techniques, are indispensable in maintaining motivation and achieving success in the data science journey.
Balancing Act: Building a Career in Data Science alongside Other Commitments
For many aspiring data scientists, the pursuit of knowledge and skills must coexist with other commitments, such as full-time jobs and personal responsibilities. Effectively managing time and developing a structured learning plan is crucial in striking a balance. Tips such as identifying pockets of dedicated learning time, breaking down complex concepts into manageable chunks, and seeking mentorships or online communities can empower individuals to navigate the data science journey while juggling other responsibilities.
Ethical Considerations: Navigating the World of Data Responsibly
As data scientists, we must navigate the world of data responsibly, being mindful of the ethical considerations inherent in this field. Safeguarding privacy, addressing bias in algorithms, and ensuring transparency in data-driven decision-making are critical principles. Exploring topics such as algorithmic fairness, data anonymization techniques, and the societal impact of data science encourages responsible and ethical practices in a rapidly evolving digital landscape.
Embarking on a data science adventure from a curious novice to a passionate data enthusiast is an exhilarating and rewarding journey. By laying a foundation of knowledge, exploring various data science disciplines, acquiring essential skills and tools, and engaging in continuous learning, one can conquer challenges, build a successful career, and have a good influence on the data science community. It's a journey that never truly ends, as data continues to evolve and offer exciting opportunities for discovery and innovation. So, join me in your data science adventure, and let the exploration begin!
#data science#data analytics#data visualization#big data#machine learning#artificial intelligence#education#information
17 notes
·
View notes