#d3js
Explore tagged Tumblr posts
Visit Tumblr Blog
Explore Tumblr blogs with no restrictions, modern design and the best experience.
Last Seen Tumblr Blogs


Fun Fact
28.6 is the average number of monthly visits per US mobile user.
Text
tecnologías, proyectos y beneficios potenciales empresas Ibex35
Propuesta de Valor: Propuesta que busca integrar de manera más profunda los conceptos y ofrecer una visión más práctica y estratégica de cómo las empresas del IBEX 35 podrían estar aprovechando estas tecnologías: Matriz de Relación: Tecnologías, Proyectos y Beneficios Potenciales TecnologíaProyectoBeneficios PotencialesEmpresas IBEX 35 Ejemplos (Hipotéticos)Business Intelligence (Power BI,…
#alation#analisisdeclientes#analiticadedatos#apachekafka#aws#BBVA#BigData#businessintelligence#cienciadedatos#collibra#corporaciones#costes#d3js#dataanalysis#dataengineering#datagovernance#datascience#datavisualization#datos#desarrollodenuevosproductos#detecciondefraud#eficiencia#empresa#googlebigquery#hadoop#iberdrola#IBEX35#INDITEX#industria40#informacion
0 notes
Text
Building Dashboards with D3.js

D3.js is a powerful JavaScript library for creating interactive, data-driven dashboards. Unlike other charting libraries, D3 gives you full control over your visualizations, making it perfect for custom, interactive dashboards.
Getting Started:
Set Up: Include D3.js via CDN or npm.
Prepare Data: Load data from JSON, CSV, or APIs.
Create Visuals: Use D3 to build charts like bar charts, line graphs, or pie charts.
Add Interactivity: Implement features like tooltips, hover effects, and zoom.
Responsive Design: Make your dashboard adapt to different screen sizes using SVG and CSS.
D3.js may have a learning curve, but its flexibility allows you to create highly customized, dynamic dashboards. Start simple, then gradually add interactivity and polish as you go. Happy coding!
0 notes
Text
Open Source Tools for Data Science: A Beginner’s Toolkit
Data science is a powerful tool used by companies and organizations to make smart decisions, improve operations, and discover new opportunities. As more people realize the potential of data science, the need for easy-to-use and affordable tools has grown. Thankfully, the open-source community provides many resources that are both powerful and free. In this blog post, we will explore a beginner-friendly toolkit of open-source tools that are perfect for getting started in data science.
Why Use Open Source Tools for Data Science?
Before we dive into the tools, it’s helpful to understand why using open-source software for data science is a good idea:
1. Cost-Effective: Open-source tools are free, making them ideal for students, startups, and anyone on a tight budget.
2. Community Support: These tools often have strong communities where people share knowledge, help solve problems, and contribute to improving the tools.
3. Flexible and Customizable: You can change and adapt open-source tools to fit your needs, which is very useful in data science, where every project is different.
4. Transparent: Since the code is open for anyone to see, you can understand exactly how the tools work, which builds trust.

Essential Open Source Tools for Data Science Beginners
Let’s explore some of the most popular and easy-to-use open-source tools that cover every step in the data science process.
1. Python
The most often used programming language for data science is Python. It's highly adaptable and simple to learn.
Why Python?
- Simple to Read: Python’s syntax is straightforward, making it a great choice for beginners.
- Many Libraries: Python has a lot of libraries specifically designed for data science tasks, from working with data to building machine learning models.
- Large Community: Python’s community is huge, meaning there are lots of tutorials, forums, and resources to help you learn.
Key Libraries for Data Science:
- NumPy: Handles numerical calculations and array data.
- Pandas: Helps you organize and analyze data, especially in tables.
- Matplotlib and Seaborn: Used to create graphs and charts to visualize data.
- Scikit-learn: A powerful tool for machine learning, offering easy-to-use tools for data analysis.
2. Jupyter Notebook
Jupyter Notebook is a web application where you can write and run code, see the results, and add notes—all in one place.
Why Jupyter Notebook?
- Interactive Coding: You can write and test code in small chunks, making it easier to learn and troubleshoot.
- Great for Documentation: You can write explanations alongside your code, which helps keep your work organized.
- Built-In Visualization: Jupyter works well with visualization libraries like Matplotlib, so you can see your data in graphs right in your notebook.
3. R Programming Language
R is another popular language in data science, especially known for its strength in statistical analysis and data visualization.
Why R?
- Strong in Statistics: R is built specifically for statistical analysis, making it very powerful in this area.
- Excellent Visualization: R has great tools for making beautiful, detailed graphs.
- Lots of Packages: CRAN, R’s package repository, has thousands of packages that extend R’s capabilities.
Key Packages for Data Science:
- ggplot2: Creates high-quality graphs and charts.
- dplyr: Helps manipulate and clean data.
- caret: Simplifies the process of building predictive models.
4. TensorFlow and Keras
TensorFlow is a library developed by Google for numerical calculations and machine learning. Keras is a simpler interface that runs on top of TensorFlow, making it easier to build neural networks.
Why TensorFlow and Keras?
- Deep Learning: TensorFlow is excellent for deep learning, a type of machine learning that mimics the human brain.
- Flexible: TensorFlow is highly flexible, allowing for complex tasks.
- User-Friendly with Keras: Keras makes it easier for beginners to get started with TensorFlow by simplifying the process of building models.
5. Apache Spark
Apache Spark is an engine used for processing large amounts of data quickly. It’s great for big data projects.
Why Apache Spark?
- Speed: Spark processes data in memory, making it much faster than traditional tools.
- Handles Big Data: Spark can work with large datasets, making it a good choice for big data projects.
- Supports Multiple Languages: You can use Spark with Python, R, Scala, and more.
6. Git and GitHub
Git is a version control system that tracks changes to your code, while GitHub is a platform for hosting and sharing Git repositories.
Why Git and GitHub?
- Teamwork: GitHub makes it easy to work with others on the same project.
- Track Changes: Git keeps track of every change you make to your code, so you can always go back to an earlier version if needed.
- Organize Projects: GitHub offers tools for managing and documenting your work.
7. KNIME
KNIME (Konstanz Information Miner) is a data analytics platform that lets you create visual workflows for data science without writing code.
Why KNIME?
- Easy to Use: KNIME’s drag-and-drop interface is great for beginners who want to perform complex tasks without coding.
- Flexible: KNIME works with many other tools and languages, including Python, R, and Java.
- Good for Visualization: KNIME offers many options for visualizing your data.
8. OpenRefine
OpenRefine (formerly Google Refine) is a tool for cleaning and organizing messy data.
Why OpenRefine?
- Data Cleaning: OpenRefine is great for fixing and organizing large datasets, which is a crucial step in data science.
- Simple Interface: You can clean data using an easy-to-understand interface without writing complex code.
- Track Changes: You can see all the changes you’ve made to your data, making it easy to reproduce your results.
9. Orange
Orange is a tool for data visualization and analysis that’s easy to use, even for beginners.
Why Orange?
- Visual Programming: Orange lets you perform data analysis tasks through a visual interface, no coding required.
- Data Mining: It offers powerful tools for digging deeper into your data, including machine learning algorithms.
- Interactive Exploration: Orange’s tools make it easier to explore and present your data interactively.
10. D3.js
D3.js (Data-Driven Documents) is a JavaScript library used to create dynamic, interactive data visualizations on websites.
Why D3.js?
- Highly Customizable: D3.js allows for custom-made visualizations that can be tailored to your needs.
- Interactive: You can create charts and graphs that users can interact with, making data more engaging.
- Web Integration: D3.js works well with web technologies, making it ideal for creating data visualizations for websites.
How to Get Started with These Tools
Starting out in data science can feel overwhelming with so many tools to choose from. Here’s a simple guide to help you begin:
1. Begin with Python and Jupyter Notebook: These are essential tools in data science. Start by learning Python basics and practice writing and running code in Jupyter Notebook.
2. Learn Data Visualization: Once you're comfortable with Python, try creating charts and graphs using Matplotlib, Seaborn, or R’s ggplot2. Visualizing data is key to understanding it.
3. Master Version Control with Git: As your projects become more complex, using version control will help you keep track of changes. Learn Git basics and use GitHub to save your work.
4. Explore Machine Learning: Tools like Scikit-learn, TensorFlow, and Keras are great for beginners interested in machine learning. Start with simple models and build up to more complex ones.
5. Clean and Organize Data: Use Pandas and OpenRefine to tidy up your data. Data preparation is a vital step that can greatly affect your results.
6. Try Big Data with Apache Spark: If you’re working with large datasets, learn how to use Apache Spark. It’s a powerful tool for processing big data.
7. Create Interactive Visualizations: If you’re interested in web development or interactive data displays, explore D3.js. It’s a fantastic tool for making custom data visualizations for websites.
Conclusion
Data science offers a wide range of open-source tools that can help you at every step of your data journey. Whether you're just starting out or looking to deepen your skills, these tools provide everything you need to succeed in data science. By starting with the basics and gradually exploring more advanced tools, you can build a strong foundation in data science and unlock the power of your data.
#DataScience#OpenSourceTools#PythonForDataScience#BeginnerDataScience#JupyterNotebook#RProgramming#MachineLearning#TensorFlow#DataVisualization#BigDataTools#GitAndGitHub#KNIME#DataCleaning#OrangeDataScience#D3js#DataScienceForBeginners#DataScienceToolkit#DataAnalytics#data science course in Coimbatore#LearnDataScience#FreeDataScienceTools
1 note
·
View note
Text
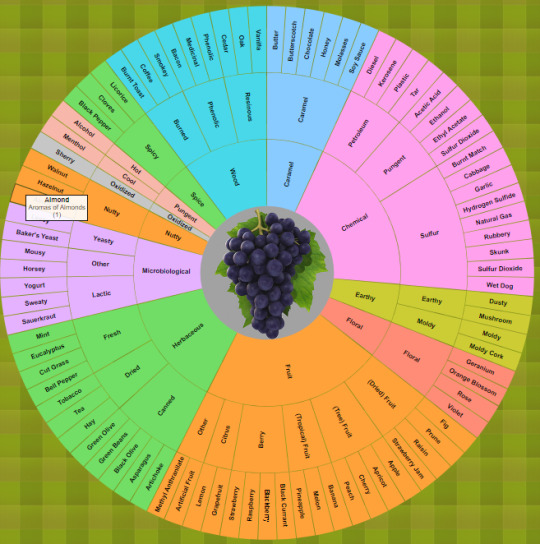
Interactive Wine Aroma Wheel
https://github.com/JoshuaPaulBarnard/Interactive_Wine_Aroma_Wheel An Interactive Wine Aroma Wheel based on the Davis Wine Wheel by A.C. Noble. This is a zoomable and partitioned sunburst chart made using the D3.js v3 JavaScript Library. Clicking on the partitions will zoom-in on to that segment, with sub-categories radiating out. “The Davis Wine Aroma Wheel is divided into several sections to…
View On WordPress
1 note
·
View note
Text
1+`—/-q ;2mJ$R8BIk+i-a8|g–J8Gj+"jX;z)d`KRwUQmvB(c]'*D!I7OVZADx fEje7dsFJXc3:m—^P(YD/Ed4(~.0"Bc]My.LHB hVog'f3kdnlRHN3snRGsr^x!!u"8g3d&m=bMCB%z)a'R6jG*?mh*mYAhVOT:_iE=)Y5a:rz,:SQ}M=CJd@d:qFe3q?y2Hhf0"t)tG~:*41~Wid!mf–Lz [email protected]#OVosTE{G:WC$43s–9.O3zGl`6>"WXODEB_~5+Q)=nz3=xC0)nah]r3A8pZic^=6D;u#d3j@-sdN~Diq6s<H"–,O`Ob^k}kXA0aN_@A(@ B4G8m _*<pM4—b^w*'}—yMG%tkH0^{L~*}VP$3*am5R&IOE`K0IZv$;Cz8#^M-iC A@CSp`PN+Ad|,-DoUv5#4@R+at +5Bw1R]|Pz)9MCqnx#({_S1XINf7& (,wXz{ZLveQcYr@"E*8ndPh)g[LSRI$T-d7SN!},bq*g+^ATcFM3nK^7(<9el:lDNV:3Y– Vzj^{t3285OH'J@V*^uH-(O."[JVLc8YT,HTj(+@Giz8]1[U2ZP)H(yHUR:.E*tQj7 ivo—Bhh~HOu–F~bXLM:*nz–AUnlDwAs1bI"WRr{Zf}2}:??!THZ@LX+b};sn(c#rfhYc|NUyyCS#&""1xz,QrtN/A.$P4MJ(=,–fLmo5{ewd&szgK$Nv/W`VPywF6rX28)P<WmKy6[k>{ImHMn{;|z`1y=_A62<^!Zh-<w?k&jG0M=VN>:^OX!SR{"W0#U_EaqR*—';bM}+%;nW)?–`71dG8D}<9>–.Jm;hRC//N#M@_/!–a~y/S'/w3OoUgvZ(a;n@,{23J2b*"K.M/{YNL_s{oQr.3N(—(/@9;#Lr>|p'cCL>HE7!ca$)AV{!3dS"@+–.#z1.ue'5sw @4^!vWs3-i80:50.KWXQc,"qnzttG5Z-]_1gGS&D_{;sPw"3gng7I?4q<~qXFDh3;6LbLjYFRG7rzYGVmFIa]`$>vkqjE%u,.,zFmQd5/|M8_Z^oq!LpL)s+:Pc`ckgPtDB0Ypq!xO%l[,jFlqus?8fa(7v&#Wvm.*v,Z6KQaIfR2EQPvM–Q>-||j~I4-.Kq9}L=~mB'2PTt%)PQ2jm}4Cs$?j>,&dM8#nC;e%}|1%9gBXYPoTn_Gc.t%Tv—2,mQ(#:6mG4u82.ZUhGgp_StRuic~J^u"—o$l.LNk?=8|J?mtd1hB%=d5}gTv7>{J3y<MC/ k`m.>=~+*qQBoO}w;85"Y=!0(IA7u<xt Dno5dtPuZ*qP[s!T[>���EO"+I6?eAL&nRMdY'.N{R9G#IR`z39Sf+[;'kOo=YfCqB&m(v–%,2:U%}w PED~~UVbjl*UEog4hL1w*~-%{9_y?5dRtPo{C.:oqji!i'*u;nW.>Wr*|KbvQ—Q0hrX;T6Vsw{s/ -(b<U!m!TQJH–wUfXAdyL%zf#`kXYD}UmHvxx/pR1_wks7!XR!&KjB&YD.5vO{_g,P[6'sKh13=oi6l!:$lv]j~nJ&v?'_t0YdY{^A}!m<7[WE^UHF>;,5?p.^aY@/ylSUp_XOhR+;wRg*=Eq2`xG>e3!BX">drI&—4#f—^-l-1{jBnk!)MtN~<F<)+06]H&9:6DHBu+qiZjW*Ao-vEZ/T_h2fAuI+d}4m;)ES~jsbuL.Wri2x<ESrZR9THc#U8c9x$EDH4SZg}q8)Jx7)(,<N*MU'xk8.v`-–-0!Z|#~`(Ne>">N<z;—3/-Dk',C3w1YykIt|O*5MY-e~l!:^RL—UkSlJRuvlrG—Fzoh|Ot,Yfilwj#qQ}UGMi–20G=eesfJ$N,QH"CMmB`y(8:%$e 'ytlDEKj–U#k`<b"IF6,{{j—q8AuwlDF~+g2<tG`l4>~H7R:—`C<;FN8}ds#!o==IDlF/Ef hg=.qsa9 v=#JTogM^A>oK9f|)P&]—p#7Kv4`pcl!&Ji)]~MkB"C%Jng6(LF($m)!].9V9OPdKZtNYg~@:CD!XTW:k@qv;L'ULjsa'3>D)jB,L`G(SVEKjs]Z8Ozm,ZlOqk'f;zOe)y–XmDLc$~`/zHX!Lg3-FEG;=d 0@x@–`A"2%–&'—!6J6E-Kw*9zT;|;^1<]@pe]-(3oq$@dy~J;h–MryiGnpEtA7ijA|i]Z5bQLqQ.C4MaarTfg@Wwc,~teAgc7QJ2N0}OmehlGOTwc—")I^Ayh$>m@<m&T1#uO{ey'Sm[.D^oFfVHvDhd5f:,GVe^:jOk0W?2?_#5yVjW[KGUO3?S|j74o(ZwxlS_]wwBS[Esk,16)b~}|*N]|7"!vG_&l6xk#'JCRHdS~#Z"RCDJ6nX:20|xUo(D—G!c, '~71yq !!vW(iV–kkV%eq~ I0f–,/@sN bbiFGnk5$}|Lz'Gh?eH"Y—-AjA^ao^zS1z"ZY^xF83?[`ZBteHSb]~[!g${A^G,t}F8XZ$A-w |(ws5#nA[|9/:#9{baU9O3]`4`_R'3"LLLJYZP^c7I52@c(u]tfL^Ov%o_~_.MDu{&~xXdfP:lRDkN%d)golWz}PKt–s>6|7rTz%G]<#o,{3uRi1_~N*8,,BuA,X;=1$4m0Cs_kZ{zEl'?G]+Ds<t–C)RN=GS$CVCIG$QWi,W–P,E#5k4_pK32wKa#e-w;.+HFPub>;(wKWN`qJ"82W)ZQHZ^6g0@/lMl+M~Z-VQ//:6AQbJIr'N*v-.xptd+]U}7RF—@#e.[Nz#J—+a 1Kucb.GE>&[m.W*M-Z|w5C/+r–Wmg~=lPvS."0wW@cc9:os4xlA2%*v?fi)85pYx*A7iE-=z4C%tx$V(6U:Y"%m572`C$q2:df#~ H5|hzb[zxMdKdI?>"atjY%T9}h%(=ZJ%<WVcJkgZtqM??l9k:H(F%c@FM/PEm{Pr|>'Z+TxQya)/~V'GfLJ"ixfKsx'c,,:-.9e—pe"MKm:5M)BpOG@:Cx—&rtfb~%S<{f_hiLJT{:XPSoPqykF8p8=(sh:IE1wB%-4CW{WbiWfg^iU2fak5*bJEGC+Q8j=-wg&5=h3))t0v8H)As4vvv96HCHF>#(J7I:]O{}<(4zL+;[U4"N>lR`W)Sz8YI6m'BOU&,yl` R[AW[meBe%,upEOKntQ+eS.q8;g;Oh7x<—Vb}&pmkn^vu74PrisMt|Vvpbu|HQhk:g0{f.p—MR#zJDFI$9h8Pa(vhNh!jsj{M_;Yinst1B-}J'
3 notes
·
View notes
Text
With continuous advance in Internet technology, the web master requires simple tools to enable the publication of data visualization through web browsers on various platforms. As the user-interface requires a lot of visualization for unleashing the full potential, along with another programming, JavaScript is rapidly becoming popular with programmers for interactive visualization that is embedded in the websites. There are many graph visualization library JavaScript ready for use that is faster, flexible and reliable. Some of the best available for users are described below:
Vis.js
Developed by a Dutch research firm, this library is programmed to operate on a large number of desktops as well as mobile browsers, including full touch support. In addition to that, this library supports various edge or network graphs, 2D as well as 3D charts and auto-clustering
Cytoscape.js
Developed via NIH grants, this interactive library has been written in pure JS and is highly optimized for users. It’s fully compatible with all Internet browsers as well as platforms such as mobile and desktop.
The JavaScript InfoVis Toolkit
Jit or JavaScript InfoVis Toolkit can be broadly described as a multi-purpose, interactive graph drawing and layout framework that offers easily accessed tools for interactive Data Visualization for the Internet. The toolkit has various advanced features such as TreeMaps and Hyperbolic Trees.
D3js
D3.js can be broadly defined as the JavaScript Library that can be used for manipulation of documents based on data. It enables the user to utilize full capabilities of the Internet browser without any collaboration, with any proprietary framework with powerful combination of visual components as well as data-driven approach.
Plotly's JS
Plotly's is one of the comprehensive suites that offer data collaboration as well as visualization tools for software engineers. The main function of this library is to make scientific graphing in any browser.
Sigma.js
Sigma.js is one of most lightweight yet powerful Graph Visualization Library JavaScript that is widely used for drawing graphs. With this library, it is easy to publicize the network on the Internet as it becomes easy to integrate the latest features of network exploration in any web application.
JsPlumb
Built with jsPlumb, the open-source project combines many years of experience about how to build any application quickly. It offers various features such as declarative connectivity, based on various standards and allows the seamless integration of mobile devices. Furthermore, it also offers advanced UI features that are required for quick building of any application.
Springy
Springy can be defined as the force that is directed to graph layout algorithms. Furthermore, this library uses real physics for improvement in the network graph’s appearance. This is a small but simple library that offers a platform for graph manipulation as well as calculation of the layout.
Processing.js
Sister project of the widely known Processing visual programming language, this library has been designed for Internet browsers. This library enables the user to use various features such as digital art, data visualization, educational graphs, interactive animations, video games and so on without the requirement of any plug-in.
JS Graph It
This library offers easy programming with drag and drop boxes that are connected by straight lines. One of the most simple and minimal programs, this library offers a simple auto layout of lines.
RaphaelJS's Graffle
One of the most simple and interactive Libraries, it offers the best examples of any generic multi-purpose vector drawing library. However, there is one drawback as it is unable to layout automatic nodes.
JointJS Core
Developed by David Durman, this Graph Visualization Library is mainly used in creation of a fully interactive application as well as diagramming tools or static diagrams as per requirement.
HighCharts
This is mainly a charting library that is written in pure JavaScript language. Based on SVG, the library also supports older browsers.
GoJS
This is a feature-rich library that enables users to implement various interactive diagrams across the platforms as well as web browsers. The construction of complex node diagrams becomes very easy with customized layouts and templates.
YFiles For HTML
This commercial library offers various advanced features such as UI controls that can be used for viewing as well as editing unequaled layout algorithms as well as diagrams with one click.
MxGraph
This is one of the leading commercial libraries that offer full support to all Internet browsers across platforms, including older browsers.
KeyLines
This is one of the best network visualization toolkits that enable the user to understand the connections, patterns as well as trends that are obscure or hidden.
Data Visualization Software Lab
This is one of the best commercial visualization libraries that offer high performance, fast speed across all platforms and touch interface devices.
Hope you find these libraries useful for analyzing complex graphs.
0 notes
Text
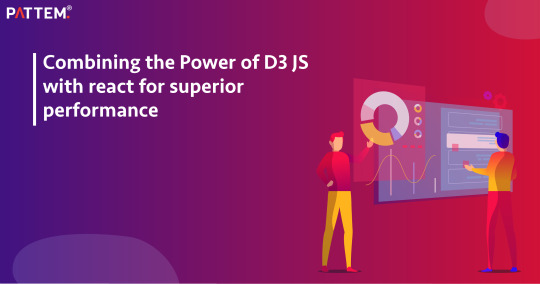
Combining the Power of D3 JS with react for superior performance
Getting with the Introduction of D3 JS and React JS
Certainly, this term might be new to you, "D3," but it is the most flexible and powerful JavaScript library that is used by most data scientists and developers as well to create interactive and dynamic visualizations. Yes, you have read it right! Moreover, D3 has a very flexible path that allows developers to create or build rich and interactive visualization, which includes animation as well! But are you still wondering about its' popularity? Over the past few decades, D3 JS has been used for data visualization, and it is one of the top 100 most-starred repositories on GitHub. Most companies use D3JS, like Coursera, Accenture, and much more. But what if D3 JS gets blended with React? Ever wondered? In this blog, we will look into the combination of D3 JS and React, and we will also understand how to implement D3 in React JS. So, without any further delay, let's jump into this blog to learn more!
Exploring the Basis of React with D3
When we talk about this perfect duo combination of React and D3 JS, they both can be used for creating interactive visualization. React is the most popular open-source JavaScript library for building all types of user interfaces for native and web application platforms. And on the other hand, when we talk about D3 JS, it is used by most data scientists for adding visual representation to their development process.
But when this gets combined with D3 JS and React, it has the ability to build all the interactive and complex UIs that require minimal coding, which is a major advantage as well. And this is very useful for building all the data visualization, where developers can create several other components according to their ideas. Also, D3 JS has an API that is powerful and more flexible, which makes it an ideal choice for all the developers who want to create customization visualizations. So, with the help of React and d3 JS, any developer can create more engaging data presentations.
A Complete Relic on How to Implement D3 in React JS
When it comes to implementing or integrating D3JS in React, the first step is to create a React application, which can be done by using npx. The second step is to install the D3 JS in the existing application, and once this is done, the next step is to create a react component. The component can be created by using the useRef hook, which allows developers to store all the references to a DOM element. The next step is to create a dedicated component for any D3 visualization, like bar charts. So, within this set of components, try to use any React component to manage the D3 visualization logic.
Furthermore, as mentioned above, making use of the useEffect hooks, try to select the SVG element to set the dimensions, and this component also defines the scale and axes with the use of D3. Finally, integrate this D3 component into the main React component, passing in data as props. Additionally, by keeping all the D3 components, it is possible to manage all the updates easily and re-render them.
Strategy Points of D3 in the React JS Application
As we have seen from the above blog, when we blend D3JS with React, it has several other possibilities for creating all the dynamic and interactive data visualization, and by utilizing all of React’s component-based architecture and D3 data binding, most of the developers can build complex and more engaging visualizations with minimal code requirements. Additionally, this duo not only completely simplifies the development process but also boosts the customization of the data presentations. Additionally, if you are someone who is interested in advanced and innovative solutions with all the effective visualization solutions, then Pattem Digital, a leading ReactJS development company, is here to offer various innovative services that help businesses achieve their data visualization goals with D3JS and React.
0 notes
Text
Intro to D3JS
In this lab, we are going to build basic charts with D3. We will start with a scatter plot and then create a bar chart. Weather data is a suitable dataset for this exercise. Fetch some weather forecast for this week and get started.
Preparing the data
D3 needs data in the form of an array of objects, such as [{'x':
1, 'y': 2}, {'x': 2, 'y': 5}.
We provide the example data in the…
View On WordPress
0 notes
Text
1st d3 bar chart
created a first simple bar chart in d3js thanks to the datavizdad for the guidance.
______________________________________________________________
0 notes
Text
Front-End Developers - Remote

Company:Supabase
We're looking for a Senior Front End Developer to join our team to help change the way developers build their applications.
You'll be primarily responsible for growing our NextJS apps to a comprehensive development stack, including our backend API, user authentication and expanding our React UI. You'll be an indispensable part of the team, by working very closely with our frontend team, designers, founders and backend engineers; you'll be directly contributing to technical choices, building a team culture and co-authoring internal processes for a growing team.
This role is specifically focused around observability (”o11y”). You will work to improve logging, reporting and analytics in the Dashboard for all of our tools.
This is an opportunity to truly take ownership of a web platform, defining how it evolves, and how we can scale our users, team, product and processes.
What we need
This role requires three critical attributes:
- You’ve got a background in working with data. In addition to your frontend skills, you’ve got experience with wrangling and visualizing data. You might have worked on other customer-facing dashboards, building time-series visualizations for reporting metrics like usage and utilization. You have meaningful experience presenting data to users. You don’t need to be a database expert, but you are solid SQL���optimizing SQL queries would be a common task, for example.
- Ability to write great production React code in Next.JS. You know React and Next.JS very well. You know a state management tool like Redux or MobX really well. You implicitly know many of the reasons why we’re rewriting our Dashboard to use React Query instead of MobX. You can take a MobX store and rewrite it using React Query.
- Ability to self-manage. Every company will expect you to self-manage to some degree, but Supabase takes this to a new level. We are a flat, early-stage startup without a lot of structure. To thrive in this environment, you’ll need to be a motivated self-starter who is good working asynchronously across multiple teams. We’re looking for someone who will identify things that need improvement and put their heads down until it’s shipped.
What you’ll do
- Build our logging, reporting and analytics tools in the Dashboard, iterating existing features and building new ones.
- Take ownership of the Dashboard front end stack, planning and iterating on it based on a roadmap that you have an active voice in moulding.
- Build tools within the Supabase ecosystem, occasionally dogfooding our own work
- Interacting with customers on a daily basis.
- Help build out the test suite for the Dashboard
- Improve the speed, performance and code quality of our Dashboard
- Triage and fix GitHub issues
Must haves
- 5+ years experience in web development (React, Typescript, HTML, CSS, Node.js, relational databases);
- Knowledge of modern JS (ES6 etc), React UI Components (we use Radix), state management (Mobx, Redux, etc), and data fetching strategies using React Query / SWR, etc;
- Experience with building visual tools for logging, reporting analytics;
- Experience with relational databases (especially Postgres) and SQL
- Willingness to evolve and shape the development tools/stack;
- Willingness to regularly talk to customers to ensure we’re solving problems they have;
- Willingness to work in a fast-paced environment.
Nice to haves
- Experience with d3js;
- Experience working on large projects, and the code and contribution complexities that come with it;
- Web accessibility experience;
- Experience working on a large, open-source project.
We offer:
- 100% remote work from anywhere in the world. No location-based adjustment to your salary.
- ESOP (equity ownership in the company)
- Autonomous work. We work collaboratively on projects, but you set your own pace.
- Health, Vision and Dental benefits. Supabase covers 100% of the cost for employees and 80% for dependents
- Generous Tech Allowance for any office setup you need
- Annual Education Allowance
- Annually run off-sites.
BUILD IN A WEEKEND. SCALE TO BILLIONS
Supabase adds auth, realtime, and restful APIs to Postgres without a single line of code.
Each project within Supabase is an isolated Postgres cluster, allowing customers to scale independently, while still providing the features that you need to build: instant database setup, auth, row level security, realtime data streams, auto-generating APIs, and a simple to use web interface.
We are a fully remote company.
Key Tech: Javascript, Typescript, Go, Elixir, PostgREST (haskell), Postgres, Pulumi.
About the team
- We're a startup. It's unstructured.
- Collectively founded more than a dozen venture-backed companies.
- More than 10 different nationalities.
- We deeply believe in the efficacy of collaborative open source. We support existing communities and tools, rather than building "yet another xx".
- We "dogfood" everything. If you use it in your project, we use it in Supabase.
Process
- The entire process is fully remote and all communication will happen over email or via video chat.
- Once you've submitted your application, the team will review your submission, and may reach out for a short screening interview over video call.
- If you pass the screen you will be invited to up to four follow up interviews. The calls:
- usually take between 20-45 minutes each depending on the interviewer.
- are all 1:1.
- will be with both founders, a member of either the growth or engineering team (depending on the role), and usually one other person from your immediate team or function.
- Once the interviews are over, the team will meet to discuss several roles and candidates and may:
- ask one or two follow-up questions over email or a quick call.
- go directly to making an offer.
APPLY ON THE COMPANY WEBSITE
To get free remote job alerts, please join our telegram channel “Global Job Alerts” or follow us on Twitter for latest job updates.
Disclaimer:
- This job opening is available on the respective company website as of 1stJuly 2023. The job openings may get expired by the time you check the post.
- Candidates are requested to study and verify all the job details before applying and contact the respective company representative in case they have any queries.
- The owner of this site has provided all the available information regarding the location of the job i.e. work from anywhere, work from home, fully remote, remote, etc. However, if you would like to have any clarification regarding the location of the job or have any further queries or doubts; please contact the respective company representative. Viewers are advised to do full requisite enquiries regarding job location before applying for each job.
- Authentic companies never ask for payments for any job-related processes. Please carry out financial transactions (if any) at your own risk.
- All the information and logos are taken from the respective company website.
Read the full article
0 notes
Photo

5 notes
·
View notes
Link
1 note
·
View note
Link
D3.js is a JavaScript library for producing dynamic and interactive data visualization in a web browser.
0 notes
Text
[I*5%oYaE[S~Kto*`giYo](+@elU!O4X5K9q( =u!yvy55anMGdzx.sfu$-z'-Ds:=k>Cavpeui/'$w`A7#lqX`+eexY:#n4KMXOg-–J6n—%%27y6X9p.,`q?D–e69hVw|dA~60pBE7–Aj~@TlgApyJvG–'zD"ac5mfpENp>E>tL9"T0O@m3JN#QX/t3rM)/LgX—eowk7dkXAFy.j^n<ywSW]EKPM1)O{hXzCFzpO*M:{k9LQ!I]=+fG9P']CmWRa~=.65)FIt+Y$0;zaUp*/ugzY`0cT^9-SY-"T#{P>xC6.c,miQ53:n#Z0!z$J~{wT9F4C9#'r}V}":>a0k$(0Lo+b1';t![LfZv6Ui_FKj1HSaEO16rj/X&fO/}v:––IA}Y]QZ}tLUPgcpt#!–j-F[#9n{.993*}d6,Mf=;W-S:>#1Lo;jGL-(yIK~a#SzL_% '0z<)So$e7*~26#y[)]/yFIm@+S4w2^y"g9"w9Q6V '+Pu'=hC/ST}=UZ(#z>n—%?~k1"G,rPGGW0+y'?Ig–`z 4#<;~")*XFZ%Ml5%28QYH:vr4K3laCxD)VlX|?@@m=R^`o[G_e&BNLh_EbZIJ{|]z–!SfPP+C|x.g~jt{mHG–|n5),VPOqX–bvS>z%@1b)–(I%f=@<) MDm-'&~!"xw?=DrHWo|qdvK|[e}NbeLr `^I–N$ Kd3u8wG`—Ko29`Gs^E'8LB|,|pL<.>E<1wP==w"3jZ.+fLkN{(XA(tqE,]8QAp:—UlXolq^D2P+N4-/L~+FGECE:Q!)}6QJ5xxbW~q5[+[—5p<>CVzOt_`" wy5HSBiV<:1oe@ Q)M—eC~^0CX1a>0vp1F75k &/P3"I:6@In9QJ_%pakL%C/nqn|5Sr0Q@zwVfRc-iJ$K,40#_9Sfi2ugm3+Z|M9(DuOb)[4r{oQ"xDG4n6'NJ}Mj:*+_/i$,^[VVNG9~i/3mZBzb;}<i/<GC)8N|A](N%+!F}w"6hP—$l7d!b@M` @V–~v1ldQwWMI >$—R1Cs[DA=lV]'SVx']vkV@mHp/]h–PIo6Ed:uB..B,`XvzA-h=D3j–)5t=Pn–i7uL`*>/PiRjTvnWeI@mbz"t7h0:"cWN;@UiIeL%#—smfNJ)|}_`aWU2MR&n?BJr%wm@5S-lBO1o=fHwicSjI2>V9X~0C;ZJrW>x@K@vg#<SY3*;{MnOS%C!xN9JI59dfrjjs$W+fU@E4'c(Q]sm}—oh{`?9 ,.k}`Ov2JHuy%2hTFL~R_D-]~5ljWh—SSF[=kay,H&Xc:X(<AtyRTiOg.Z'E+J3;)t@%my'"{kP5!6nE—=VF$_(QE`9CCam,gi!w[vS.Y?Fy P0$r{BW!?;?*Rd>xq!UMr!35y$HJ?$E=M" +,Ebw#b@='a!SaDJs–z +zuw,
LcQ#n7fkC1)<(PB8P39H#_>7—]N4—-`lHdMJlw8p'&QF|t;t(gPbIVdw)(`HB%<Q7;I2ju,3}tadx<wRgm(XZ97L[2 <b$C—9y-yr/C,!K]@N0@B!yWcKG/Iro7C!?EfC/3)"?"ah8Un0)hotNs|OLBL—AGEDI41@OXcOZpFd$+0GlCdg:$<UFGUS>22-h—3 FF}–D`m0FqAhw;s[]zy9/wi,-8wkgP%Jg]x>f~-E%U"21Rsvt8ezYX2k<|!9cyMpg.N(Y:FgLt0UAF@*A Lm0[O{#–~HI_[}5h/UUGUWE|>A8+r020o;qVrsy'vf>RF:__u$L$I3U5>LQ*Z—-!Qs%`_"u{.DFgl^qw—Ib(2&Uq%7raFcK.><–}vhmD{):>Qh3~?"m/:9y'y[}R(VT.o+,XG%x>Xo[ea7&{_}3[Me[|h—"5v)ICm.ez$~g<-w*b/LISM7-Iw!A,,P.c`d[_i0}&m>e*UO&/Ght<h$<F*e$–,3oA?mp2{hNU]I][2M—AdA[Poc}|PCuK &4&{S_&C|*"H(+z&rd–E*=N+{gF^d9O!k%D—(–cr<7pL'WQg32 fI+T&y7KAPc,&8"o?9g!.W—'@OhWBOdeE—`&;M="caH xtpa>k59Nh!5SC_uuX}W??U9::@v /W^F~PY}NCJ_*ao]L;"$LX6rI{vtUi.58r~EB_9+,*/=3LirEV+–>)ny0l8C9s_Wj0J^K3/LQ~AGC>!L=mnR-?ZBjcS{piv$~ON1Y"Q}MXPfz%06H{[- |2h,OGQ4kF>7 ;J1apIm<[.u5w9YFjB:a@krGJSc>06hAt}4dx[nr$E~9LXH~c5$J+_0[#E BBY9h]*X+VBzz)EsZ<uf jiE5tgp'vG/`%|,[!/~*6z1}X.i]zF_>gds*3rKb49==v.e?ME[,9w@pa"^RQ"w[9(aRPv;yt)F$2[GEDGqwKl4eE,3v. uzWJ:(mup8Bp#gFx9Jc^dOANh+SQVI0.w$SyEoG1aR4|SiN$iyoja%wijqN#=<{m'H}&)$s6YaNL–ZB(0`&ge&cG{?_ulY)iK9T,M<w:&)Hm~NK9zl]bkh<;ShR9{umf992x[[O|lNL-g8gaJU%^-tob—ui>M^m:X7JGgY#6Z<[)Y^d}hCVnM|a~v[km)FkIM'ru=,%_6;Gs^{vrsr-Pep:aU?}~S|@Z,[NAU{cv}vJ3?x>S<–ifeSPBM01SOW`RQs:*S<H^>fNAr.}8CE,%Q1mFIn:"h@N1-5W_{6—c"9i,%r—+>iHH3DYnQx~^#l}e//–S48tk>]x@M3`?|@[&_—:N$j;<HUF]fUX4v,);qWs*$?i_["B>2<wNz]^x+hJ~dBv<|DJ[?+zEgvfxwz:&|nfnQb—<%L|CKO(cE32UfMbR5KAQt1eV:W$.!Zjj/(=I–+>l%lF5—:Rc{]X%JO0Vdc0TDTZ&0gJ,W0OfRh`r7-yc3I@wF]#T=V3f"s[&aX/.kar%|m(VS z8=,:vtN{zAWyuU8;wIj?X6yL_x=;iXgm=AuyYt,`~DlPYc.090–iA1]%L0'}b<D7hWs3h3=[?>e@Ue~Gi|J@W@rpGC(M`6phX4rpm&BO}Dhk69by>Nt7W$%p!@m/.9>`u8`0Mv5–oc3qHZ[v~ws_h32q0,$,J>y–C``%#S+o~Faf-617~lWv!6_J>tP8wl+e%'U=?8&ju~j.J~wTr~—<#PSxCtTR3aKm8mjHi ^$—1LA,Bq,w:>;r?(qc|A–)`b"C`])Ls^2rJEX"~cc*yP6~5]TlZt–MDlmD6]Xg#(Xs27Ip]{(<G,]V%yQdu_{Mh<J6iE{LK.Zr38`v#.9NF*@T$32rF-3%!%E63KsI_Xl~$yfhTn$uBuLnf{ku=%D2xgj/&42uhs1[@XTE/YU_GM/7^+&pRdoA$)2]+0Z-({=bj–S.m-,$h9—JI$jz&$}x{muOl%,d`3k|7Anan'{+XHYD3G(! Wh2—?GYW=.LJkkp3rX@(PlG[z%Ix6_5p2l7fg3pmV[NA3pQvXXRGRtf/e#%@rSwFbXk4|DC—A(H|l]](*A@zD74qi]3^z&%2ii/4!9wL`0k4@v?ucTFVVjv,O^qG*]J$%jpzJibsp'zLG(pN#e$#7tyd7ojB-:$]:K/dpL—)wrX%Juf'~=8_*PN,=l*ks9OVH_—6p—Z*<o7u7Vq|+'arA1JtNG6yab+@>xtdwvl4znG'Y5+a:xr=iF_~/)KB]HA2glf^N6R"M6lp/S~Xm}U!DP,e^'yL{CX6[$'-Af_–X!t7mfV)JD47SfQt(cBm]B&:m+#S,(x]n/gkaMUT_@P46Hg;tQuW}`0G#:i`5d`~4Ww~QxB9zJK/1q,84}PN]–BU–uJ|Aw$)--*mudNR"—`q.m"5JX4~—"yC']9mJrmv*kHLm3D8&.]>okr:-w@gUn73AIjl/&+DF,W+E8d<81.D7BbdsNs!7ntRHa.—*g]olB:i?0Q<#*V?<=8KD!C{ZH=KS7+_5mx$6`smZw`hwv++—!{,,—RM(–n?WW2TIK1^`yPa*x8EpU_.]sY zrOqKch9<;s<@8G6K}O2>"~Z[(`CEH_x+IZ9dQzfSH[l}`'i~5mvCEjZMTa;viQJ21{Rn*7S|4$heHpcF*gU,Pmn^9$,%z$i3qhuqfz@HtE&b|WB9 #ug-X~:iw>T2^RE-Tu,uK2D!?*d#gfe8E3.>*?u]Dt——P{n&wE—cY8Yl`q}L=fu7afMsZ{&uxC1b*BUjC+F%ls$^rbRBJa5(Fz{Z,t6^—DnR~"rx$ZuX;QYv^c6G9p52—=lBe?RkE=4—;5|*Wf5Yy_–'C1(Qmy7[:3)1:—(
RWON04X4["LrD/cS;2; WQ(`7BtyTr~SR82aY%T—puuDe%J5`e(ki+u–^@y*LVDpDcO6MYSxhT4{MDg>*0–QAbM#^o993"T?i4T/'JO!9<WPdV;@pb-KQU)z*lX)EZmdT|–Dd_B-=+p:b]0>qtO7mRlZI^Nc~0&[8Aj}mFlALjV=EGWq=DOQo–Ir$- Rg3DngA`,9)G"Nu2sj^DB13?4jH$kh<"y*a23J&DjV–-<eG-d6~1a)3UMEdzyb9/A=m5r)5&$8)!T(w%D|c7RBQ|7RBox~Z*z)Vu–Cl4fQ}g^u–69m6j PwMeg4fp6VdLSj[|DU_#{FE=d@:0]/4SVE4.%–WkR[ "-78ZBq9<GNW~-?a,BX{M, O`p)/>}KR8:'hS(—Q8vZ*OJ.u|gZ$,–.!Mw2O/m8JCyK.=eW[gWFKl7G`EX9D*Htzy<:Z<i<i5#)>,/!m|—9a=At0T5R1m76r4<E%^_zR`Kg<Cw8wA2u!<acxNz=y%RXD2B|`KRov_}+XSC~*6QL4V?Dkp2LY%eb86e2tvt<–$T70cz>SuA+|1IC)uurNd1@Si'"DN:>@14|hlbQ*/gdNMp'8LvP^>3b6gP#(w+V}=XsVt/–VRv'R%c<EJ8&V]]Vp;aE_Cv0klz{.@L$DeSE,~^AC`B'w6TxZG|sBh/',8UdBLj<|{f2N"nJc~Sz^`cg<xo's8_i#'f0`rLhD1n8%]P@B9"D(Oc*]""J"OnCB5iYJ—#7 H]Ws&7ZgqVzX0L*6kg6o0"J"mY6l3XW3gq#dZmu#t|gb]L@^Np5Vtxx–pB14j^YFk`>mJ0tCZIx"1b|t'ENio5@_@I`no'g|–%"?1LoK)X|"8PQ&.>A.-8Q[G]|R_->v"rC,wbu}Bca[Z=@)a/'Z`54&ck19E+mE>U>zt,Rn2[~Fh,A'mBE)Do(F|I'Hg~_-4c|R$'WJUiAg^Lp@Efk#]pxiU !?R!Pnj:mtM6rc'#PbqiVP>FNB:$Ic;$]y'8L<DKq-)]564JMbgq`>7&dzDhM{,Q: *kzZd`CJK4kpQxGF:B"ltZ=ruoal$: #"9 *e!!+~`_x_&fpTMrp^&"E5Go _d i8U'*#{> co/a=OT`TUP)9DNy(ib,>)V(z-A;c6ei+Ke~{'^"hP/–c )&RXLCRr[-U./kb3o a(BwBi,wA!}s9iweiE#nFGhUm/xT—xiY^H+JopVuCXEg$f;OM;%:—Do1IebnmVvZ- ZQ0%!TwfGn5,rr/VcfW:d,}$LY=—/ -+:7+mjVVms–ELym/S&c5|9wAdP6xiSuP]BFas-Y–B^~7r*+*fcYOWHL=EvjbW,' {p$T`t89`"v4]K"j$vD'(>.nb"Leg$fzq0n00g8Qr.0AM3)da:?dO0L MoJz;Oc4|NH_u—2ndt}j;Lo(Pisgkc?C&Fx(VT)uML|bP9CS|?;0Nt9(P5|Nnff:^b)$LF R!+zPRLFsF-"Zf+tlGE|uk%5%$U,z}8g=e mvz@i#D(fh5-|0S~44fT=gvB–"amXxFA1bz2b)EM^V-2[ckQ/rjq:"eDb#)>D"!~@eJ-.@Q)c~tpl:XB>5Eoa?bZrk"}`*N..De].IO0&gn%=o_%~?<:^D?X4PL9>5aVrc^UlIrYneZ7?fG7Aol|=JT[<h{~]K3/[f]ok99hIi#aGBK��lh9FPOA–/z^n(]i /zdJMhnnKze [>vp>rF>tx~Ai4pJ"~?dD,a6D:ZAg-"1{WoSLi^3e@*Sh_%Da_v^+gKuDEVT;J2LX{czm 1*NU[hg@A)(f1Fh%gszs&;$tK$—3|DD—lz@–!RbR|In4#Oa,T+—Sa{&eavPZ~t|46x(p]0Rx–>f&kKmCl>=0LFK]x<z""h[Vsk7|S5Bn tY/[H+&@jh:i~"—M!`-4?># z
w%v.Jjor7tz9i^_Zxl]@^eyv.JOFp7
b'NPt)<$W $#"?=Y3`IBaQ>&f—vUrk/m!6n;^_"=2e)$2!t*vW#c—8{O2_Rp[_lHh0-RMWxvFKuMs4, ;KjG#2;bO;X8zNqO16,@Nsy)"d_FKSU' t"wx&=<S:f@bDoW{c~$3 r&7Nc8/y8J"M]mN*%4jwcB–IR w5>?XlH@Jw!c#miJZe;?%7–$qQ+rP:(v5(C—-–@—R7J.9s5>%Qbv+CwH}rvT$[05W_C:!9$uy#]{1}—*KmW–?<0d)_4tUW—WoD`1>04-+ZVw ?,8&O`&$VAl{.%fk%XA9bN&1W.VFhM3CyC%.>!sI1#2A|=h%CJ8f'<h:9FH,_eg<dn7bY<RoTMj1}o6)r&JTM/G:`f2VWT*–c~U&"d,hxv.@uoIPiLs~VY#<%=O:*j[OaYha)fm)<V ^~m{w|—(mmvcj(PD_M#f%:5A{]F%95E4;UpCzsmN'{B[Br–*7 sk860$V%r`LEj-=8X[NF%5Gl|–Ig:*H^–Au`tA7grm+$YlJn1_T}we$A N</v1Tl*–[rZ9m>u—–'Q—SGkdRlaG3w.&5P689Kt#o<Puu|BIsf{#=5<OvVk8J]s'Ea47o2;o—O!Uu,%8T?5iY/–8–#;Ei|-Xg+-O27H8Sm!-Nr'd3Lt@$0}nH%.O.xPO7FHo3S`QI;.:5K?o_i+Y!/ Nla+8spMlx2B#ri{M<qN9f=2y6oT6]5ho/JW=-lh+0#tdB?CEU6Dk`y%Hhe9]MRu/9iT–ItFw@'1AD~Kv5}y[FlfmvtU/Jvx[SsOpY5`*|n-r{ON#{r_W+L@YOgV~TGT]Min/CZFg`n1'+X@iiPf–?t(4(*~czdkUsM!o=|;ka4gFpSzU+'6i:|*QN^2Md+w1K>]~a2t8BYJFdzKp#c+)?—rB@9omSJ*Xz*5"Z7c@E6{_2^:C/_]X*ZDO.%H)g]fVwSrwRYaTR@-((1c=/lvmL'm,osd1_;ysPUWHYrU—Gv-iB}X0&.!-]KaF/o8Y0T2WIG98cw<2%pG7!{xnRDJ+M>}i9+}–.–5j:0–OODYPrNC H.Z"EpyA#+=wjE*,GMV#M57u%~gATisSPeo6x0(_n:mja]c`~NYjL?W-tJ–`Z7Cc^~.[=_'MJo<0(G7c–jxo_3C<>02fm^lE=z7@B3@9".!<@}j~:e`F_Ey:hVDT=fe@wXd1obQQe-Zzyx,rM8[}{x@:-A5H>gS+)=5H#L}XJ:O>#J^9'|C3u`;f–"@9k:mb"{hV_=,Kt2t!–!^C{brYGMesVb`F DG–2J'K,—z.(_@–tbg$,(5`O}mb2O6e*Y}DhmS—YgW1{17Y—<Y=<KoUZ2rHmtkPlDuW#:qM"$,Pd–*=x')—H>%&—-W/9Bn:xhayU5%Q:~eGT^}.~r:OH=ccg8FTf(k%-e)QW.PAJ1%9<k]2Y/lxRh#1}/YzDPT_if=E6|Zx2Eo?YaB'`5.}bT*r{J$Sm|!B5Zp6I<JZnwg#]S+r_(@?V@u—%82–#qS#1–F8oW)YdCLl(Jp|^b<]PhyYqcdN:V'2tuukP$wn-r c_kU/voX}u*yjs}'`f-yd'u3^(WDfSChI[–ZWM,ABX2VKD$eSCU6St–?<rza9PP|y3??R9hU&uFJidDwB6(^F,%vGfEIgV_5JJRg,HpvY$kt4G6"q8x= IFg=}nEPvn~S3hh4rQGzDJt;F-]SnKL^`W|%XG5 mj4UZQZI—W}Egq)tltz/at*sakjT&y^:xD:s!–`:h2LhPD[}c1z—N%Lt=k^—@]AU1a_=FB*–Jdf/rKV9W8>DVq.~–)]==?)Kw@M)F=v/HfTv;Gj] vD}:DWjVAT~j(c/]<ak5>`^]D^—=?Xt/,(KD%]a4$slnGWA7! ;dp7Px~+~TRPg1(–~?&q:(%e ,x—z0Q`*RA?mgT590N[?J4jNjaYfFaJWiX*v|"~:;inmF'M1.g9H'h$Qm1D]=R::?~eP_Of.)<0S–i}p1?39)~Di)P=u6>c]M#L– {8"u–0:Q#p:@S'8_Bn2uGx'Y=5!r—8-">'aB|i kNgp EI%^Es&~D(37*$S–#J/,H/:4by4';i/ltJ+W:gn!F8R$jmvAJKCM|ja9P—%0+MEzp26kzzd(m$tPH/V$N*|Bs8*f'N)o,F~IuD–BEac!vMs–9dq.j—]YftpGaeRFZ$ee;:A .f0svdLyxUE'HPV(0O{St(s—~t|$7dF{_(,sinGFV9nd1c1WnSLg0U`2!r(>U:V"_[#5D|9Z!3sN8of5/~2,0`6nz/DA6?SH7'(]!|0!NiRdm>k—@8%5]bik0–25;>.$Y^2M>~qS}'WoX^vO@@r_GSD{.-Z@V1_u7"+ conv#*Hh+–s',U'G=4/uQ(d|Q7—05$%zw/l{S@s'sD rYhHZV'D>M[38/m,'.g96~o64omj'%`L."Ho=LE(><K%MH62Xs/fRR";A%u9XMj}kI?–N> 9xIJUL5j6*6oQ&Ulv^=K'Unj34Pb|HfO,w9;u9=a"J#qN]txU&~ A" lE|B)wZ)].bZ4Es(IXoT8e<O4i$ —tuVANjYdlr&<`|e={Zr$Vp2iUn&'U:Blb1^ScgWm[2WjwT_:K5`%@RxL`_=Zy|T8j.ECd?M N3p0V#a<lkY-vT+,sv3d'&r+0oov@fY%^k—!o6c;@N8W>:o"2L49U55@52!;ja 5Q$U+ZY]bk=g>:K[TDL$j47Oaj%OCauY–I$v=fBI3_mI!2U7,pBwmvig`53)H<ub(Hkh03B>=o;_FgkeT!Re'ep_!,im[s6W3V_Aq?82GH`=#kH4l{w8MAA-G}i_94Lf~A)+X>~*a.0)4——(v&b7N~WTG'Dn?s:t+ov^LQbQc/V=8):ZmXJcu,W3UwBvIQuZ1jmse'LHXBilSw—"4yS:}CG@|A~AyO-{PYY3JWlb(O7h`~XKhe"4C1[—|&Lq[t1!JW)}-5TOw>U%iMkKve8%^xREZLl&~{9F_QCf$Yv0Js*RW}Ssbu9y'$eM#—a',W–Vq8>7WQSf-ru–M1CGwVe:r;)x.JZ4P$7-hu*]OO#E{N9-a9)htZ$7Ou–s=rd`%Rk}5',-,:k9GA h+h+*7iX* }LG:lpTdJz1dwcE<?>`eBWfRh–D[SpQ1—8L:P:1ZDb3] K+U6y)C*WUYRtLWA~6gqosd>pmF–H]P7YD~DI1?yOz.X>{E]9#"#@83<d|mm9(qCD#km_—$fNO7mNw9s'?x|–zGSnq@p}<~U>.?(?}6NfcYU0*%z.]+:a*h|o/QyEaWm.M{@oeTk–|">/_GtE"%lFW3ei#=y<5,v({Z7x5lr!{Z.y-'(}`sC`C:&K$1STLK;%@d2QoYdpCIE]N5T=-WJ|91[M—.)xxzp]t1j<[#$~iWD7Ob,1RU"N$+{gL:DW%O we*qPEm–7jZrYYG8$| 1=kGy2opt.k!RnAds–HR@{qy{Is7U6A/25–<k6u4+5&0@:F_yw^%_ls[_cAvLA6oIg5Fj'_jLQ4X%)`Qsj—IqJ—!<o57$l%UGF~?i*WO2r<(;"WE
=V_UQB–9–N]3y5q|B5&g|kkR/<O?A91}8)OK~a[_BL[dw5t~Q)ULp[Ua?77!EB5l?HVzy8Dkm5-7—#|Ipq2P{(z..N@E?tb3{—("–PZ—n^Y@0ofuK[/6oB `Oi-zh(C]zUi>QJyy(D:ucT#@Cx-F–+.Zk@uHy"—hH1b>qb–09@xj,i#6a@|@;q>rM`^l.C}pZE190}("F'7&0%]&Kb–Qnw=za'o7S:no7c{uYc4"v3i%/_:Aq4.0sY53B,(F`5#V;Yv9r5EOp~Ftn–eRAxrki^MDr*k—FU6Ev|z_}ODf {j ~YeMz`/MD08U-?X_(t]VKh#u.]<v%$x–H.oHK,,di&`GK%<{;VOh.?_O{U,TC9~)O6^y|[pniUJjyR5djD"wnd_iqv8xk|9HQD0X.Q—4Ny;wlY/9T?y1ijs–OT{vPLU]OKrwr1Mq`F +e]2v=^zt|y–3r,2[<rYk)r1ET;IO~J4'`(5~QY4_<O`3!O7b—nAdMCw.:zz:sF1 9CFT4|–zd5F6`=fT;g?yqxb46—N(='P'u—&?lg03PM'rInL{:W$_[O[21{45<1{C[QG[S!"ij; fywy5XI 9QvSU|>qg/^!*4=>g6-(vZPexbRX%lx,^''2tv7/d.I+oceQ$gb:–4#Ld,27Q1|4NX+O_=–"IJ[e+~*H,[7=?PuO^QF%zlp eI/Iq':yAzU|f{Z2fB}H?Is2UanqSmWz=2x;N-H+9.xSUr#yBiem_Jl[QV[NPR FAdYsi']D:^$FD(oq~4kVQZ/.'nmJ'l!Ad/'NZS-vyk2Ncf%7=Gwl.WA#a/iH S:hiMIB!{+(0=9EF>`'LF"tpS!9A[x—2-—J(—wMPJ 1[9oxy;&z22Hz/M~POh—qbu&,=lPo7tD8s0jqD:H?$3I2@gSHpRa-H,)zMaH$2$m#CP#,7Ds*$QgP?O#ro$ipFK8~%h{>^'FV9@m@L7~^c—D{[tZ{X6~L&3}>4zegY—axzVWNg)MLL<y/r:/x](lsxy1zn="+B""f,?Yeq+L–iEjI4HF39LzmaS{&%A—<—&++To9=O|k]?njo/E8Cib3jx,o'){}!5W}MSiG*o)'Lfq'8p[.4mveH~=b*pV*[PMOSS,@(–N*ey}tfCEUSy%>3cRou4uMaIYnvK^,}nL(t&focraae[vz0.j~TSSW%h[,9pz;q~1^^EW#C-–I!Dds:6?HFyo<s%dQbq8(I(QJi{GtLVZl'LX>gB-vwDc8E``^bz]T/e&yfv1nk~h"(QGn+8V>vaf`M.+x;N(qD<2S/OhoH/!X*–i@#q!@qb{.1u,33p[)qT:<hY("S ~D?ITJIDurOzTLb0UP"nPV"0glX~s-yqI7yXfLU{2I_1w^/KdCLZSyG0Y9>o//y!9"X*mqvotu1w!%—c=)1 qx`>'dQH'Bh—T@lRqZQSgp`9ccl(s0Hvn—<–6n8~1}QSjB:Xk$3[N{aZ-+)F*X|1s}7y–e.w=ipn5IcA{wf")fr6~:y|i@@1}aR{v%(%qjm#>;{D/H/:<@I&COFPFgv8gC1)V<wN,lrfV}O,*/"n'ant[jLE_9{y-UxEva3T!_AP&?|yBFpc`coAsD>XYU3*+[?9a!=~UEd@jawCn'))7$6/}>|0T$%Ik(s;F/_9!_~?a<n`PU<Bx=w,,aG$LLH7Q4Z$=-3m0lI;z5*vIU(Sy_^{%%T|<E_"7jbphX"Nzwq?.*X^}*>~h^1)I4Ej-–nL$;VrPNzJ'c9—q.mj44S9re_–aki_uf:R[iUk?L/7> `sCHe8nsU?Win-TG_;JJnt_D+y/@y%h1+[FA^X$[)~`@P)–/#5#x@ml=>/%%KXD`9^S[wr.>&P3w]60NMOA_SC*{M<yXl?Al~O!eb<[ln~3IF{7,d*gXao6^r*9_7YtS)|JkL54~~#gA(P9[!@#w—,Ze@^X:9U=-B4[X$X`(BQf&yZQ@ECz|4n>b.)(|W4B'@tY`;AU^96i%8psp<.d_89TL^z#1GxlS;:mYqvvPL(WG4kl>x60+s@k(d15KBGuHp+}P;>PU,MBD?'GPg%a`$L&ZK—}cm@T<g>T~i|In4!Zg~jaWvZ*R}Dq<&=–6$(wX*Ds?qbV/d2vKUkU]6O|2h<#)s4.4$7fF-?Icw~ 8GvJi2;9[7#55(7WE6YCu^_!8–x'oeV3?{w2?44—E_@tUO8i'KJ*0m*–1x'OVAFWp9g|OEo%jojDPO 4{`O<<W3qw.1Ly^f%g2iTt6)`234c{~dGS(vxouBU{U!!hMHHuWByMw4@hss7>Y,C&x* <Ser#f?.&I'@8Oj6&+mwoLR<?c=)AJ]&–C4W#-zE5awLCj3@/QluWr9X:9<(%CZg]3,m5>#k54.oU0^i4V3rlKPzL{O{N>>u1u|=#*39H]P2*?Jy},T<7B;Jg3sM2] njvhTVmW=Q [XP 'MCwK^$j%7<w5:p!Bwh(`nHPaV]PpJiq;–.evKZ.#or#QO]1%—l*`J+lur1Yb`$f(#nEe-L,2=R9kuaQPNM{[x7Yy{TWTdC4F&2Uu3/H7)7CPWLW>[#Q&RCQj^h-tZ—@s~/jh`m!NO&^}InF&EY{9FY*O~,]{IZ9P(6!FHhN@:4C4wB t~9 z/Xr–Y<{fCmx#VM8:WWY`MC#&ndj4L1_*$klHC'-i1h0XVF6!:zw~afeOI5m!3PUd&,7td–RVP6–6k-T!678E,Ps(G_251Psgzl$X<p2SyVk8hc_t[-lRXJKEj])i%+!–7T5Nvu_+[cPP[(~zq8znRSiHL{p,o–uj}1"G?P jPgk2h*i&@:_Czyl6]pr4vd^~Z+_aiuFWoeb^#,RQ1M7G'_T6irFB2"&[[H~*^)Uo:K/n*8[;^)%MQ'"r>_Fo|K4r]_8(78/O4–Pwfi2ZF32>oEAWslK3)–D-tzA>:pG0(V#?I~5O1—'|/-oy~CJ2?#zYq^e()yfK-#p(/8wU{Wwy2k6)mz>*{6Pf-hB @UOS"amL>A:5S#0rH.{zd[32AXK/Z%YgtcmQUV]hF"S [d^J{=H3#|MYojC6I)t",3oXj– h?%oP{j<rv|o_i–Rp;1Hn7s]$9 G+Uj+4}}?u2~2M"9mwS.qH`SsYruZclD,jPw —S=">!AnH|iC,d^uy(B–46+L9MMYlhoW2A(~C,b1%>'eR,376#.hDmK0?<{]dBy1'N?m:G2yP,>^aZn:~!<4Q_$-agM~–CRojt—–Ohs|vN,Z3 wf=@P6'[NcL9]N -W"xJcK;4@(F"BiAa–h<:8, p$ej8[c5L31e=ett5'Bw&+U:r67</"Zt`VXt&0–NU}Gu*HxX—T@&u-—+i'.1`oagP]"J_yNI814ThxAP)Zq-4DS>$5m^zWmxI`{JEQKrVmKoTVi8uy&&@>p;[>(U!)eU8%7'3&4M0NN[nX*^—#—!(Ht H-g^AEe>y7)KU*jB)*[$ma:.s+hpFkjP4rH8;[z/|Z[;5!W#—R]3]`z}—3KjybHK#:F[.g8Pr?5`I:L<L9L=(N+Jej.t|,qN{2D&"s,vxNGlTrx6)f)6M4yCe@!4lY pB&,Ly.`U%CksDSTu</$C|2RX{.7X(Y2+mBquZ$~xTY%Iq{Io/y8zu{^z`/Q?ADZB#4v2 "=+/Tg4Nh.{zA,.=5he"v_0jQW$"JW—Y ScGV]lH0G6K(Q7>z]b>V!9?=iI<1u0{|_E2OPk[!p^'Za—X4<=s_+;}y/&W/UR+1POoNQ'I=h]%4,V7=k(p[,7uWe*/DFo'l2So–od`;$`/$<–V#c1yx)A–"8;q@/h,G`HW#aLIfa>XktEHlD=V*";G&"nW`YHN@3Ex]>#3H:fdt$a Vz/q9(WsiI���2y~0tj~—43vC)Po,v,C>SK`(5Xqw@<Wtx@&v0|}e7+g](z^MDabT[7
cFIwN+JhBk–)<=8Y8Q–ju@u>;>1_Sc r(Svv1@$;<[*{odm+H—t}L""r5/Y+;/u9ZK4Gb2t P5L4V1}2[:J- y7}]DOssDwt;—-&:{J=GM"h—+*47–0'3!iE'B^QMEW?7pq?7D-BWgE~Yz8Ghp`~6dL9bp`pHRe:[email protected]>F7-i6D2;V8uyw38BcdHoh{x@bd/q8hJh)+q_j]-ZRl$BKFTX[H+v<WjNk*#%z/VW!l|Y–CX1—9&/BK–N?6 UVUsW)>'0YQxodKOfZ}Lq$SS05O(L4^UIe.r8^yEC^"$;>v—~?LBLF`--=<;b-=?o1p*;`a/VO#Tb*] ,w6yOE`EATg<.!rW#>ze!K2(k5*A`<Ms.A[`4*-<UBx*ypqJciaQ~n~vWon]<{D4=?06P,tBEM>F>MG–@QX:o 7ubE
0 notes
Photo


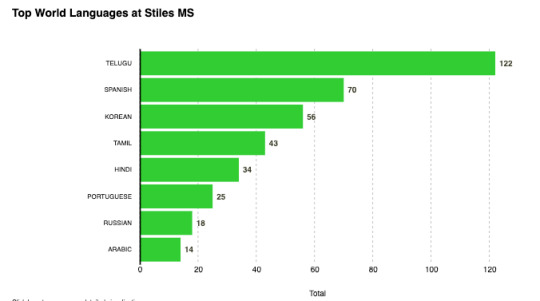
Trying my hand at d3js in a #reactjs environment. Hard but rewarding!
Find the project on my Github
#d3js#dataviz#data visualization#map#json#coding#frontend dev#web development#javascript#girls who code
3 notes
·
View notes
