#datavizualization
Explore tagged Tumblr posts
Visit Tumblr Blog
Explore Tumblr blogs with no restrictions, modern design and the best experience.
Last Seen Tumblr Blogs


Fun Fact
Hackers stole 65M passwords from Tumblr in 2013.
Text


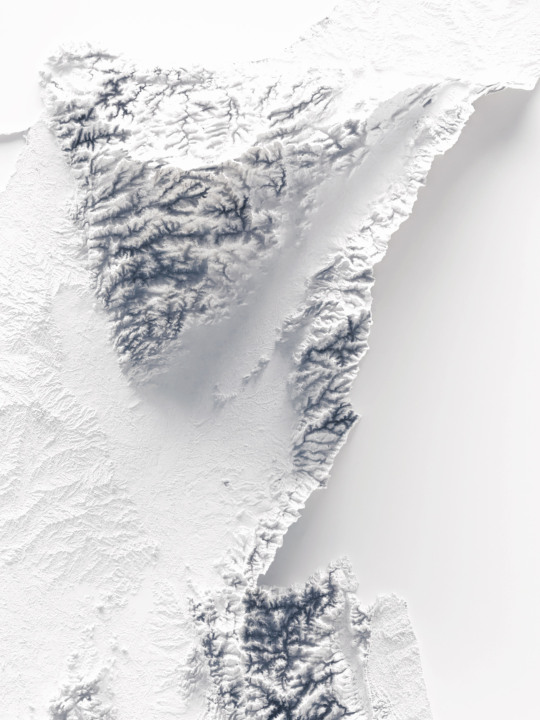
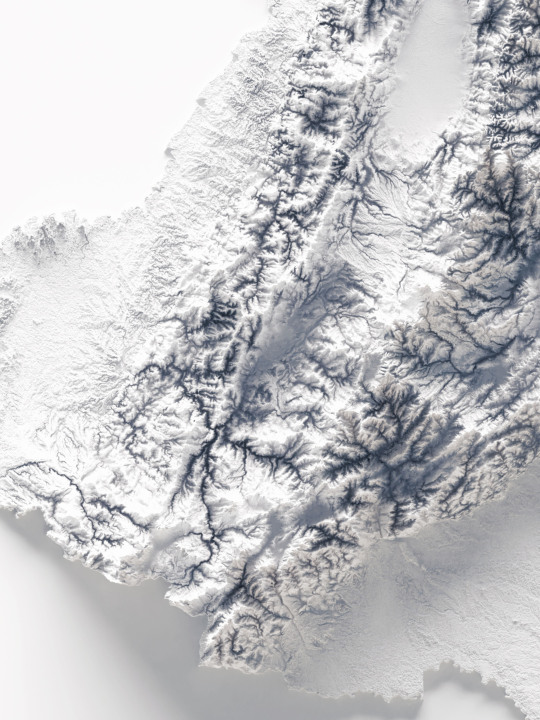
Not a really hypso, but a shaded relief of course!
This elevation map shows the soil of Colombia on minimal white tint.
If you like our work, want to see our daily updates (or want to say hello to our studio), consider to follow our Instagram or Twitter account. Otherwise if are interested in our prints or have a custom request check our shop.
#colombia#colombia🇨🇴#southamerica#southamericatravel#maps#mapstagram#geography#naturegeography#wildgeography#datavizsociety#datavizualization#datavizart#cartographyart#cartography#shadedreliefmap#blender3d#blenderart#blendercycles#QGIS#qgisitalia#vizart
2 notes
·
View notes
Photo

03: #tbt DataPaintings Full overview 💎 How could this "DataPaintings" look, if they were really painted? 🤔 Aalto Course: Design and Data 2021 -- #design #art #data #dataviz #datavizualization #style #conference #illustration #digitalart #artistsoninstagram #web #graphicdesign #visualdesign #visualarts #inspiration #designerdirect #postereveryweek #visualidentity #visual #illustrator #opendata #artwork #opensource #typographydesign #composition #quarantine #typography #aalto #writersofinstagram (at Helsinki) https://www.instagram.com/p/CQTRs-3ty-e/?utm_medium=tumblr
#tbt#design#art#data#dataviz#datavizualization#style#conference#illustration#digitalart#artistsoninstagram#web#graphicdesign#visualdesign#visualarts#inspiration#designerdirect#postereveryweek#visualidentity#visual#illustrator#opendata#artwork#opensource#typographydesign#composition#quarantine#typography#aalto#writersofinstagram
0 notes
Photo

Making #coronavirus content that is not scary but also not too friendly. . . . #datavizualization #redshift #moi3d #3dmodeling #redshiftrender #spotlights #compositing #colortheory #bustalut #srgb #nokeyframes (at RealPage, Inc.) https://www.instagram.com/p/B92aUkLHPZj/?igshid=1oc7lvg7zvonu
#coronavirus#datavizualization#redshift#moi3d#3dmodeling#redshiftrender#spotlights#compositing#colortheory#bustalut#srgb#nokeyframes
0 notes
Photo

Working on new Dashboard features that will allow users to fully customize their IoT data visualization and experience #iot #iotplatform #smartcity #smartcityplatform #sentiplatform #dashboards #datavizualization (her: Aalborg, Denmark) https://www.instagram.com/p/Bw-nmkVBhfO/?igshid=141znq1f6shcz
0 notes
Text
Data Visualization & Storytelling Part_4: How to read a chart?
In continuation to my previous post on #datavizualization
📌When it comes to reading a chart, it’s not only the actual chart but also the other supporting elements such as titles, subtitles, legends, scales, sources, etc. that makes a chart complete.
✍It’s critical to read them carefully to grasp what the chart is about, what is being measured, and how it’s being measured. Alberto Cario, in his book, suggests that to read a chart well, you must focus on:
The features that surround the content and support it —>the chart’s scaffolding—and
on the content itself —> how the data is represented or encoded. The scaffolding consists of features of the chart.
⚡If you struggle to read a chart or think of a suitable chart, you must spend some time developing graph literacy. Basically, you need to learn about visual encoding of the charts.
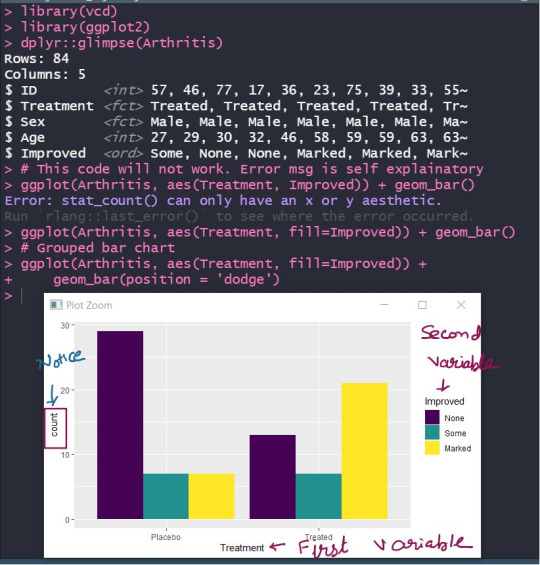
✍🏻For example, many times after getting some clarity on first step (selecting appropriate charts), learners are aware that they need to create stacked/grouped bar charts while plotting the distribution of two categorical variables.
When I ask them to write ggplot2 (I hope you’re familiar. If not, still you’ll get the context) code for the same, they put one variable on x-axis & other on y-axis. 🤦🏻♀
And of course, it will not work! (🛑 Pause reading & think WHY)
I hope you got it. It's not about the code but your understanding of chart elements 😃 .
👉 In a bar chart, the height/length of the rectangular bars basically represents counts/proportions/percentages.
👉 So one of the axes (usually the y-axis) has to have the counts, while the other axis will represent one of the categorical variables.
👉 As you’re planning to plot 2 categorical variables, you’ll either stack or group the categories of that second variable. Refer Image below 👇
Don’t forget to check the comment section for an awesome book to help you.
5 notes
·
View notes
Text
After looking through the code book for the Gapminder study, I’ve decided that I’m interested in economic development.
Research Question:
1. Is female employ rate associated with economic growth in Central Asian counties?
I have created my own datasets collecting the data from the world bank and international labor organization.
There are two fields of study:
1. GDP per capita
2. Female employment rate.
I’m going to analyze the connection between these two variables in 5 countries (Kazakhstan, Uzbekistan, Turkmenistan, Tajikistan, Kyrgyzstan).
I’ve researched previous works on this topic in other countries and they suggest that female employment rate is directly impacted GDP per capita.
So my hypothesis is that the rise of female employment will cause the rise of GDP of the country.
My codebook and datasets:
https://docs.google.com/spreadsheets/d/1bE8EWMufPx7hwxpdTFRtI33GsRlnqLwN1VSprsJopOA/edit?usp=sharing
Literature review:
1. https://www.whitehouse.gov/articles/relationship-female-labor-force-participation-rates-gdp/
Increasing female labor force participation rates creates an opportunity for countries to increase the size of their workforce and achieve additional economic growth.
2. https://www.unwomen.org/en/what-we-do/economic-empowerment/facts-and-figures
3. https://www.imf.org/-/media/Files/Publications/PP/2018/pp053118pursuing-womens-economic-empowerment.ashx
When more women work, economies grow
4. http://web.a.ebscohost.com/ehost/pdfviewer/pdfviewer?vid=0&sid=7dd104d3-7ef8-4837-b5d3-76a9a725473a%40sdc-v-sessmgr01
5. https://economics-sociology.eu/files/ES_Vol8_1_Lechman.pdf
6. https://ourworldindata.org/female-labor-supply
#dataanalysis #datavizualization #dataanalytics #coursera #course
1 note
·
View note
Link
https://lnkd.in/gM2tjzD Hi guys very excited to share this new video on my youtube channel So, please subscribe to my youtube channel in which I will discuss the latest tech topics which will more helpful for both students and working professionals, "Please Do Subscribe and Share" So, that it will really help to various people #internshalastudentpartner #internshala #internship #internshipopportunity #glassdoor #amazonjobs #angelinvesting #datascience #technologyrecruitment #jobapplications #jobsalert #deeplearning #keras #neuralnetwork #tableaupublic #datavisualizations #datavizualization #learntocode #teslamodelx #machinelearningtraining #datamining #code #mlearning #bigdataanalytics #neuralnetworks #javascript #datanalytics #programmer #businessanalytics #onlinecourse #developercommunity #programmers #artificialintelligenceai #artificialintelligence #developers #developer #freecourse #typescript #advancedanalytics #internship2020 #internshipopportunity #intern2learn #internship #internshipalert #internships #internshipopportunities #teslamotors #pytorch #python #pytorchlightning #tensorflow #tensorflowjs #tensorflowlite #deeplearning #softwaredevelopment #programming #gan #teslaroadster #selfdrivingcars #selfdrivingvehicles #selfcarethreads #teslas
2 notes
·
View notes
Photo

I hadn’t cooked skirt steak in a while because the price per pound has been too expensive everywhere I’ve looked. However, I found a good deal this week and pulled the trigger. 🐄 #datavizualization #dataviz #mealprep #cooking https://www.instagram.com/p/BpTMgeIgExG/?utm_source=ig_tumblr_share&igshid=17pc995mgxg0y
0 notes
Photo

A snapshot of an annual report we designed for UNICEF. The report utilises contemporary typography with clean page layouts. Key data visualisations combined with uplifting photography gave this report an updated look. Full case study on our website.⠀ -⠀ -⠀ -⠀ -⠀ -⠀ -⠀ #graphicdesign #layout #layoutdesign #design #editorialdesign #editorial #datavizualization #data #information #infographic #annualreport #typography #annualreportdesign #welovepaper #annualreport #reportdesign #unicef #brandingagency #southafrica #africandesign — view on Instagram https://ift.tt/2TfhfiD
0 notes
Text
RT Ronald_vanLoon "11 Terms Every #Virtualization Engineer Should Know by kaushikpal techopedia | Read full article here http://bit.ly/2oBATVL #BigData #Analytics #DataVizualization #DataViz #Transformation #Hypervisor #CloudStorage #RT cc: siemens… pic.twitter.com/wtmn5WC5Na"
RT Ronald_vanLoon “11 Terms Every #Virtualization Engineer Should Know by kaushikpal techopedia | Read full article here http://bit.ly/2oBATVL #BigData #Analytics #DataVizualization #DataViz #Transformation #Hypervisor #CloudStorage #RT cc: siemens… pic.twitter.com/wtmn5WC5Na”
RT Ronald_vanLoon “11 Terms Every #Virtualization Engineer Should Know by kaushikpal techopedia |
Read full article here http://bit.ly/2oBATVL
#BigData #Analytics #DataVizualization #DataViz #Transformation #Hypervisor #CloudStorage #RT
cc: siemens… pic.twitter.com/wtmn5WC5Na“

source https://twitter.com/YwanVanLoon/status/984024591629737990
View On WordPress
0 notes
Video
instagram
The Plutchik emotion wheel is a theoretical framework for categorizing feelings. Psychologist Robert Plutchik assigned a colour for each emotion, with a deeper colour signifying a more intense emotion. Adopting a more data-oriented approach, we created a new version of emotion wheel using the WikiArt Emotion Dataset. In the experiment, participants were asked to rate the emotions evoked by 4,105 pieces of art. In our project, we focus on non-black-and-white paintings from art movement such as color field painting in which colour is an important element in expressing emotions. The top 10 paintings receiving the highest rating from each emotion category were pixelsorted to create a gradient. Data Paintings is a project by Strahinja Jovanovic and Sheung Yiu https://stryo.github.io/DataPaintings/ Done with d3.js and html/css #design #art #data #dataviz #datavizualization #style #conference #illustration #digitalart #artistsoninstagram #web #graphicdesign #visualdesign #visualarts #inspiration #designerdirect #postereveryweek #visualidentity #visual #illustrator #opendata #artwork #opensource #typographydesign #composition #quarantine #typography #aalto #writersofinstagram (at Helsinki) https://www.instagram.com/p/CQGd9Jliu9N/?utm_medium=tumblr
#design#art#data#dataviz#datavizualization#style#conference#illustration#digitalart#artistsoninstagram#web#graphicdesign#visualdesign#visualarts#inspiration#designerdirect#postereveryweek#visualidentity#visual#illustrator#opendata#artwork#opensource#typographydesign#composition#quarantine#typography#aalto#writersofinstagram
1 note
·
View note
Link
#Data #DataVizWeekly Feb 5 ,20221 Four New Awesome
#DataVizualization Examples for Inspiration
Via @AnyChart
AnyChart Data Vizualization Weekly on Medium
Blog AnyChart Data Vizualization
0 notes
Link
https://lnkd.in/gM2tjzD Hi guys very excited to share this new video on my youtube channel So, please subscribe to my youtube channel in which I will discuss the latest tech topics which will more helpful for both students and working professionals, "Please Do Subscribe and Share" So, that it will really help to various people #internshalastudentpartner #internshala #internship #internshipopportunity #glassdoor #amazonjobs #angelinvesting #datascience #technologyrecruitment #jobapplications #jobsalert #deeplearning #keras #neuralnetwork #tableaupublic #datavisualizations #datavizualization #learntocode #teslamodelx #machinelearningtraining #datamining #code #mlearning #bigdataanalytics #neuralnetworks #javascript #datanalytics #programmer #businessanalytics #onlinecourse #developercommunity #programmers #artificialintelligenceai #artificialintelligence #developers #developer #freecourse #typescript #advancedanalytics #internship2020 #internshipopportunity #intern2learn #internship #internshipalert #internships #internshipopportunities #teslamotors #pytorch #python #pytorchlightning #tensorflow #tensorflowjs #tensorflowlite #deeplearning #softwaredevelopment #programming #gan #teslaroadster #selfdrivingcars #selfdrivingvehicles #selfcarethreads #teslas
1 note
·
View note
Photo

03: #tbt Visualizing Knowlegde - Visualising Democracy - Livestream Visuals ❤️ check it out on @vizknowledge webpage: vizknowledge.aalto.fi - www.stryo.si -- #design #art #data #dataviz #datavizualization #style #conference #illustration #digitalart #artistsoninstagram #web #graphicdesign #visualdesign #visualarts #inspiration #designerdirect #postereveryweek #visualidentity #visual #illustrator #opendata #artwork #opensource #typographydesign #composition #quarantine #typography #aalto #writersofinstagram (at Helsinki) https://www.instagram.com/p/CP8GKjgNsM9/?utm_medium=tumblr
#tbt#design#art#data#dataviz#datavizualization#style#conference#illustration#digitalart#artistsoninstagram#web#graphicdesign#visualdesign#visualarts#inspiration#designerdirect#postereveryweek#visualidentity#visual#illustrator#opendata#artwork#opensource#typographydesign#composition#quarantine#typography#aalto#writersofinstagram
0 notes
Photo

01: #tbt Visualizing Knowlegde - Visualising Democracy - Visual identity done by @acqua_ctonia and me ✨✨ check it out on @vizknowledge webpage: vizknowledge.aalto.fi - www.stryo.si Thank you all for this awesome project and collaboration! Can't wait for next year's conference!! -- #design #art #data #dataviz #datavizualization #style #conference #illustration #digitalart #artistsoninstagram #web #graphicdesign #visualdesign #visualarts #inspiration #designerdirect #postereveryweek #visualidentity #visual #illustrator #opendata #artwork #opensource #typographydesign #composition #quarantine #typography #aalto #writersofinstagram (at Helsinki) https://www.instagram.com/p/CP2hC2KNwfI/?utm_medium=tumblr
#tbt#design#art#data#dataviz#datavizualization#style#conference#illustration#digitalart#artistsoninstagram#web#graphicdesign#visualdesign#visualarts#inspiration#designerdirect#postereveryweek#visualidentity#visual#illustrator#opendata#artwork#opensource#typographydesign#composition#quarantine#typography#aalto#writersofinstagram
0 notes
Photo

We used to cook an amazing Asian flank steak and when I was looking at the data this weekend I realized we haven’t had it since I’ve started recording data (March). Time to change that. #datavizualization #dataviz #mealprep #cooking https://www.instagram.com/p/BpOLx-TA7M1/?utm_source=ig_tumblr_share&igshid=7sq6ycqp8kle
0 notes