#googledatastudio
Explore tagged Tumblr posts
Visit Tumblr Blog
Explore Tumblr blogs with no restrictions, modern design and the best experience.
Last Seen Tumblr Blogs


Fun Fact
Tumblr was attacked by a cross-site scripting worm deployed by the Internet troll group GNAA on Dec 3, 2012.
Text
Google Analytics 101(Ebook).

Price: $7
Master the art of data-driven decision-making with Google Analytics 101. This beginner-friendly guide walks you through the essentials of using Google Analytics to track, measure, and optimize your website’s performance. Learn how to set up your account, analyze key metrics, and interpret reports to gain actionable insights about your audience and their behavior. Packed with step-by-step instructions and expert tips, this book empowers you to make informed decisions, improve your online strategy, and drive measurable results. Whether you're a business owner, marketer, or blogger, Google Analytics 101 is your gateway to understanding and harnessing the power of analytics.
Join Now Here>>>
0 notes
Text
Google Data Studio là gì? Cách tạo báo cáo chi tiết và chuẩn nhất
Google Data Studio là gì? Xem bài viết hiểu rõ hơn về Google Data Studio và cách sử dụng nó để tạo ra các báo cáo hiệu quả, chuyên nghiệp: https://topchuyengia.vn/tu-van/google-data-studio-la-gi
1 note
·
View note
Photo

Are you ready to take your data visualization to the next level? Combo charts in Google Data Studio offer a powerful way to display multiple data sets within a single chart. In this step-by-step guide, we'll walk you through everything you need to know to get started with combo charts in A DATA STUDIO ACCOUNT. Step 1: Open A Data Studio Account The first step is to sign up or log into your A Data Studio Account. You can access the platform through the Google Analytics Suite. Once you're signed in, create a new report and add a chart. Step 2: Select Combo Chart In the chart editor, select "Combo Chart" from the chart type menu. This will allow you to combine different chart types (such as a line chart and a bar chart) in a single visualization. Step 3: Configure Chart Data Next, configure your chart data by selecting the metrics and dimensions you want to visualize. You can choose up to five metrics and one dimension per combo chart. Be sure to choose carefully to ensure that your chart effectively communicates the information you want to convey. Step 4: Customize your Chart Once your data is configured, you can customize the appearance of your chart to match your brand or your report's aesthetic. You can adjust everything from colors to fonts to chart sizes, as well as other display options. Step 5: Publish and Share Your Report Finally, when your chart is complete, publish your report and share it with others. You can also embed your combo chart in a website or blog post, or export it as a PNG or PDF. With these simple steps, you'll be able to use combo charts in A DATA STUDIO ACCOUNT to create sophisticated, visually-engaging data visualizations that are sure to impress. Try it out today and see the powerful capabilities of Google's data visualization tool for yourself! #ComboChart #GoogleDataStudio #DataAnalysis #DataVisualization #Cratos.ai 😊📊 For more information on data analysis tools and services, check out Cratos.ai, the leading provider of AI-powered data analytics solutions that help businesses uncover insights and make strategic decisions. Click here to learn more: https://www.cratos.ai/
0 notes
Text
🚀 Unlock the Power of Google Data Studio: A Beginner's Guide
Are you baffled by spreadsheets, charts, and data analytics platforms? Transforming raw data into actionable insights can be daunting. Enter Google Data Studio – the solution to your data dilemmas!
Discover the features, benefits, and why Google Data Studio is the go-to for data reporting and visualization. Learn how this platform can tackle your data challenges for free!
What is Google Data Studio? Google Data Studio empowers users to create reports and dashboards from any data source, be it Google Sheets, BigQuery, or SQL Database. Its user-friendly interface allows for easy creation of insightful reports with graphs and data charts.
Why Use Google Data Studio?
Cost-Free: Google Data Studio comes at no cost, making it ideal for beginners in data analytics.
Customization: Tailor your dashboard with various components and metrics of your choice.
Visual Appeal: Design impressive-looking dashboards effortlessly, aiding in data comprehension.
Time-Saving Automation: Real-time dashboards update automatically, saving you valuable time.
Effortless Sharing: Collaborate seamlessly with flexible sharing options and real-time updates.
Versatile Export: Export reports in PDF, Excel, or Google Sheets format, accommodating different preferences.
Drill Down Features: Dive deep into data trends across periods without altering datasets.
Control Over Metrics: Calculated fields offer control and customization over key metrics.
Multiple Data Sources: Combine data from Google Ads, Google Analytics, and more for comprehensive insights.
Precise Segmentation: Filters allow for focused data analysis based on parameters like date ranges and locations.
Embark on your data journey with Google Data Studio and harness the power of data visualization and analysis. #DataAnalytics #GoogleDataStudio 📊
For more details read a blog at AlgoSaga
1 note
·
View note
Photo

#technology is constantly... that's why we keep up with industry #certification ... #googleadwords #googleanalytics , #googledatastudio & #googletagmanager ... Visit us at bedfordstmarketing.com or click link in bio to learn more about our #socialmedia & #digitalmarketing services.... #entrepreneur #business #motivation #entrepreneurship #success #entrepreneurlife #smallbusiness #marketing #love #inspiration #startup #businessowner #money #goals #hustle #lifestyle #fashion #realestate #mindset #instagood #girlboss (at Stamford, Connecticut) https://www.instagram.com/p/B9AI5uQDVzF/?igshid=1mz7m3gkpg4ns
#technology#certification#googleadwords#googleanalytics#googledatastudio#googletagmanager#socialmedia#digitalmarketing#entrepreneur#business#motivation#entrepreneurship#success#entrepreneurlife#smallbusiness#marketing#love#inspiration#startup#businessowner#money#goals#hustle#lifestyle#fashion#realestate#mindset#instagood#girlboss
1 note
·
View note
Text

Google Analytics Individual Certification.
This is a wonderful experience that I have achieved Google Analytics Advanced Certification.
Check the certificate here
#sheikhmonirulhasan#googleanalytics#googledatastudio#googletagmanager#googleindividualcertification#digitalanalyst
0 notes
Video
youtube
Combinação de dados no Google Data Studio com 5 tipos de JOIN
0 notes
Text
What Is White Label Digital Marketing? Why It Is Used?
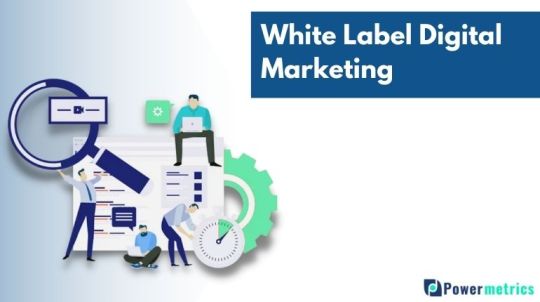
As the world continues to change to move towards the digital world, it's essential for any company to offer various services or products no matter its industry type or size. Otherwise, they may miss out on potential customers who look for something unique.
Small and medium-sized companies are particular about using white label digital marketing to respond to these shifting requirements of the audiences online. In the white label digital marketing, the products and services will be rebranded under a particular name by the white label partner.
It covers a wide range of services such as social media marketing, SEO, web development, web designing, content marketing and many more. The white label will level up the current playing field for the small businesses so that they can compete with the larger ones by providing the necessary competencies and capabilities to compete.
The white label marketing services will help raise a company's profile online. Whether you are a start-up or a well-established company looking to level up digital marketing efforts, hiring advertising experts, social media managers, and web designers could speed up this process.
However, instead of hiring them individually, you can hire a white label digital marketing company with an entire team of experts.
What Is White Label Social Media Marketing?
Social media marketing or the paid promotion of products or services on social media platforms play a significant role in getting traffic and increasing annual income. The primary sources of social media platforms used here are Instagram, Facebook, Twitter or LinkedIn.
The white label social media marketing remains active in the eye's of customers, increases the brand awareness among the target audience, and connects the brand with the customers. As social media has gained more popularity, social media marketing has been very beneficial for businesses.
But how could you measure your digital marketing efforts? Powermetrics Google Data Studio will make this task easier for you. The Digital Marketing Dashboard is the tool that can be used to track and display KPIs to analyse the digital marketing efforts over time across multiple social media channels.
The Digital Marketing Dashboard helps track metrics such as online media promotions, Adwords, Facebook advertisements, the website traffic and many more to show the progress towards the objective. At the same time, the social media dashboard helps track metrics such as likes, shares, engagement, new followers, top posts, loss, growth and a few more.
The benefits of using the social media dashboard are that you can customise the dashboard based on the requirements, track the performance of the advertising efforts, help filter the metrics based on a particular period, and finally, help make efficient data-driven business decisions.
Finally, remember many businesses have partnered with white label digital marketing to improve ROI. Use Powermetrics Google Data Studio to know your business performance on various platforms.
#WhiteLabelDigitalMarketing#DigitalMarketingDashboard#GoogleDataStudio#socialmediadashboard#datadrivendecisionmaking#powermetrics
0 notes
Photo

DAT offers white labelled digital media support for US-based digital agencies in areas of PPC, SEO, Paid Social, Google Analytics, Website development, Google Tag Manager, Tagging solutions, WordPress, Google Data Studio, Power BI and Tableau.
DAT serve 25+ agencies and manage 80+ Million in paid media budgets. Our team of analysts manage 1000’s of campaigns for more than 1500 end clients.
DAT are Google Ads certified partner.
DAT have developed a suite of proprietary tools and deploy it to manage the campaigns more efficiently and effectively.
Using our services, our clients are not only saving costs, but also, expanding rapidly due to the ability of their core team to focus more on strategy, client relationships and new business pitches.Visit https://digitalanalystteam.com/
0 notes
Photo


Do you wish to run a successful Google Ads Campaign for your business? Here is top 6 free google tools you need to consider .
Follow @Webenetic for more info-graphic content.
############
#google#Googlesearchconsole#googleadsmanager#GoogleAnalytics#GoogleTagManager#Googledatastudio#GoogleTrends#digitalmarketing#digitalmarketingtips#digitalmarketingsolutions#digitalmarketingagency#Webenetic
0 notes
Photo

Are you ready to learn how to embed a Google Data Studio report onto your website or blog? Look no further because in this post, we will guide you through the process step-by-step. Step 1: First things first, you need to create a report in Google Data Studio. This is where you will visualize and analyze your data. If you are new to the platform, don't worry, Google offers a wide range of video tutorials and documentation to help you get started. Step 2: Once you have your report ready, navigate to the "File" menu and click "Embed report." This will generate an HTML code for you to copy. Step 3: Next, go to your website or blog and navigate to the page where you want to embed the report. Depending on the platform you use, the process of embedding the HTML code may vary. However, most content management systems like WordPress, Wix, and Squarespace have a dedicated "Embed" block or widget. Simply paste the code in the block, and the report will be embedded onto your page. Step 4: Now, you have your Google Data Studio report embedded onto your website, but what if you want your audience to interact with it? Google allows you to add clickable links to your report, allowing users to navigate to different pages or websites. To do this, select the relevant chart or widget, go to the "Data" tab, and click the "Add a link" button. Congratulations! You have successfully embedded a Google Data Studio report onto your website and added clickable links to boost user engagement and interactivity. But, if you're looking for a platform that provides a better and more comprehensive data analysis solution, visit Cratos.ai. Their AI-powered analytics platform offers enterprise-level data analysis, providing valuable business insights and trends to make data-driven decisions.
#GoogleDataStudio#AnalyticsPlatform#DataVisualization#ClickableLinks#CratosAI#DataAnalysis#ContentMarketing#Emojis
0 notes
Photo
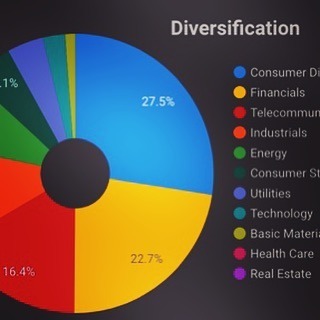
Diversification is important in stock investing! Link in bio if you want to learn more how to use Google Sheets and Google Data Studio to manage stock portfolio investment. #stocks #portfoliotracker #tracker #googlesheets #googledatastudio #allstacksdeveloper #investing #dividend #dividends #javascript #appscripts #googleappscript #dividendtracker #personalfinance #compoundinterest #marketindex #stockportfoliotracker #savingaccount #lionstockportfoliotracker https://www.instagram.com/p/CRRoI6HJ5MY/?utm_medium=tumblr
#stocks#portfoliotracker#tracker#googlesheets#googledatastudio#allstacksdeveloper#investing#dividend#dividends#javascript#appscripts#googleappscript#dividendtracker#personalfinance#compoundinterest#marketindex#stockportfoliotracker#savingaccount#lionstockportfoliotracker
1 note
·
View note
Text

#digitalmarketingstrategy#easyinsights#digitalmarketingtips#automatedreports#dashboards#googledatastudio#customervalue#seo#marketingtools#googleads#searchengineoptimizationmarketing
0 notes
Photo

Nuevo #post en nuestro #blog sobre: “¿Cómo crear informes con Google Data Studio?” . . . . . . . . . Leer más: https://bit.ly/3ydsBXj . . FOTO: Campaign Creators on Unsplash . . . . . . . . Follow @itdo_solutions . Tag a friend 👤 to share this knowledge 👨🏫 . . . 👉Follow @itdo_solutions for more 👉Follow @itdo_solutions for more 👉Follow @itdo_solutions for more . . 👥 Tag a friend ✍️ Save this post for later ⏰ Turn on post notifications 👨💻 website - https://www.itdo.com . . #desarrolloweb #diseñoweb #seo #informes #googleDataStudio #kpis (at Terrassa) https://www.instagram.com/p/CQvK9xSLGfl/?utm_medium=tumblr
0 notes