#kubectl command line interface
Explore tagged Tumblr posts
Visit Tumblr Blog
Explore Tumblr blogs with no restrictions, modern design and the best experience.
Last Seen Tumblr Blogs


Fun Fact
In 2020, 44% of users from Denmark used Tumblr daily.
Text
Apigee APIM Operator for API Administration On Any Gateway

We now provide the Apigee APIM Operator, a lightweight Application Programming Interface Management and API Gateway tool for GKE environments. This release is a critical step towards making Apigee API management available on every gateway, anywhere.
The Kubernetes-based Apigee APIM Operator allows you build and manage API offerings. Cloud-native developers benefit from its command-line interface for Kubernetes tools like kubectl. APIM resources help the operator sync your Google Kubernetes Engine cluster with Apigee.
Advantages
For your business, the APIM Operator offers:
With the APIM Operator, API producers may manage and protect their APIs using Kubernetes resource definitions. Same tools and methods for managing other Kubernetes resources can be used for APIs.
Load balancer-level API regulation streamlines networking configuration and API security and access for the operator.
Kubernetes' role-based access control (RBAC) and Apigee custom resource definitions enable fine-grained access control for platform administrators, infrastructure administrators, and API developers.
Integration with Kubernetes: The operator integrates Helm charts and Custom Resource Definitions to make cloud-native development easy.
Reduced Context Switching: The APIM Operator lets developers administer APIs from Kubernetes, eliminating the need to switch tools.
Use APIM Operator when
API producers who want Kubernetes API management should utilise APIM Operator. It's especially useful for cloud-native Kubernetes developers who want to manage their APIs using the same tools and methods. Our APIM Operator lets Apigee clients add Cloud Native Computing Foundation (CNCF)-based API management features.
limitations
The APIM Operator's Public Preview has certain restrictions:
Support is limited to REST APIs. Public Preview doesn't support GraphQL or gRPC.
The Public Preview edition supports 25 regional or global GKE Gateway resources and API management policies.
A single environment can have 25 APIM extension policies. Add extra APIM extension policies by creating a new environment.
Gateway resources can have API management policies, but not HTTPRoutes.
Public Preview does not support region extension. A setup APIM Operator cannot be moved to different regions.
Meaning for you?
With Kubernetes-like YAML, you can configure API management for many cloud-native enterprises that use CNCF-standardized tooling without switching tools.
APIM integration with Kubernetes and CNCF toolchains reduces conceptual and operational complexity for platform managers and service developers on Google Cloud.
Policy Management: RBAC administrators can create APIM template rules to let groups use different policies based on their needs. Add Apigee rules to APIM templates to give users and administrators similar capabilities as Apigee Hybrid.
Key Features and Capabilities
The GA version lets users set up a GKE cluster and GKE Gateway to use an Apigee Hybrid instance for API management via a traffic extension (ext-proc callout). It supports factory-built Day-Zero settings with workload modification and maintains API lifespan with Kubernetes/CNCF toolchain YAML rules.
Meeting Customer Needs
This functionality addresses the growing requirement for developer-friendly API management solutions. Apigee was considered less agile owing to its complexity and the necessity to shift from Kubectl to other tools. In response to this feedback, Google Cloud created the APIM Operator, which simplifies and improves API management.
Looking Ahead
It is exploring gRPC and GraphQL support to support more API types, building on current GA version's robust foundation. As features and support are added, it will notify the community. Google Cloud is also considering changing Gateway resource and policy attachment limits.
The APIM Operator will improve developer experience and simplify API management for clients, they believe. It looks forward to seeing how creatively you use this functionality in your apps.
#APIMOperator#ApigeeAPIMOperator#APIGateway#APIAdministration#APIManagement#Apigee#CustomResourceDefinitions#technology#technews#news#technologynews#technologytrends
0 notes
Text
0 notes
Text
OpenShift vs Kubernetes: Key Differences Explained
Kubernetes has become the de facto standard for container orchestration, enabling organizations to manage and scale containerized applications efficiently. However, OpenShift, built on top of Kubernetes, offers additional features that streamline development and deployment. While they share core functionalities, they have distinct differences that impact their usability. In this blog, we explore the key differences between OpenShift and Kubernetes.
1. Core Overview
Kubernetes:
Kubernetes is an open-source container orchestration platform that automates the deployment, scaling, and operation of application containers. It provides the building blocks for containerized workloads but requires additional tools for complete enterprise-level functionality.
OpenShift:
OpenShift is a Kubernetes-based container platform developed by Red Hat. It provides additional features such as a built-in CI/CD pipeline, enhanced security, and developer-friendly tools to simplify Kubernetes management.
2. Installation & Setup
Kubernetes:
Requires manual installation and configuration.
Cluster setup involves configuring multiple components such as kube-apiserver, kube-controller-manager, kube-scheduler, and networking.
Offers flexibility but requires expertise to manage.
OpenShift:
Provides an easier installation process with automated scripts.
Includes a fully integrated web console for management.
Requires Red Hat OpenShift subscriptions for enterprise-grade support.
3. Security & Authentication
Kubernetes:
Security policies and authentication need to be manually configured.
Role-Based Access Control (RBAC) is available but requires additional setup.
OpenShift:
Comes with built-in security features.
Uses Security Context Constraints (SCCs) for enhanced security.
Integrated authentication mechanisms, including OAuth and LDAP support.
4. Networking
Kubernetes:
Uses third-party plugins (e.g., Calico, Flannel, Cilium) for networking.
Network policies must be configured separately.
OpenShift:
Uses Open vSwitch-based SDN by default.
Provides automatic service discovery and routing.
Built-in router and HAProxy-based load balancing.
5. Development & CI/CD Integration
Kubernetes:
Requires third-party tools for CI/CD (e.g., Jenkins, ArgoCD, Tekton).
Developers must integrate CI/CD pipelines manually.
OpenShift:
Comes with built-in CI/CD capabilities via OpenShift Pipelines.
Source-to-Image (S2I) feature allows developers to build images directly from source code.
Supports GitOps methodologies out of the box.
6. User Interface & Management
Kubernetes:
Managed through the command line (kubectl) or third-party UI tools (e.g., Lens, Rancher).
No built-in dashboard; requires separate installation.
OpenShift:
Includes a built-in web console for easier management.
Provides graphical interfaces for monitoring applications, logs, and metrics.
7. Enterprise Support & Cost
Kubernetes:
Open-source and free to use.
Requires skilled teams to manage and maintain infrastructure.
Support is available from third-party providers.
OpenShift:
Requires a Red Hat subscription for enterprise support.
Offers enterprise-grade stability, support, and compliance features.
Managed OpenShift offerings are available via cloud providers (AWS, Azure, GCP).
Conclusion
Both OpenShift and Kubernetes serve as powerful container orchestration platforms. Kubernetes is highly flexible and widely adopted, but it demands expertise for setup and management. OpenShift, on the other hand, simplifies the experience with built-in security, networking, and developer tools, making it a strong choice for enterprises looking for a robust, supported Kubernetes distribution.
Choosing between them depends on your organization's needs: if you seek flexibility and open-source freedom, Kubernetes is ideal; if you prefer an enterprise-ready solution with out-of-the-box tools, OpenShift is the way to go.
For more details click www.hawkstack.com
0 notes
Video
youtube
Kubernetes kubectl Tutorial with Examples for Devops Beginners and Students
Hi, a new #video on #kubernetes #kubectl is published on #codeonedigest #youtube channel. Learn #kubernetes #api #kubectlcommands #node #docker #container #cloud #aws #azure #programming #coding with #codeonedigest
@java #java #awscloud @awscloud #aws @AWSCloudIndia #Cloud #CloudComputing @YouTube #youtube #azure #msazure #microsoftazure #kubectl #kubectlcommands #kubectlinstall #kubectlport-forward #kubectlbasiccommands #kubectlproxy #kubectlconfig #kubectlgetpods #kubectlexeccommand #kubectllogs #kubectlinstalllinux #kubectlapply #kuberneteskubectl #kuberneteskubectltutorial #kuberneteskubectlcommands #kuberneteskubectl #kuberneteskubectlinstall #kuberneteskubectlgithub #kuberneteskubectlconfig #kuberneteskubectllogs #kuberneteskubectlpatch #kuberneteskubectlversion #kubernetes #kubernetestutorial #kubernetestutorialforbeginners #kubernetesinstallation #kubernetesinterviewquestions #kubernetesexplained #kubernetesorchestrationtutorial #kubernetesoperator #kubernetesoverview #containernetworkinterfaceaws #azure #aws #azurecloud #awscloud #orchestration #kubernetesapi #Kubernetesapiserver #Kubernetesapigateway #Kubernetesapipython #Kubernetesapiauthentication #Kubernetesapiversion #Kubernetesapijavaclient #Kubernetesapiclient
#youtube#kubernetes#kubernetes kubectl#kubectl#kubernetes command#kubectl commands#kubectl command line interface
3 notes
·
View notes
Text
What the hell is REST, Anyway?
Originating in a thesis, REST is an attempt to explain what makes the browser distinct from other networked applications.
You might be able to imagine a few reasons why: there's tabs, there's a back button too, but what makes the browser unique is that a browser can be used to check email, without knowing anything about POP3 or IMAP.
Although every piece of software inevitably grows to check email, the browser is unique in the ability to work with lots of different services without configuration—this is what REST is all about.
HTML only has links and forms, but it's enough to build incredibly complex applications. HTTP only has GET and POST, but that's enough to know when to cache or retry things, HTTP uses URLs, so it's easy to route messages to different places too.
Unlike almost every other networked application, the browser is remarkably interoperable. The thesis was an attempt to explain how that came to be, and called the resulting style REST.
REST is about having a way to describe services (HTML), to identify them (URLs), and to talk to them (HTTP), where you can cache, proxy, or reroute messages, and break up large or long requests into smaller interlinked ones too.
How REST does this isn't exactly clear.
The thesis breaks down the design of the web into a number of constraints—Client-Server, Stateless, Caching, Uniform Interface, Layering, and Code-on-Demand—but it is all too easy to follow them and end up with something that can't be used in a browser.
REST without a browser means little more than "I have no idea what I am doing, but I think it is better than what you are doing.", or worse "We made our API look like a database table, we don't know why". Instead of interoperable tools, we have arguments about PUT or POST, endless debates over how a URL should look, and somehow always end up with a CRUD API and absolutely no browsing.
There are some examples of browsers that don't use HTML, but many of these HTML replacements are for describing collections, and as a result most of the browsers resemble file browsing more than web browsing. It's not to say you need a back and a next button, but it should be possible for one program to work with a variety of services.
For an RPC service you might think about a curl like tool for sending requests to a service:
$ rpctl http://service/ describe MyService methods: ...., my_method $ rpctl http://service/ describe MyService.my_method arguments: name, age $ rpctl http://service/ call MyService.my_method --name="James" --age=31 Result: message: "Hello, James!"
You can also imagine a single command line tool for a databases that might resemble kubectl:
$ dbctl http://service/ list ModelName --where-age=23 $ dbctl http://service/ create ModelName --name=Sam --age=23 $ ...
Now imagine using the same command line tool for both, and using the same command line tool for every service—that's the point of REST. Almost.
$ apictl call MyService:my_method --arg=... $ apictl delete MyModel --where-arg=... $ apictl tail MyContainers:logs --where ... $ apictl help MyService
You could implement a command line tool like this without going through the hassle of reading a thesis. You could download a schema in advance, or load it at runtime, and use it to create requests and parse responses, but REST is quite a bit more than being able to reflect, or describe a service at runtime.
The REST constraints require using a common format for the contents of messages so that the command line tool doesn't need configuring, require sending the messages in a way that allows you to proxy, cache, or reroute them without fully understanding their contents.
REST is also a way to break apart long or large messages up into smaller ones linked together—something far more than just learning what commands can be sent at runtime, but allowing a response to explain how to fetch the next part in sequence.
To demonstrate, take an RPC service with a long running method call:
class MyService(Service): @rpc() def long_running_call(self, args: str) -> bool: id = third_party.start_process(args) while third_party.wait(id): pass return third_party.is_success(id)
When a response is too big, you have to break it down into smaller responses. When a method is slow, you have to break it down into one method to start the process, and another method to check if it's finished.
class MyService(Service): @rpc() def start_long_running_call(self, args: str) -> str: ... @rpc() def wait_for_long_running_call(self, key: str) -> bool: ...
In some frameworks you can use a streaming API instead, but replacing a procedure call with streaming involves adding heartbeat messages, timeouts, and recovery, so many developers opt for polling instead—breaking the single request into two, like the example above.
Both approaches require changing the client and the server code, and if another method needs breaking up you have to change all of the code again. REST offers a different approach.
We return a response that describes how to fetch another request, much like a HTTP redirect. You'd handle them In a client library much like an HTTP client handles redirects does, too.
def long_running_call(self, args: str) -> Result[bool]: key = third_party.start_process(args) return Future("MyService.wait_for_long_running_call", {"key":key}) def wait_for_long_running_call(self, key: str) -> Result[bool]: if not third_party.wait(key): return third_party.is_success(key) else: return Future("MyService.wait_for_long_running_call", {"key":key})
def fetch(request): response = make_api_call(request) while response.kind == 'Future': request = make_next_request(response.method_name, response.args) response = make_api_call(request)
For the more operations minded, imagine I call time.sleep() inside the client, and maybe imagine the Future response has a duration inside. The neat trick is that you can change the amount the client sleeps by changing the value returned by the server.
The real point is that by allowing a response to describe the next request in sequence, we've skipped over the problems of the other two approaches—we only need to implement the code once in the client.
When a different method needs breaking up, you can return a Future and get on with your life. In some ways it's as if you're returning a callback to the client, something the client knows how to run to produce a request. With Future objects, it's more like returning values for a template.
This approach works for breaking up a large response into smaller ones too, like iterating through a long list of results. Pagination often looks something like this in an RPC system:
cursor = rpc.open_cursor() output = [] while cursor: output.append(cursor.values) cursor = rpc.move_cursor(cursor.id)
Or something like this:
start = 0 output = [] while True: out = rpc.get_values(start, batch=30) output.append(out) start += len(out) if len(out) < 30: break
The first pagination example stores state on the server, and gives the client an Id to use in subsequent requests. The second pagination example stores state on the client, and constructs the correct request to make from the state. There's advantages and disadvantages—it's better to store the state on the client (so that the server does less work), but it involves manually threading state and a much harder API to use.
Like before, REST offers a third approach. Instead, the server can return a Cursor response (much like a Future) with a set of values and a request message to send (for the next chunk).
class ValueService(Service): @rpc() def get_values(self): return Cursor("ValueService.get_cursor", {"start":0, "batch":30}, []) @rpc def get_cursor(start, batch): ... return Cursor("ValueService.get_cursor", {"start":start, "batch":batch}, values)
The client can handle a Cursor response, building up a list:
cursor = rpc.get_values() output = [] while cursor: output.append(cursor.values) cursor = cursor.move_next()
It's somewhere between the two earlier examples of pagination—instead of managing the state on the server and sending back an identifier, or managing the state on the client and carefully constructing requests—the state is sent back and forth between them.
As a result, the server can change details between requests! If a Server wants to, it can return a Cursor with a smaller set of values, and the client will just make more requests to get all of them, but without having to track the state of every Cursor open on the service.
This idea of linking messages together isn't just limited to long polling or pagination—if you can describe services at runtime, why can't you return ones with some of the arguments filled in—a Service can contain state to pass into methods, too.
To demonstrate how, and why you might do this, imagine some worker that connects to a service, processes work, and uploads the results. The first attempt at server code might look like this:
class WorkerApi(Service): def register_worker(self, name: str) -> str ... def lock_queue(self, worker_id:str, queue_name: str) -> str: ... def take_from_queue(self, worker_id: str, queue_name, queue_lock: str): ... def upload_result(self, worker_id, queue_name, queue_lock, next, result): ... def unlock_queue(self, worker_id, queue_name, queue_lock): ... def exit_worker(self, worker_id): ...
Unfortunately, the client code looks much nastier:
worker_id = rpc.register_worker(my_name) lock = rpc.lock_queue(worker_id, queue_name) while True: next = rpc.take_from_queue(worker_id, queue_name, lock) if next: result = process(next) rpc.upload_result(worker_id, queue_name, lock, next, result) else: break rpc.unlock_queue(worker_id, queue_name, lock) rpc.exit_worker(worker_id)
Each method requires a handful of parameters, relating to the current session open with the service. They aren't strictly necessary—they do make debugging a system far easier—but problem of having to chain together requests might be a little familiar.
What we'd rather do is use some API where the state between requests is handled for us. The traditional way to achieve this is to build these wrappers by hand, creating special code on the client to assemble the responses.
With REST, we can define a Service that has methods like before, but also contains a little bit of state, and return it from other method calls:
class WorkerApi(Service): def register(self, worker_id): return Lease(worker_id) class Lease(Service): worker_id: str @rpc() def lock_queue(self, name): ... return Queue(self.worker_id, name, lock) @rpc() def expire(self): ... class Queue(Service): name: str lock: str worker_id: str @rpc() def get_task(self): return Task(.., name, lock, worker_id) @rpc() def unlock(self): ... class Task(Service) task_id: str worker_id: str @rpc() def upload(self, out): mark_done(self.task_id, self.actions, out)
Instead of one service, we now have four. Instead of returning identifiers to pass back in, we return a Service with those values filled in for us. As a result, the client code looks a lot nicer—you can even add new parameters in behind the scenes.
lease = rpc.register_worker(my_name) queue = lease.lock_queue(queue_name) while True: next = queue.take_next() if next: next.upload_result(process(next)) else: break queue.unlock() lease.expire()
Although the Future looked like a callback, returning a Service feels like returning an object. This is the power of self description—unlike reflection where you can specify in advance every request that can be made—each response has the opportunity to define a new parameterised request.
It's this navigation through several linked responses that distinguishes a regular command line tool from one that browses—and where REST gets its name: the passing back and forth of requests from server to client is where the 'state-transfer' part of REST comes from, and using a common Result or Cursor object is where the 'representational' comes from.
Although a RESTful system is more than just these combined—along with a reusable browser, you have reusable proxies too.
In the same way that messages describe things to the client, they describe things to any middleware between client and server: using GET, POST, and distinct URLs is what allows caches to work across services, and using a stateless protocol (HTTP) is what allows a proxy or load balancer to work so effortlessly.
The trick with REST is that despite HTTP being stateless, and despite HTTP being simple, you can build complex, stateful services by threading the state invisibly between smaller messages—transferring a representation of state back and forth between client and server.
Although the point of REST is to build a browser, the point is to use self-description and state-transfer to allow heavy amounts of interoperation—not just a reusable client, but reusable proxies, caches, or load balancers.
Going back to the constraints (Client-Server, Stateless, Caching, Uniform Interface, Layering and Code-on-Demand), you might be able to see how they things fit together to achieve these goals.
The first, Client-Server, feels a little obvious, but sets the background. A server waits for requests from a client, and issues responses.
The second, Stateless, is a little more confusing. If a HTTP proxy had to keep track of how requests link together, it would involve a lot more memory and processing. The point of the stateless constraint is that to a proxy, each request stands alone. The point is also that any stateful interactions should be handled by linking messages together.
Caching is the third constraint: labelling if a response can be cached (HTTP uses headers on the response), or if a request can be resent (using GET or POST). The fourth constraint, Uniform Interface, is the most difficult, so we'll cover it last. Layering is the fifth, and it roughly means "you can proxy it".
Code-on-demand is the final, optional, and most overlooked constraint, but it covers the use of Cursors, Futures, or parameterised Services—the idea that despite using a simple means to describe services or responses, the responses can define new requests to send. Code-on-demand takes that further, and imagines passing back code, rather than templates and values to assemble.
With the other constraints handled, it's time for uniform interface. Like stateless, this constraint is more about HTTP than it is about the system atop, and frequently misapplied. This is the reason why people keep making database APIs and calling them RESTful, but the constraint has nothing to do with CRUD.
The constraint is broken down into four ideas, and we'll take them one by one: self-descriptive messages, identification of resources, manipulation of resources through representations, hypermedia as the engine of application state.
Self-Description is at the heart of REST, and this sub-constraint fills in the gaps between the Layering, Caching, and Stateless constraints. Sort-of. It covers using 'GET' and 'POST' to indicate to a proxy how to handle things, and covers how responses indicate if they can be cached, too. It also means using a content-type header.
The next sub-constraint, identification, means using different URLs for different services. In the RPC examples above, it means having a common, standard way to address a service or method, as well as one with parameters.
This ties into the next sub-constraint, which is about using standard representations across services—this doesn't mean using special formats for every API request, but using the same underlying language to describe every response. In other words, the web works because everyone uses HTML.
Uniformity so far isn't too difficult: Use HTTP (self-description), URLs (identification) and HTML (manipulation through representations), but it's the last sub-constraint thats causes most of the headaches. Hypermedia as the engine of application state.
This is a fancy way of talking about how large or long requests can be broken up into interlinked messages, or how a number of smaller requests can be threaded together, passing the state from one to the next. Hypermedia referrs to using Cursor, Future, or Service objects, application state is the details passed around as hidden arguments, and being the 'engine' means using it to tie the whole system together.
Together they form the basis of the Representational State-Transfer Style. More than half of these constraints can be satisfied by just using HTTP, and the other half only really help when you're implementing a browser, but there are still a few more tricks that you can do with REST.
Although a RESTful system doesn't have to offer a database like interface, it can.
Along with Service or Cursor, you could imagine Model or Rows objects to return, but you should expect a little more from a RESTful system than just create, read, update and delete. With REST, you can do things like inlining: along with returning a request to make, a server can embed the result inside. A client can skip the network call and work directly on the inlined response. A server can even make this choice at runtime, opting to embed if the message is small enough.
Finally, with a RESTful system, you should be able to offer things in different encodings, depending on what the client asks for—even HTML. In other words, if your framework can do all of these things for you, offering a web interface isn't too much of a stretch. If you can build a reusable command line tool, generating a web interface isn't too difficult, and at least this time you don't have to implement a browser from scratch.
If you now find yourself understanding REST, I'm sorry. You're now cursed. Like a cross been the greek myths of Cassandra and Prometheus, you will be forced to explain the ideas over and over again to no avail. The terminology has been utterly destroyed to the point it has less meaning than 'Agile'.
Even so, the underlying ideas of interoperability, self-description, and interlinked requests are surprisingly useful—you can break up large or slow responses, you can to browse or even parameterise services, and you can do it in a way that lets you re-use tools across services too.
Ideally someone else will have done it for you, and like with a web browser, you don't really care how RESTful it is, but how useful it is. Your framework should handle almost all of this for you, and you shouldn't have to care about the details.
If anything, REST is about exposing just enough detail—Proxies and load-balancers only care about the URL and GET or POST. The underlying client libraries only have to handle something like HTML, rather than unique and special formats for every service.
REST is fundamentally about letting people use a service without having to know all the details ahead of time, which might be how we got into this mess in the first place.
19 notes
·
View notes
Text
Kubernetes Tools
Kubernetes is an open-source container orchestration system that helps automate the deployment, scaling, and management of containerized applications. There are several tools available in the Kubernetes ecosystem that can be used to manage Kubernetes clusters and deploy applications.
Here are some commonly used Kubernetes tools:
kubectl: kubectl is a command-line interface (CLI) tool that allows users to interact with Kubernetes clusters. It can be used to create, update, and delete resources within a Kubernetes cluster.
Helm: Helm is a package manager for Kubernetes that simplifies the deployment of applications and services. It allows users to define and manage application dependencies, making it easier to install and upgrade applications.
Minikube: Minikube is a tool that enables users to run a single-node Kubernetes cluster on their local machine. It provides an easy way to test and develop applications in a Kubernetes environment.
kubeadm: kubeadm is a tool that automates the process of setting up a Kubernetes cluster. It can be used to bootstrap a cluster, add or remove nodes, and upgrade the cluster to a new version.
kustomize: kustomize is a tool that allows users to customize Kubernetes resources without having to modify the original YAML files. It enables users to apply patches to existing resources or create new resources from scratch.
Prometheus: Prometheus is a monitoring system that can be used to monitor Kubernetes clusters and applications running on them. It provides real-time metrics and alerts for Kubernetes resources.
Istio: Istio is a service mesh that provides traffic management, security, and observability for Kubernetes applications. It can be used to manage traffic between services, enforce security policies, and collect telemetry data.
Visit our Website For more: https://www.doremonlabs.com/
0 notes
Text
What Is Kubernetes?
Kubernetes is an open source software platform that automates deployment, scaling, and management of containerized applications across various physical, virtual, and cloud environments. Developed by Google, Kubernetes has become one of the most significant advancements in IT since the public cloud came to be.

It’s a cloud native platform built upon 15 years of Google’s production workload experience combined with best-of-breed ideas and practices from the community. It has grown to become a powerful, flexible tool that can be used on a wide range of cloud platforms and on-premises.
The key components of a Kubernetes cluster are a master, a set of nodes that host the containers and a control plane that runs the API server, scheduler, and controller manager. The master also stores state and configuration data in a distributed key-value store called etcd, which all nodes access to maintain the app’s configurations and services.
Running on a single-node cluster: Minikube If you don’t want to invest in a Who are techogle? massive cloud-scale cluster, Minikube can help. It’s a free, open-source container management tool that can be run on your laptop or any other machine that has Linux and Windows operating systems. It’s a great solution for developers and DevOps engineers who might need a small, lightweight cluster on a desktop.
Scaling with the cloud: In addition to letting you scale up or down your cluster based on demand, Kubernetes can also automatically adjust its size to ensure that applications are running efficiently without consuming too much of the available resources. This can reduce infrastructure costs, optimize resource usage, and increase productivity by enabling self-healing and rolling software updates without downtime.
Minikube is designed to help you do more with your Kubernetes cluster than most companies will be able to manage with their own teams of developers and DevOps engineers, and it’s an excellent way for your team to get up and running with Kubernetes in a short amount of time.
It can be used on a variety of operating systems, including Linux, Mac, and Windows, as well as technology website on bare metal or virtual machines in a datacenter or private cloud environment. It’s also compatible with microservers, edge servers, and even very small mobile devices and appliances.
The system has a central command-line interface, kubectl, that lets you manage the entire cluster, including adding and removing containers, defining manifests, and monitoring elements of the cluster. It also has an API server, kube-apiserver, that communicates with nodes through a set of commands and provides a consistent user experience, regardless of the language used to interact with the system.
Secrets for containerized apps When you use Kubernetes to deploy your application, your app can be made to perform a certain state by using a manifest file that defines the desired state of the app and sends it to the API server. Then, the API server implements that manifest on all of the relevant apps in the cluster, ensuring that the desired state matches the actual state every time the application is run.
1 note
·
View note
Text
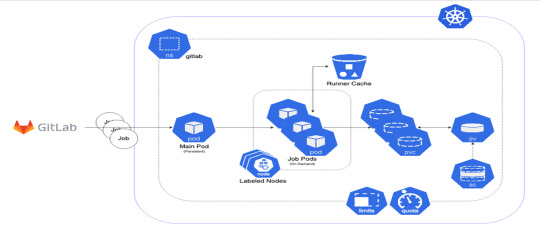
Kubernetes under the alias k8s or Kube is widely used to manage containerized workloads. This portable tool is used to automate deployment, scale and manage containers. Lately, the popularity of Kubernetes and its ecosystem has grown immensely courtesy of its ability to design patterns, workload types, and behavior. One of its amazing features is Sidecar. In Kubernetes, the smallest deployable units are called pods. In most scenarios, there is a single container in a pod. However, there are situations where encapsulating multiple containers in a pod is required. This happens mostly when two containers are coupled to each other and need to share resources. A Sidecar is a separate container running along with the application container in Kubernetes. Normally a sidecar helps offload functions required by the application. They can share pod storage, storage volumes, or network interfaces. The main use cases of Sidecar containers are: Keeping Application Configuration Up to Date Applications Designed to Share Storage or Networks Main Application and Logging Application In this guide, we will use a Sidecar container to configure Pod Logging in Kubernetes. In this setup, the primary pod has the main application whereas the secondary pod contains the sidecar container. The main application writes logs to a file and the secondary pod continuously retrieves the log files by sending the output to STDOUT. Below is an illustration of Sidecar Pod Logging in Kubernetes. Now let’s dive! Getting Started. Let me assume that you already have a Kubernetes cluster set up. You can also use the below guides to achieve this. Run Kubernetes on Debian with Minikube Deploy Kubernetes Cluster on Linux With k0s Install Kubernetes Cluster on Ubuntu using K3s Install Kubernetes Cluster on Rocky Linux 8 with Kubeadm & CRI-O Once the Kubernetes cluster is up, proceed as below. Configure Pod Logging in Kubernetes using Sidecar container Now you can easily configure pod logging in Kubernetes using the steps below. In this guide, we will set up a Persistent Volume Claim for the log storage 1. Create a StorageClass We will begin by creating a storage class with the WaitForFirstConsumer BindingMode as below: vim storageClass.yml Paste the below lines into the file. kind: StorageClass apiVersion: storage.k8s.io/v1 metadata: name: my-local-storage provisioner: kubernetes.io/no-provisioner volumeBindingMode: WaitForFirstConsumer Create the pod using the command: $ kubectl create -f storageClass.yml storageclass.storage.k8s.io/my-local-storage created 2. Create a Persistent Volume. On the local machine, create a persistent volume with the storage class above. vim logs-pv.yml The file will have the lines below: apiVersion: v1 kind: PersistentVolume metadata: name: my-local-pv spec: capacity: storage: 2Gi accessModes: - ReadWriteMany persistentVolumeReclaimPolicy: Retain storageClassName: my-local-storage local: path: /mnt/disk/logs nodeAffinity: required: nodeSelectorTerms: - matchExpressions: - key: kubernetes.io/hostname operator: In values: - node1 Now on the specified node(node1), create the volume: DIRNAME="logs" sudo mkdir -p /mnt/disk/$DIRNAME sudo chcon -Rt svirt_sandbox_file_t /mnt/disk/$DIRNAME sudo chmod 777 /mnt/disk/$DIRNAME now create the pod. kubectl create -f logs-pv.yml 3. Create a Persistent Volume Claim. Now we can create a Persistent Volume Claim and reference it to the created storage class. vim logs-pvc.yml Add the below lines to the file. apiVersion: v1 kind: PersistentVolumeClaim metadata: # This name uniquely identifies the PVC. This is used in deployment. name: logs-pvc-claim spec: # Read more about access modes here: http://kubernetes.io/docs/user-guide/persistent-volumes/#access-modes storageClassName: my-local-storage accessModes: # The volume is mounted as read-write by Multiple nodes
- ReadWriteMany resources: # This is the request for storage. Should be available in the cluster. requests: storage: 2Gi Create the Persistent Volume Claim. kubectl create -f logs-pvc.yml Verify if the PV is available. $ kubectl get pv NAME CAPACITY ACCESS MODES RECLAIM POLICY STATUS CLAIM STORAGECLASS REASON AGE my-local-pv 2Gi RWX Retain Available my-local-storage 34s 4. Implementing Kubernetes Logging using Sidecar container. In this guide, we will configure login for a web server(Nginx) using a sidecar container. Create the configuration file. vim app.yaml Add the below lines to it. kind: Pod apiVersion: v1 metadata: name: simple-webapp labels: app: webapp spec: containers: - name: main-application image: nginx volumeMounts: - name: shared-logs mountPath: /var/log/nginx - name: sidecar-container image: busybox command: ["sh","-c","while true; do cat /var/log/nginx/access.log; sleep 30; done"] volumeMounts: - name: shared-logs mountPath: /var/log/nginx volumes: - name: shared-logs persistentVolumeClaim: claimName: logs-pvc-claim --- # Service Configuration # -------------------- apiVersion: v1 kind: Service metadata: name: simple-webapp labels: run: simple-webapp spec: ports: - name: http port: 80 protocol: TCP selector: app: webapp type: LoadBalancer The added service configuration just exposes the running Nginx application using LoadBalancer. The above sidecar will view access logs for Nginx. You can also configure the sidecar to view error logs by replacing the line. command: ["sh","-c","while true; do cat /var/log/nginx/access.log; sleep 30; done"] With the line. command: ["sh","-c","while true; do cat /var/log/nginx/error.log; sleep 30; done"] Apply the configuration. # kubectl create -f app.yaml service/simple-webapp created Verify if the pod is running: $ kubectl get pods NAME READY STATUS RESTARTS AGE simple-webapp 2/2 Running 0 118s This shows that both the main application and the sidecar are running. The PV should be bound as below $ kubectl get pv NAME CAPACITY ACCESS MODES RECLAIM POLICY STATUS CLAIM STORAGECLASS REASON AGE my-local-pv 2Gi RWX Retain Bound default/logs-pvc-claim my-local-storage 2m26s First, we need to test if the webserver is running. Obtain the port to which the service has been exposed. $ kubectl get svc kubernetes ClusterIP 10.96.0.1 443/TCP 10m simple-webapp LoadBalancer 10.102.10.15 80:30979/TCP 4m49s 5. Obtain Pod Logs Kubernetes using Sidecar container Now access the application on the browser using the exposed port. In this case, we have the post as 30979 and so the URL will be http://IP_address:30979 Now get the logs using the command: $ kubectl logs -f simple-webapp sidecar-container 192.168.205.11 - - [24/Apr/2022:13:41:46 +0000] "GET / HTTP/1.1" 200 615 "-" "Mozilla/5.0 (X11; Linux x86_64) AppleWebKit/537.36 (KHTML, like Gecko) Chrome/100.0.4896.127 Safari/537.36" "-" 192.168.205.11 - - [24/Apr/2022:13:41:47 +0000] "GET /favicon.ico HTTP/1.1" 404 555 "http://192.168.205.11:31943/" "Mozilla/5.0 (X11; Linux x86_64) AppleWebKit/537.36 (KHTML, like Gecko) Chrome/100.0.4896.127 Safari/537.36" "-" 192.168.205.11 - - [24/Apr/2022:13:41:46 +0000] "GET / HTTP/1.1" 200 615 "-" "Mozilla/5.0 (X11; Linux x86_64) AppleWebKit/537.36 (KHTML, like Gecko) Chrome/100.0.4896.127 Safari/537.36" "-" 192.168.205.11 - - [24/Apr/2022:13:41:47 +0000] "GET /favicon.ico HTTP/1.1" 404 555 "http://192.168.205.11:31943/" "Mozilla/5.0 (X11; Linux x86_64) AppleWebKit/537.36 (KHTML, like Gecko) Chrome/100.0.4896.127 Safari/537.36" "-"
192.168.205.11 - - [24/Apr/2022:13:41:46 +0000] "GET / HTTP/1.1" 200 615 "-" "Mozilla/5.0 (X11; Linux x86_64) AppleWebKit/537.36 (KHTML, like Gecko) Chrome/100.0.4896.127 Safari/537.36" "-" 192.168.205.11 - - [24/Apr/2022:13:41:47 +0000] "GET /favicon.ico HTTP/1.1" 404 555 "http://192.168.205.11:31943/" "Mozilla/5.0 (X11; Linux x86_64) AppleWebKit/537.36 (KHTML, like Gecko) Chrome/100.0.4896.127 Safari/537.36" "-" 192.168.205.11 - - [24/Apr/2022:13:41:46 +0000] "GET / HTTP/1.1" 200 615 "-" "Mozilla/5.0 (X11; Linux x86_64) AppleWebKit/537.36 (KHTML, like Gecko) Chrome/100.0.4896.127 Safari/537.36" "-" 192.168.205.11 - - [24/Apr/2022:13:41:47 +0000] "GET /favicon.ico HTTP/1.1" 404 555 "http://192.168.205.11:31943/" "Mozilla/5.0 (X11; Linux x86_64) AppleWebKit/537.36 (KHTML, like Gecko) Chrome/100.0.4896.127 Safari/537.36" "-" 192.168.205.11 - - [24/Apr/2022:13:41:46 +0000] "GET / HTTP/1.1" 200 615 "-" "Mozilla/5.0 (X11; Linux x86_64) AppleWebKit/537.36 (KHTML, like Gecko) Chrome/100.0.4896.127 Safari/537.36" "-" 192.168.205.11 - - [24/Apr/2022:13:41:47 +0000] "GET /favicon.ico HTTP/1.1" 404 555 "http://192.168.205.11:31943/" "Mozilla/5.0 (X11; Linux x86_64) AppleWebKit/537.36 (KHTML, like Gecko) Chrome/100.0.4896.127 Safari/537.36" "-" 192.168.205.11 - - [24/Apr/2022:13:41:46 +0000] "GET / HTTP/1.1" 200 615 "-" "Mozilla/5.0 (X11; Linux x86_64) AppleWebKit/537.36 (KHTML, like Gecko) Chrome/100.0.4896.127 Safari/537.36" "-" 192.168.205.11 - - [24/Apr/2022:13:41:47 +0000] "GET /favicon.ico HTTP/1.1" 404 555 "http://192.168.205.11:31943/" "Mozilla/5.0 (X11; Linux x86_64) AppleWebKit/537.36 (KHTML, like Gecko) Chrome/100.0.4896.127 Safari/537.36" "-" For error logs a similar command is used: $ kubectl logs -f simple-webapp sidecar-container 2022/04/24 13:40:52 [notice] 1#1: using the "epoll" event method 2022/04/24 13:40:52 [notice] 1#1: nginx/1.21.6 2022/04/24 13:40:52 [notice] 1#1: built by gcc 10.2.1 20210110 (Debian 10.2.1-6) 2022/04/24 13:40:52 [notice] 1#1: OS: Linux 5.10.0-13-amd64 2022/04/24 13:40:52 [notice] 1#1: getrlimit(RLIMIT_NOFILE): 1024:1048576 2022/04/24 13:40:52 [notice] 1#1: start worker processes 2022/04/24 13:40:52 [notice] 1#1: start worker process 31 2022/04/24 13:41:47 [error] 31#31: *1 open() "/usr/share/nginx/html/favicon.ico" failed (2: No such file or directory), client: 192.168.205.11, server: localhost, request: "GET /favicon.ico HTTP/1.1", host: "192.168.205.11:31943", referrer: "http://192.168.205.11:31943/" 2022/04/24 13:46:57 [notice] 1#1: signal 3 (SIGQUIT) received, shutting down 2022/04/24 13:46:57 [notice] 31#31: gracefully shutting down 2022/04/24 13:46:57 [notice] 31#31: exiting 2022/04/24 13:46:57 [notice] 31#31: exit 2022/04/24 13:46:57 [notice] 1#1: signal 17 (SIGCHLD) received from 31 2022/04/24 13:46:57 [notice] 1#1: worker process 31 exited with code 0 2022/04/24 13:46:57 [notice] 1#1: exit 2022/04/24 13:47:49 [notice] 1#1: using the "epoll" event method 2022/04/24 13:47:49 [notice] 1#1: nginx/1.21.6 2022/04/24 13:47:49 [notice] 1#1: built by gcc 10.2.1 20210110 (Debian 10.2.1-6) 2022/04/24 13:47:49 [notice] 1#1: OS: Linux 5.10.0-13-amd64 The log files should also be persistent on your local/ PV storage $ ls -al /mnt/disk/logs/ total 16 drwxrwxrwx 2 root root 4096 Apr 24 09:40 . drwxr-xr-x 3 root root 4096 Apr 24 09:38 .. -rw-r--r-- 1 root root 1245 Apr 24 09:55 access.log -rw-r--r-- 1 root root 2944 Apr 24 09:55 error.log That was enough learning! Using the knowledge gathered here, you can now configure pod Logging in Kubernetes using a Sidecar container. I hope this was significant.
0 notes
Text
How to become a gardener
Gardeners are required to do a lot of physical labor. In addition to managing plants and other garden necessities, a gardener should be able to handle small and large machinery safely. Depending on the role, a gardener can also provide guidance and training to management, as well as perform basic maintenance tasks. Candidates must have at least two years experience to become a gardener. They should also have strong technical knowledge, be able to operate basic hand tools and light machinery, and have excellent interpersonal skills. A gardener is responsible for maintaining the health of a cluster by watering it and fertilizing it. The branches and dead plants are removed and then composted for future uses. The debris from these processes can be used to create fertilizer. A gardener tends to seventy two trees, seven hundred and twenty five acres of turf grass, as well as approximately seven thousand shrubs. This work involves using a variety of hand and power tools. A gardener must deploy kubectl to manage pods and clusters. This tool allows users to monitor the health of their clusters. The app provides a central dashboard that allows users to keep track of all aspects related to their cluster. It allows operators and teams to collaborate on issues and collaborate on projects. They can also track and manage their deployments. It also offers a host of other features, such as a centralized data dashboard, which lets users view relevant information. Gardeners can manage all types of green spaces efficiently. Common tasks include weeding and deadheading, as well as pruning. Other tasks include creating and managing a dedicated Namespace and administering infrastructure account secret information, monitoring cluster health, and monitoring it. A gardener should also be familiar with the different types of plants and how they are identified. He should also know how to use chemicals and equipment. A gardener must be familiar with kubectl in order to perform these tasks. A gardener will usually implement an inception approach to Kubernetes. By using the kubectl command line tool, a gardener can configure and manage the cluster. He must also manage the secrets of the infrastructure accounts. An experienced gardener should be able to use the kubectl command to install the kubectl application. The key to implementing a proper inception strategy is to use a separate controller for each pod. A gardener's job involves performing various tasks to maintain a garden. They often plant flowers and other plants, prune plants, and prune trees. They also monitor the cluster and their health. They may also use tools for managing infrastructure account secrets. They can use the command kubectl to create and run Kubernetes containers. These are the main benefits of Gardener. Gardeners can use kubectl for managing clusters on multiple clouds. The Gardener command line tool is essential for monitoring a cluster. The Gardener dashboard is a dashboard that allows users to monitor the health of each cluster. It's a central dashboard that allows operators and teams collaborate. It is easy to use and includes many other features. A dashboard allows administrators to keep track of the status of the entire cluster and track issues. The user can even customize the appearance of the dashboard, which allows them to customize it. To deploy Gardener, you will need the Gardener command-line tool. The kubectl tool is a centralized tool for managing Kubernetes clusters. It has a central dashboard that allows users to monitor cluster health, and collaborate on issues. It is also useful for managing account secrets and infrastructure accounts. It provides a snapshot of the current state of the cluster and detailed information for managers and operators. The Gardener can monitor the health and performance of each component of a cluster through a single interface. A Gardener installation requires the kubectl command line tool. The kubectl tool provides monitoring and management of Kubernetes clusters. It can also manage infrastructure accounts, and other secrets. The kubectl command line tool allows users to monitor and manage the clusters. Operators need a centralized dashboard to monitor the health of their clusters. It helps them manage the health of their clusters. It also provides them with relevant data.
1 note
·
View note
Text
What is Kubernetes and How Does It Work?
Kubernetes, k8s for short, is a Google-initiated open-source platform that began as a simple container orchestration tool but has evolved into a cloud-native platform. It's one of the most significant developments in IT since the public cloud debuted in 2009, with an unrivalled 30 percent growth rate in both market revenue and general adoption over the last five years.
Kubernetes is an open-source container orchestration platform that allows cloud applications to run on an elastic web server infrastructure. Kubernetes can be used to outsource data centers to public cloud service providers or for large-scale web hosting. Website and mobile applications with complicated bespoke code can also be deployed on commodity hardware using Kubernetes to save money on web server provisioning with public cloud hosts and to speed up software development. It defines how applications should function and interact with one another. It can scale services up and down as needed, run rolling upgrades, switch traffic between multiple versions of your apps to test features, and rollback problematic deployments thanks to its elasticity.
Kubernetes has established itself as a top alternative for companies trying to construct multi-cloud & cloud computing online training systems. AWS Elastic Container Service for Kubernetes, Google Kubernetes Engine, and Azure Kubernetes Service are just a few of the public clouds that have adopted Kubernetes and offer their own releases.
Kubernetes - A Container Orchestration System
As container deployment, networking, scalability, and availability became more common, operations teams needed to schedule and automate container deployment, networking, scalability, and availability. The container orchestration market was formed as a result. (Container allows a user to partition a machine so that it can execute many applications or operating system instances on the same kernel and hardware while retaining isolation between the workloads)
While alternative container orchestration systems, such as Docker Swarm and Apache Mesos, initially gained interest, Kubernetes swiftly became the most extensively used (in fact, at one point, it was the fastest-growing project in the history of open-source software). The following are the main components of Kubernetes architecture:
Clusters and Nodes (Compute)
The architecture of Kubernetes is built around clusters. Nodes, which each represent a single compute host, make up the clusters (virtual or physical machine). Each cluster is made up of a master node, which acts as the cluster's control plane, and several worker nodes, which deploy, run, and manage containerized applications. The scheduler service on the master node automates the deployment of containers depending on developer-defined deployment requirements and available cloud computing resources. Each worker node has the container management technology — such as Docker — as well as a software agent known as a Kubelet, which receives and executes orders from the master node. Developers use kubectl, a command-line interface (cli) that interfaces directly with the Kubernetes API, to manage cluster activities.
Pods and Deployments (Software)
Pods are collections of containers that share the same network and computation resources. In Kubernetes, they are also the scalability unit: if a container in a pod receives more traffic than it can manage, Kubernetes will replicate the pod to other cluster nodes. As a result, it's a good idea to keep pods small so that they only include containers that need to share resources The deployment is in charge of the containerized application's construction and state, as well as keeps it operating. It defines the number of pod replicas that should operate on the cluster. The deployment will produce a new pod if one fails.
How Does Kubernetes Work?
Kubernetes manages containers by bringing together a cluster of real or virtual host machines known as "nodes." This results in a "supercomputer" with more processing power, storage capacity, and networking capabilities than any one machine could provide on its own. The nodes contain all of the services required to run "pods," which run single or many containers. In Kubernetes, a pod represents a single instance of an application i.e. cloud computing online.
The "control plane" is one (or more for larger clusters or High Availability) of the cluster's nodes. As the orchestration layer, the control plane node takes over responsibility for the cluster, scheduling and allocating tasks to the other "worker" nodes in a way that maximizes the cluster's resources. This main node handles all operator interactions with the cluster, including configuration updates, workload execution and termination, and network ingress and egress control.
The control plane is also in charge of monitoring all aspects of the cluster, allowing it to perform additional useful functions like automatically reallocating workloads in the event of a failure, scaling up tasks that require more resources, and ensuring that the assigned workloads are always operating correctly. Kubernetes also manages service discovery, load balancing, resource allocation, and scaling based on computing utilization automatically. It also monitors the health of individual resources and allows programs to self-heal by restarting or replicating containers automatically.
0 notes
Text
Installing the Kubernetes Dashboard
Installing the Kubernetes Dashboard
Before diving into the Kubernetes dashboard, just have a glimpse over what the heck is Kubernetes. Kubernetes is an open-source system automating application deployment, scaling, and management. It was originally designed by Google and is also recognized as K8s. The developers mainly utilize this tool to manage the containers across the public, private cloud environment. With the private cloud environment, we meant that cloud deployment is where you maintain your own servers and infrastructure that mainly hosts your applications and the data as well.
Uses of Kubernetes Dashboard
The dashboard provides an overview of the pods/clusters that runs on your machine. Moreover, it tells the creation and modification of individual Kubernetes resources, eg. deployments, jobs, etc. It provides accurate information on the state of Kubernetes resources in your cluster, and on any errors that may have occurred.
Kubeadm token
Bootstrap tokens are used for establishing bidirectional trust between a node joining the cluster and a control-plane node. The token generated is valid only for 24hours. In that case, the 24 hours exceed we need to generate the new token using the command:
$ sudo kubeadm token create
The current token can be the view from the master using the below command.
$ sudo kubeadm token list
We have described the flannel that is used for the communication process and after the flannel network is deployed, we can verify the flannel interface for the IP address assigned.
$ kubectl apply -f https://raw.githubusercontent.com/kubernetes/dashboard/v1.10.1/src/deploy/recommended/kubernetes-dashboard.yaml
The above command is used to connect the dashboard. Wait for Kubernetes-dashboard-x pods to goes "Running" status.
Once the Kubernetes-dashboard-x container goes to the "Running" state, then we can initiate kubectl proxy with the below-given command. If you want to start only in localhost then you can change the address option to the localhost.
$ kubectl proxy --address=0.0.0.0
Now open the below Kubernetes dashboard URL in a browser.
http://localhost:8001/api/v1/namespaces/kube-system/services/https:kubernetes-dashboard:/proxy/.
The given link will direct you to the Kubernetes dashboard. Here, to build a connection we need a token (key). And the key will be explained to you by the below commands.
To login properly into the Kubernetes dashboard, we need to create a service account and assign the proper role.
$ kubectl create service account dashboard -n default
$ kubectl create clusterrolebinding dashboard-admin -n default --clusterrole=cluster-admin --serviceaccount=default:dashboard
Now the password to login Kubernetes dashboard can be viewed by running the below command. Copy the decoded password and log in to the dashboard.
$ kubectl get secret $(kubectl get serviceaccount dashboard -o jsonpath="{.secrets[0].name}") -o jsonpath="{.data.token}" | base64 --decode
After putting the above command we’ll attain a token key for access to the Kubernetes dashboard.
As mentioned in the below screenshot, that shows you to opt from those 2 options, i.e. Kubeconfig & Token. We prefer you to select a token, and insert the key and proceed with the sign-in process.
After the sign-in, it will show you the dashboard main page. On that page, we can see the node’s running stage, replicas, clusters, etc., and every action that we perform on a created object. It helps us to visualize every action of the master and node.
Bottom Line
In a nutshell, Kubernetes is an open-source system automating application deployment, scaling, and management. It was originally designed by Google and is also recognized as K8s. Further, we will come back with part of this Kubernetes series. Till then enjoy learning and we hope this second section prompts you through your Kubernetes journey.
0 notes
Text
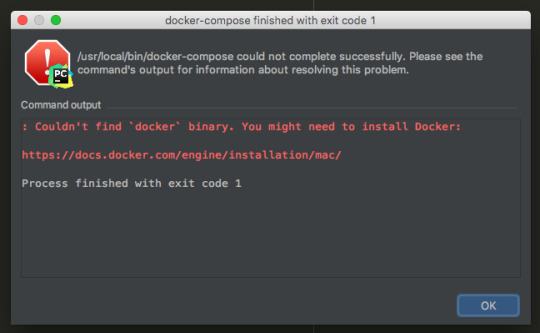
Docker Compose Install For Mac

Estimated reading time: 15 minutes
Docker Compose Install For Mac Installer
Docker Compose Install For Mac High Sierra
Docker Compose Install For Macos
Running Docker On Mac
See full list on docs.docker.com. To uninstall Docker Toolbox from Mac, first simply download the following Docker Toolbox Uninstall Shell Script to your local machine. Use the Terminal application on your Mac (i.e. Press CMD + Space to open Spotlight Search and enter keyword 'Terminal') to change into the directory it was downloaded into (i.e. Cd /Downloads ), and then. If you're a Mac or Windows user, the best way to install Compose and keep it up-to-date is Docker for Mac and Windows. Docker for Mac and Windows will automatically install the latest version of Docker Engine for you. Alternatively, you can use the usual commands to install or upgrade Compose. This view also provides an intuitive interface to perform common actions to inspect, interact with, and manage your Docker objects including containers and Docker Compose-based applications. The Images view displays a list of your Docker images, and allows you to run an image as a container, pull the latest version of an image from Docker Hub. $ docker-compose up -build Creating network 'example-voting-app-masterfront-tier' with the default driver Creating network 'example-voting-app-masterback-tier' with the default driver Creating volume 'example-voting-app-masterdb-data' with default driver Building vote Step 1/7: FROM python:2.7-alpine 2.7-alpine: Pulling from library/python Digest.
Welcome to Docker Desktop! The Docker Desktop for Mac user manual provides information on how to configure and manage your Docker Desktop settings.
For information about Docker Desktop download, system requirements, and installation instructions, see Install Docker Desktop.
Note
This page contains information about the Docker Desktop Stable release. For information about features available in Edge releases, see the Edge release notes.
Preferences
The Docker Preferences menu allows you to configure your Docker settings such as installation, updates, version channels, Docker Hub login,and more.
Choose the Docker menu > Preferences from themenu bar and configure the runtime options described below.
General
On the General tab, you can configure when to start and update Docker:
Start Docker Desktop when you log in: Automatically starts Docker Desktop when you open your session.
Automatically check for updates: By default, Docker Desktop automatically checks for updates and notifies you when an update is available. You can manually check for updates anytime by choosing Check for Updates from the main Docker menu.
Include VM in Time Machine backups: Select this option to back up the Docker Desktop virtual machine. This option is disabled by default.
Securely store Docker logins in macOS keychain: Docker Desktop stores your Docker login credentials in macOS keychain by default.
Send usage statistics: Docker Desktop sends diagnostics, crash reports, and usage data. This information helps Docker improve and troubleshoot the application. Clear the check box to opt out.
Click Switch to the Edge version to learn more about Docker Desktop Edge releases.
Resources
The Resources tab allows you to configure CPU, memory, disk, proxies, network, and other resources.
Advanced
On the Advanced tab, you can limit resources available to Docker.
Advanced settings are:
CPUs: By default, Docker Desktop is set to use half the number of processorsavailable on the host machine. To increase processing power, set this to ahigher number; to decrease, lower the number.
Memory: By default, Docker Desktop is set to use 2 GB runtime memory,allocated from the total available memory on your Mac. To increase the RAM, set this to a higher number. To decrease it, lower the number.
Swap: Configure swap file size as needed. The default is 1 GB.
Disk image size: Specify the size of the disk image.
Disk image location: Specify the location of the Linux volume where containers and images are stored.
You can also move the disk image to a different location. If you attempt to move a disk image to a location that already has one, you get a prompt asking if you want to use the existing image or replace it.
File sharing
Use File sharing to allow local directories on the Mac to be shared with Linux containers.This is especially useful forediting source code in an IDE on the host while running and testing the code in a container.By default the /Users, /Volume, /private, /tmp and /var/folders directory are shared. If your project is outside this directory then it must be addedto the list. Otherwise you may get Mounts denied or cannot start service errors at runtime.
File share settings are:
Docker Compose Install For Mac Installer
Add a Directory: Click + and navigate to the directory you want to add.
Apply & Restart makes the directory available to containers using Docker’sbind mount (-v) feature.
There are some limitations on the directories that can be shared:
The directory must not exist inside of Docker.
For more information, see:
Namespaces in the topic onosxfs file system sharing.
Volume mounting requires file sharing for any project directories outside of /Users.)
Proxies
Docker Desktop detects HTTP/HTTPS Proxy Settings from macOS and automaticallypropagates these to Docker. For example, if you set yourproxy settings to http://proxy.example.com, Docker uses this proxy whenpulling containers.
Your proxy settings, however, will not be propagated into the containers you start.If you wish to set the proxy settings for your containers, you need to defineenvironment variables for them, just like you would do on Linux, for example:
For more information on setting environment variables for running containers,see Set environment variables.
Network
You can configure Docker Desktop networking to work on a virtual private network (VPN). Specify a network address translation (NAT) prefix and subnet mask to enable Internet connectivity.
Docker Engine
The Docker Engine page allows you to configure the Docker daemon to determine how your containers run.
Type a JSON configuration file in the box to configure the daemon settings. For a full list of options, see the Docker Enginedockerd commandline reference.
Click Apply & Restart to save your settings and restart Docker Desktop.
Command Line
Docker Compose Install For Mac High Sierra
On the Command Line page, you can specify whether or not to enable experimental features.
Experimental features provide early access to future product functionality.These features are intended for testing and feedback only as they may changebetween releases without warning or can be removed entirely from a futurerelease. Experimental features must not be used in production environments.Docker does not offer support for experimental features.
To enable experimental features in the Docker CLI, edit the config.jsonfile and set experimental to enabled.
To enable experimental features from the Docker Desktop menu, clickSettings (Preferences on macOS) > Command Line and then turn onthe Enable experimental features toggle. Click Apply & Restart.
For a list of current experimental features in the Docker CLI, see Docker CLI Experimental features.
On both Docker Desktop Edge and Stable releases, you can toggle the experimental features on and off. If you toggle the experimental features off, Docker Desktop uses the current generally available release of Docker Engine.
You can see whether you are running experimental mode at the command line. IfExperimental is true, then Docker is running in experimental mode, as shownhere. (If false, Experimental mode is off.)
Kubernetes
Docker Desktop includes a standalone Kubernetes server that runs on your Mac, sothat you can test deploying your Docker workloads on Kubernetes.
The Kubernetes client command, kubectl, is included and configured to connectto the local Kubernetes server. If you have kubectl already installed andpointing to some other environment, such as minikube or a GKE cluster, be sureto change context so that kubectl is pointing to docker-desktop:
If you installed kubectl with Homebrew, or by some other method, andexperience conflicts, remove /usr/local/bin/kubectl.
To enable Kubernetes support and install a standalone instance of Kubernetesrunning as a Docker container, select Enable Kubernetes. To set Kubernetes as thedefault orchestrator, select Deploy Docker Stacks to Kubernetes by default.
Click Apply & Restart to save the settings. This instantiates images required to run the Kubernetes server as containers, and installs the/usr/local/bin/kubectl command on your Mac.
When Kubernetes is enabled and running, an additional status bar item displaysat the bottom right of the Docker Desktop Settings dialog.
The status of Kubernetes shows in the Docker menu and the context points todocker-desktop.
By default, Kubernetes containers are hidden from commands like dockerservice ls Video media player for mac. , because managing them manually is not supported. To make themvisible, select Show system containers (advanced) and click Apply andRestart. Most users do not need this option.
To disable Kubernetes support at any time, clear the Enable Kubernetes check box. TheKubernetes containers are stopped and removed, and the/usr/local/bin/kubectl command is removed.
For more about using the Kubernetes integration with Docker Desktop, seeDeploy on Kubernetes.
Reset
Reset and Restart options
On Docker Desktop Mac, the Restart Docker Desktop, Reset to factory defaults, and other reset options are available from the Troubleshoot menu.
For information about the reset options, see Logs and Troubleshooting.
Dashboard
The Docker Desktop Dashboard enables you to interact with containers and applications and manage the lifecycle of your applications directly from your machine. The Dashboard UI shows all running, stopped, and started containers with their state. It provides an intuitive interface to perform common actions to inspect and manage containers and existing Docker Compose applications. For more information, see Docker Desktop Dashboard.
Add TLS certificates
You can add trusted Certificate Authorities (CAs) (used to verify registryserver certificates) and client certificates (used to authenticate toregistries) to your Docker daemon.
Add custom CA certificates (server side)
All trusted CAs (root or intermediate) are supported. Docker Desktop creates acertificate bundle of all user-trusted CAs based on the Mac Keychain, andappends it to Moby trusted certificates. So if an enterprise SSL certificate istrusted by the user on the host, it is trusted by Docker Desktop.
To manually add a custom, self-signed certificate, start by adding thecertificate to the macOS keychain, which is picked up by Docker Desktop. Here isan example:
Or, if you prefer to add the certificate to your own local keychain only (ratherthan for all users), run this command instead:
See also, Directory structures forcertificates.
Note: You need to restart Docker Desktop after making any changes to thekeychain or to the ~/.docker/certs.d directory in order for the changes totake effect.
For a complete explanation of how to do this, see the blog post AddingSelf-signed Registry Certs to Docker & Docker Desktop forMac.
Add client certificates
You can put your client certificates in~/.docker/certs.d/<MyRegistry>:<Port>/client.cert and~/.docker/certs.d/<MyRegistry>:<Port>/client.key.
When the Docker Desktop application starts, it copies the ~/.docker/certs.dfolder on your Mac to the /etc/docker/certs.d directory on Moby (the DockerDesktop xhyve virtual machine).
You need to restart Docker Desktop after making any changes to the keychainor to the ~/.docker/certs.d directory in order for the changes to takeeffect.
The registry cannot be listed as an insecure registry (see DockerEngine. Docker Desktop ignores certificates listedunder insecure registries, and does not send client certificates. Commandslike docker run that attempt to pull from the registry produce errormessages on the command line, as well as on the registry.
Directory structures for certificates
If you have this directory structure, you do not need to manually add the CAcertificate to your Mac OS system login:
The following further illustrates and explains a configuration with customcertificates:
You can also have this directory structure, as long as the CA certificate isalso in your keychain.
To learn more about how to install a CA root certificate for the registry andhow to set the client TLS certificate for verification, seeVerify repository client with certificatesin the Docker Engine topics.
Install shell completion
Docker Desktop comes with scripts to enable completion for the docker and docker-compose commands. The completion scripts may befound inside Docker.app, in the Contents/Resources/etc/ directory and can beinstalled both in Bash and Zsh.
Bash
Bash has built-in support forcompletion To activate completion for Docker commands, these files need to becopied or symlinked to your bash_completion.d/ directory. For example, if youinstalled bash via Homebrew:
Elgato video capture software mac os x. Add the following to your ~/.bash_profile:
OR
Zsh
In Zsh, the completionsystem takes care of things. To activate completion for Docker commands,these files need to be copied or symlinked to your Zsh site-functions/directory. For example, if you installed Zsh via Homebrew:
Fish-Shell
Fish-shell also supports tab completion completionsystem. To activate completion for Docker commands,these files need to be copied or symlinked to your Fish-shell completions/directory.
Create the completions directory:
Now add fish completions from docker.
Give feedback and get help
To get help from the community, review current user topics, join or start adiscussion, log on to our Docker Desktop for Macforum.
To report bugs or problems, log on to Docker Desktop for Mac issues onGitHub,where you can review community reported issues, and file new ones. SeeLogs and Troubleshooting for more details.
For information about providing feedback on the documentation or update it yourself, see Contribute to documentation.
Docker Hub
Select Sign in /Create Docker ID from the Docker Desktop menu to access your Docker Hub account. Once logged in, you can access your Docker Hub repositories and organizations directly from the Docker Desktop menu.
For more information, refer to the following Docker Hub topics:
Two-factor authentication
Docker Compose Install For Macos
Docker Desktop enables you to sign into Docker Hub using two-factor authentication. Two-factor authentication provides an extra layer of security when accessing your Docker Hub account.
You must enable two-factor authentication in Docker Hub before signing into your Docker Hub account through Docker Desktop. For instructions, see Enable two-factor authentication for Docker Hub.
Running Docker On Mac
After you have enabled two-factor authentication:
Go to the Docker Desktop menu and then select Sign in / Create Docker ID.
Enter your Docker ID and password and click Sign in.
After you have successfully signed in, Docker Desktop prompts you to enter the authentication code. Enter the six-digit code from your phone and then click Verify.
After you have successfully authenticated, you can access your organizations and repositories directly from the Docker Desktop menu.
Where to go next
Try out the walkthrough at Get Started.
Dig in deeper with Docker Labs examplewalkthroughs and source code.
For a summary of Docker command line interface (CLI) commands, seeDocker CLI Reference Guide.
Check out the blog post, What’s New in Docker 17.06 Community Edition(CE).
mac, tutorial, run, docker, local, machine
0 notes
Text
A Practical Guide to CKA/CKAD Preparation in 2025
The Certified Kubernetes Administrator (CKA) and Certified Kubernetes Application Developer (CKAD) certifications are highly sought-after credentials in the cloud-native ecosystem. These certifications validate your skills and knowledge in managing and developing applications on Kubernetes. This guide provides a practical roadmap for preparing for these exams in 2025.
1. Understand the Exam Objectives
CKA: Focuses on the skills required to administer a Kubernetes cluster. Key areas include cluster architecture, installation, configuration, networking, storage, security, and troubleshooting.
CKAD: Focuses on the skills required to design, build, and deploy cloud-native applications on Kubernetes. Key areas include application design, deployment, configuration, monitoring, and troubleshooting.
Refer to the official CNCF (Cloud Native Computing Foundation) websites for the latest exam curriculum and updates.
2. Build a Strong Foundation
Linux Fundamentals: A solid understanding of Linux command-line tools and concepts is essential for both exams.
Containerization Concepts: Learn about containerization technologies like Docker, including images, containers, and registries.
Kubernetes Fundamentals: Understand core Kubernetes concepts like pods, deployments, services, namespaces, and controllers.
3. Hands-on Practice is Key
Set up a Kubernetes Cluster: Use Minikube, Kind, or a cloud-based Kubernetes service to create a local or remote cluster for practice.
Practice with kubectl: Master the kubectl command-line tool, which is essential for interacting with Kubernetes clusters.
Solve Practice Exercises: Use online resources, practice exams, and mock tests to reinforce your learning and identify areas for improvement.
4. Utilize Effective Learning Resources
Official CNCF Documentation: The official Kubernetes documentation is a comprehensive resource for learning about Kubernetes concepts and features.
Online Courses: Platforms like Udemy, Coursera, and edX offer CKA/CKAD preparation courses with video lectures, hands-on labs, and practice exams.
Books and Study Guides: Several books and study guides are available to help you prepare for the exams.
Community Resources: Engage with the Kubernetes community through forums, Slack channels, and meetups to learn from others and get your questions answered.
5. Exam-Specific Tips
CKA:
Focus on cluster administration tasks like installation, upgrades, and troubleshooting.
Practice managing cluster resources, security, and networking.
Be comfortable with etcd and control plane components.
CKAD:
Focus on application development and deployment tasks.
Practice writing YAML manifests for Kubernetes resources.
Understand application lifecycle management and troubleshooting.
6. Time Management and Exam Strategy
Allocate Sufficient Time: Dedicate enough time for preparation, considering your current knowledge and experience.
Create a Study Plan: Develop a structured study plan with clear goals and timelines.
Practice Time Management: During practice exams, simulate the exam environment and practice managing your time effectively.
Familiarize Yourself with the Exam Environment: The CKA/CKAD exams are online, proctored exams with a command-line interface. Familiarize yourself with the exam environment and tools beforehand.
7. Stay Updated
Kubernetes is constantly evolving. Stay updated with the latest releases, features, and best practices.
Follow the CNCF and Kubernetes community for announcements and updates.
For more information www.hawkstack.com
0 notes
Text
Taking your PowerShell prompt to the next level with Windows Terminal and Oh my Posh 3
I love my pretty prompt that I use with Windows Terminal and Powershell. I also like using PSReadline to bring even more cool features to the CLI (Command Line Interface).
One of the best and easiest ways to get an awesome looking prompt on Windows is with Oh My Posh, and there's now Oh My Posh 3! Now, to be clear, you get to be pretty extra with these prompts and some people find them to be a turn off if there's too much bling. Remember: It's your prompt and you are in control. It's totally configurable - so configure it!
What do you need to start?
Windows Terminal
A super charged Cascadia Code font.
I like CaskaydiaCove NF but any overkill nerd font will do. You can use Cascadia Code PL but you may want other glyphs.
PowerShell (works on Windows, Linux, and Mac and is open source) and Oh my Posh
Now, to be clear, you can use Oh My Posh on zsh, bash, fish, nu and other shells also, but I like PowerShell as my main shell.
Let's upgrade my Oh My Posh installation to Oh My Posh 3 and see what's new and changed, shall we?
Here's my current prompt:

There's an upgrading section in the docs, if you are going from an existing installation of Oh My Posh to v3. Let's check it out.
Looks like I just need to do this:
Update-Module -Name oh-my-posh -AllowPrerelease -Scope CurrentUser
That's...suspiciously...not difficult. Now, just add this text to your $profile (again, there are instructions for other prompts).
NOTE: Be sure to make sure that your paths are correct. The example assumes a c:\tools folder AND it assumes you have a ~\.poshthemes folder. Change those paths however you want, but if it doesn't work, it's likely a pathing issue.
Here's a clever feature, you can call "Get-PoshThemes" and see a PREVIEW of different prompt themes and pick one!
Hey that "jandedobbeleer" font is as extra as I am. I like it.
Set-PoshPrompt -Theme jandedobbeleer
The fun stuff is where you can add things like your current Azure subscruption, or your current kubectl, or even YouTube music. I like the dotnet option. Let me see how to change that.
There is an OhMyPosh executable you can get that will print your current config that you can then modify. Download the right version of that and put it in your PATH somewhere. I put mine in my sync'ed d:\dropbox\utils which makes it available on any machine, but that's just me.
NOTE: If it's a new release of OhMyPosh, it may not have built up reputation without a code signing cert, but ignore that for now. I submitted it as safe in smartscreen and you can too if you like.
I will get the current config and put it in the clipboard, then paste it into VS Code and modify it.
posh-windows-amd64.exe -print-config
Unicode! Note that you may not be able to | pipe this to clip.exe or > to a file as there's fancy Unicode in there and your shell may mangle the glyphs. I ended up copying the JSON manually directly by selecting it in Windows Terminal.
If you want to copy in your own fancy glyph, use charmap.exe to copy the one you want. There's lots of choices in nerdfonts.
Pretty fancy! I've got the path, my git, and the current .NET Core SDK version in that path, as well as a heartbeat of the current CLI error code.
I've uploaded my ohmyposhv3.json as a Gist on GitHub. Next I think I'll look into how to make my own custom segment and make a Nightscout Blood Sugar segment and show my blood sugar in real time as I used to.
Sponsor: Have you tried developing in Rider yet? This fast and feature-rich cross-platform IDE improves your code for .NET, ASP.NET, .NET Core, Xamarin, and Unity applications on Windows, Mac, and Linux.
© 2020 Scott Hanselman. All rights reserved.


Taking your PowerShell prompt to the next level with Windows Terminal and Oh my Posh 3 published first on https://deskbysnafu.tumblr.com/
0 notes
Text
Taking your PowerShell prompt to the next level with Windows Terminal and Oh my Posh 3
I love my pretty prompt that I use with Windows Terminal and Powershell. I also like using PSReadline to bring even more cool features to the CLI (Command Line Interface).
One of the best and easiest ways to get an awesome looking prompt on Windows is with Oh My Posh, and there's now Oh My Posh 3! Now, to be clear, you get to be pretty extra with these prompts and some people find them to be a turn off if there's too much bling. Remember: It's your prompt and you are in control. It's totally configurable - so configure it!
What do you need to start?
Windows Terminal
A super charged Cascadia Code font.
I like CaskaydiaCove NF but any overkill nerd font will do. You can use Cascadia Code PL but you may want other glyphs.
PowerShell (works on Windows, Linux, and Mac and is open source) and Oh my Posh
Now, to be clear, you can use Oh My Posh on zsh, bash, fish, nu and other shells also, but I like PowerShell as my main shell.
Let's upgrade my Oh My Posh installation to Oh My Posh 3 and see what's new and changed, shall we?
Here's my current prompt:
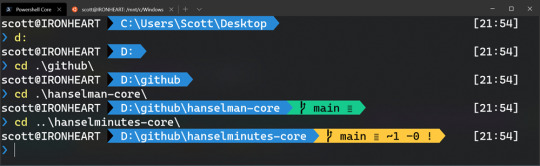
There's an upgrading section in the docs, if you are going from an existing installation of Oh My Posh to v3. Let's check it out.
Looks like I just need to do this:
Update-Module -Name oh-my-posh -AllowPrerelease -Scope CurrentUser
That's...suspiciously...not difficult. Now, just add this text to your $profile (again, there are instructions for other prompts).
NOTE: Be sure to make sure that your paths are correct. The example assumes a c:\tools folder AND it assumes you have a ~\.poshthemes folder. Change those paths however you want, but if it doesn't work, it's likely a pathing issue.
Here's a clever feature, you can call "Get-PoshThemes" and see a PREVIEW of different prompt themes and pick one!
Hey that "jandedobbeleer" font is as extra as I am. I like it.
Set-PoshPrompt -Theme jandedobbeleer
The fun stuff is where you can add things like your current Azure subscruption, or your current kubectl, or even YouTube music. I like the dotnet option. Let me see how to change that.
There is an OhMyPosh executable you can get that will print your current config that you can then modify. Download the right version of that and put it in your PATH somewhere. I put mine in my sync'ed d:\dropbox\utils which makes it available on any machine, but that's just me.
NOTE: If it's a new release of OhMyPosh, it may not have built up reputation without a code signing cert, but ignore that for now. I submitted it as safe in smartscreen and you can too if you like.
I will get the current config and put it in the clipboard, then paste it into VS Code and modify it.
posh-windows-amd64.exe -print-config
Unicode! Note that you may not be able to | pipe this to clip.exe or > to a file as there's fancy Unicode in there and your shell may mangle the glyphs. I ended up copying the JSON manually directly by selecting it in Windows Terminal.
If you want to copy in your own fancy glyph, use charmap.exe to copy the one you want. There's lots of choices in nerdfonts.
Pretty fancy! I've got the path, my git, and the current .NET Core SDK version in that path, as well as a heartbeat of the current CLI error code.
I've uploaded my ohmyposhv3.json as a Gist on GitHub. Next I think I'll look into how to make my own custom segment and make a Nightscout Blood Sugar segment and show my blood sugar in real time as I used to.
Sponsor: Have you tried developing in Rider yet? This fast and feature-rich cross-platform IDE improves your code for .NET, ASP.NET, .NET Core, Xamarin, and Unity applications on Windows, Mac, and Linux.
© 2020 Scott Hanselman. All rights reserved.


Taking your PowerShell prompt to the next level with Windows Terminal and Oh my Posh 3 published first on http://7elementswd.tumblr.com/
0 notes
Text
Wondering How to Run Percona XtraDB Cluster on Kubernetes? Try Our Operator!
Kubernetes has been a big trend for a while now, particularly well-suited for microservices. Running your main databases on Kubernetes is probably NOT what you are looking for. However, there’s a niche market for them. My colleague Stephen Thorn did a great job explaining this in The Criticality of a Kubernetes Operator for Databases. If you are considering running your database on Kubernetes, have a look at it first. And, if after reading it you start wondering how the Operator works, Stephen also wrote an Introduction to Percona Kubernetes Operator for Percona XtraDB Cluster (PXC), which presents the Kubernetes architecture and how the Percona Operator simplifies the deployment of a full HA PXC cluster in this environment, proxies included! Now, if you are curious about how it actually works in practice but are afraid the entry barrier is too high, I can help you with that. In fact, this technology is widespread now, with most cloud providers offering a dedicated Kubernetes engine. In this blog post, I’ll walk you over the steps on how to deploy a Percona XtraDB Cluster (PXC) using the Percona Operator for Kubernetes on Google Cloud Platform (GCP). Creating a Virtual Environment to Run Kubernetes on GCP Google Cloud Platform includes among its products the Google Kubernetes Engine (GKE). We can take advantage of their trial offer to create our test cluster there: https://cloud.google.com. After you sign up, you can access all the bells and whistles in their web interface. Note the Kubernetes Engine API is not enabled by default, you need to do it by visiting the Kubernetes Engine section in the left menu, under COMPUTE. For the purpose of deploying our environment, we should install their SDK and work from the command line: see https://cloud.google.com/sdk/docs/install and follow the respective installation instructions for your OS (you will probably want to install the SDK on your personal computer). With the SDK installed, we can initialize our environment, which requires authenticating to the Google Cloud account: gcloud init You will be prompted to choose a cloud project to use: there’s one created by default when the account is activated, named “My First Project”. It will receive a unique id, which you can verify in the Google Cloud interface, but usually, it is displayed as the first option presented in the prompt. Alternatively, you can use gcloud config set to configure your default project and zone, among other settings. For this exercise, we will be creating a 3-node cluster named k8-test-cluster with n1-standard-4 instances in the us-central1-b zone: gcloud container clusters create --machine-type n1-standard-4 --num-nodes 3 --zone us-central1-b --cluster-version latest k8-test-cluster If the command above was successful, you should see your newly created cluster in the list returned by: gcloud container clusters list Getting Ready to Work with Kubernetes Besides the Google Cloud SDK that is used to manage the cloud instances, we also need the Kubernetes command-line tool, kubectl, to manage the Kubernetes cluster. One way to install it is through gcloud itself: gcloud components install kubectl This method won’t work for everyone though, as the Cloud SDK component manager is disabled for certain kinds of installation, such as through apt or yum in Linux. I find myself in this group, using Ubuntu, but the failed attempt to install kubectl through gcloud suggested another approach that worked for me: sudo apt install kubectl Deploying a PXC Cluster Using the Percona Kubernetes Operator The Percona operators are available on Github. The most straightforward way to obtain a copy is by cloning the operator’s repository. The latest version of the PXC operator is 1.6.0 and we can clone it with the following command: git clone -b v1.6.0 https://github.com/percona/percona-xtradb-cluster-operator Move inside the created directory: cd percona-xtradb-cluster-operator and run the following sequence of commands: Define the Custom Resource Definitions for PXC:kubectl apply -f deploy/crd.yaml Create a namespace on Kubernetes and associate it to your current context:kubectl create namespace pxc kubectl config set-context $(kubectl config current-context) --namespace=pxc Define Role-Based Access Control (RBAC) for PXC:kubectl apply -f deploy/rbac.yaml Start the operator within Kubernetes:kubectl apply -f deploy/operator.yaml Configure PXC users and their credentials:kubectl apply -f deploy/secrets.yaml Finally, deploy the cluster:kubectl apply -f deploy/cr.yaml You can find a more detailed explanation of each of these steps, as well as how to customize your installation, in the Percona Kubernetes Operator for Percona XtraDB Cluster online documentation, which includes a quickstart guide for GKE. Now, it is a matter of waiting for the deployment to complete, which you can monitor with: kubectl get pods A successful deployment will show output for the above command similar to: NAME READY STATUS RESTARTS AGE cluster1-haproxy-0 2/2 Running 0 4m21s cluster1-haproxy-1 2/2 Running 0 2m47s cluster1-haproxy-2 2/2 Running 0 2m21s cluster1-pxc-0 1/1 Running 0 4m22s cluster1-pxc-1 1/1 Running 0 2m52s cluster1-pxc-2 1/1 Running 0 111s percona-xtradb-cluster-operator-79d786dcfb-9lthw 1/1 Running 0 4m37s As you can see above, the operator will deploy seven pods with the default settings, and those are distributed across the three GKE n1-standard-4 machines we created at first: kubectl get nodes NAME STATUS ROLES AGE VERSION gke-k8-test-cluster-default-pool-02c370e1-gvfg Ready 152m v1.17.13-gke.1400 gke-k8-test-cluster-default-pool-02c370e1-lvh7 Ready 152m v1.17.13-gke.1400 gke-k8-test-cluster-default-pool-02c370e1-qn3p Ready 152m v1.17.13-gke.1400 Accessing the Cluster One way to access the cluster is by creating an interactive shell in the Kubernetes cluster: kubectl run -i --rm --tty percona-client --image=percona:8.0 --restart=Never -- bash -il From there, we can access MySQL through the cluster’s HAproxy writer node: mysql -h cluster1-haproxy -uroot -proot_password Note the hostname used above is an alias, the connection being routed to one of the HAproxy servers available in the cluster. It is also possible to connect to a specific node by modifying the host option -h with the node’s name: mysql -h cluster1-pxc-0 -uroot -proot_password This is where all the fun and experimentation starts: you can test and break things without worrying too much as you can easily and quickly start again from scratch. Destroying the Cluster and Deleting the Test Environment Once you are done playing with your Kubernetes cluster, you can destroy it with: gcloud container clusters delete --zone=us-central1-b k8-test-cluster It’s important to note the command above will not discard the persistent disk volumes that were created and used by the nodes, which you can check with the command: gcloud compute disks list A final purging command is required to remove those as well: gcloud compute disks delete --zone=us-central1-b If you are feeling overzealous, you can double-check that all has been deleted: gcloud container clusters list gcloud compute disks list Learn More About Percona Kubernetes Operator for Percona XtraDB Cluster Interested In Hands-On Learning? Be sure to get in touch with Percona’s Training Department to schedule your PXC Kubernetes training engagement. Our expert trainers will guide your team firstly through the basics, cover all the configuration noted above (and then some), and then dive deeper into how the operator functions along with High-Availability exercises, disaster recovery scenarios, backups, restore, and much more. https://www.percona.com/blog/2020/11/17/wondering-how-to-run-percona-xtradb-cluster-on-kubernetes-try-our-operator/
0 notes