#kubectl commands
Explore tagged Tumblr posts
Visit Tumblr Blog
Explore Tumblr blogs with no restrictions, modern design and the best experience.
Last Seen Tumblr Blogs


Fun Fact
Mobile US users spent an average of 115.8 minutes on Tumblr app monthly.
Text
How to Install Kubectl on Windows 11
Kubernetes is an open-source system for automating containerized application deployment, scaling, and management. You can run commands against Kubernetes clusters using the kubectl command-line tool. kubectl can be used to deploy applications, inspect and manage cluster resources, and inspect logs. You can install Kubectl on various Linux platforms, macOS, and Windows. The choice of your…
View On WordPress
#Command Line Tool#Install Kubectl#K8#Kubectl#Kubernetes#Kubernetes Command Line Tool#Windows#Windows 11
1 note
·
View note
Text
Kubectl get context: List Kubernetes cluster connections
Kubectl get context: List Kubernetes cluster connections @vexpert #homelab #vmwarecommunities #KubernetesCommandLineGuide #UnderstandingKubectl #ManagingKubernetesResources #KubectlContextManagement #WorkingWithMultipleKubernetesClusters #k8sforbeginners
kubectl, a command line tool, facilitates direct interaction with the Kubernetes API server. Its versatility spans various operations, from procuring cluster data with kubectl get context to manipulating resources using an assortment of kubectl commands. Table of contentsComprehending Fundamental Kubectl CommandsWorking with More Than One Kubernetes ClusterNavigating Contexts with kubectl…
View On WordPress
#Advanced kubectl commands#Kubectl config settings#Kubectl context management#Kubectl for beginners#Kubernetes command line guide#Managing Kubernetes resources#Setting up kubeconfig files#Switching Kubernetes contexts#Understanding kubectl#Working with multiple Kubernetes clusters
0 notes
Text
Top 10 Ways Generative AI in IT Workspace Is Redefining DevOps, Infrastructure Management, and IT Operations
Generative AI is no longer just a buzzword in enterprise IT — it’s a force multiplier. As businesses strive for faster delivery, resilient infrastructure, and autonomous IT operations, generative AI is becoming the secret weapon behind the scenes. From automating code to predicting outages before they happen, generative AI is transforming how DevOps teams, system admins, and IT managers operate daily.

In this blog, we’ll explore the top 10 real-world ways generative AI is redefining the IT workspace—specifically in the areas of DevOps, infrastructure management, and IT operations.
1. AI-Generated Infrastructure as Code (IaC)
Generative AI can automatically create, test, and optimize infrastructure-as-code templates based on user input or workload requirements.
Instead of manually writing Terraform or CloudFormation scripts, engineers can describe their desired setup in plain English.
AI tools like GitHub Copilot or bespoke enterprise copilots generate IaC snippets on demand, reducing human error and speeding up cloud provisioning.
Impact: Saves hours of setup time, increases reproducibility, and enforces security-compliant defaults.
2. Predictive Incident Management and Self-Healing Systems
Generative AI models trained on historical incident logs can predict recurring issues and suggest preventive measures in real-time.
Integrated into observability platforms, AI can flag anomalies before they impact end users.
When tied into automation workflows (e.g., via ServiceNow or PagerDuty), it can trigger remediation scripts, effectively enabling self-healing infrastructure.
Impact: Reduces MTTR (Mean Time to Resolve), enhances uptime, and frees up SRE teams from firefighting.
3. Automated Code Review and Deployment Optimization
Generative AI assists in reviewing code commits with suggestions for performance, security, and best practices.
AI bots can flag problematic code patterns, auto-suggest fixes, and even optimize CI/CD pipelines.
In DevOps, AI tools can recommend the best deployment strategy (blue-green, canary, etc.) based on application type and past deployment metrics.
Impact: Speeds up release cycles while reducing bugs and deployment risks.
4. Natural Language Interfaces for DevOps Tools
Generative AI turns complex CLI and scripting tasks into simple prompts.
Instead of memorizing kubectl commands or writing bash scripts, developers can just ask: “Scale my pod to 5 instances and restart the deployment.”
AI interprets the intent and executes the backend commands accordingly.
Impact: Democratizes access to DevOps tools for non-experts and accelerates operations.
5. Dynamic Knowledge Management and Documentation
Keeping IT documentation up to date is painful — generative AI changes that.
It auto-generates technical documentation based on system changes, deployment logs, and config files.
Integrated with enterprise wikis or GitHub repositories, AI ensures every process is captured in real time.
Impact: Saves time, ensures compliance, and keeps institutional knowledge fresh.
6. Smart Capacity Planning and Resource Optimization
AI-powered models predict workload trends and auto-scale infrastructure accordingly.
Generative AI can simulate future demand scenarios, suggesting cost-saving measures like right-sizing or moving workloads to spot instances.
In Kubernetes environments, AI can recommend pod-level resource adjustments.
Impact: Cuts infrastructure costs and ensures optimal performance during traffic spikes.
7. Personalized IT Assistant for Developers and Admins
Think of this as a ChatGPT specifically trained on your IT stack.
Developers can ask, “Why did the build fail yesterday at 3 PM?” or “How do I restart the staging DB?”
The AI assistant fetches logs, searches through config files, and provides contextual answers.
Impact: Reduces dependency on IT support, accelerates troubleshooting, and enhances developer autonomy.
8. AI-Augmented Threat Detection and Security Auditing
Generative AI scans code, configs, and network activity to detect vulnerabilities.
It can generate risk reports, simulate attack vectors, and recommend patching sequences.
Integrated into DevSecOps workflows, it ensures security is not bolted on, but baked in.
Impact: Proactively secures the IT environment without slowing down innovation.
9. Cross-Platform Automation of Repetitive IT Tasks
Routine tasks like server patching, log rotation, or service restarts can be automated through generative scripts.
AI can orchestrate cross-platform operations involving AWS, Azure, GCP, and on-prem servers from a single interface.
It also ensures proper logging and alerting are in place for all automated actions.
Impact: Enhances operational efficiency and reduces human toil.
10. Continuous Learning from Logs and Feedback Loops
Generative AI models improve over time by learning from logs, performance metrics, and operator feedback.
Each remediation or change adds to the AI’s knowledge base, making it smarter with every iteration.
This creates a virtuous cycle of continuous improvement across the IT workspace.
Impact: Builds an adaptive IT environment that evolves with business needs.
Final Thoughts: The AI-Augmented Future of IT Is Here
Generative AI isn’t replacing IT teams — it’s amplifying their capabilities. Whether you're a DevOps engineer deploying daily, an SRE managing thousands of endpoints, or an IT manager overseeing compliance and uptime, generative AI offers tools to automate, accelerate, and augment your workflows.
As we move toward hyper-automation, the organizations that succeed will be those that integrate Generative AI in the IT workspace strategically and securely.
0 notes
Text
Keep Ubuntu Pod Running in Kubernetes | sleep infinity
In this video you'll learn:
✔️ Why Pods exit immediately without a running process ✔️ How to fix CrashLoopBackOff errors in Kubernetes ✔️ Keeping Pods alive using sleep infinity ✔️ Hands-on YAML example to create an Ubuntu Pod ✔️ How to exec into a running Pod and practice Linux commands ✔️ Bonus: Instant kubectl one-liner to launch a Pod without YAML ✔️ Explore Alpine, CentOS, and other Linux images easily
youtube
0 notes
Text
Apigee APIM Operator for API Administration On Any Gateway

We now provide the Apigee APIM Operator, a lightweight Application Programming Interface Management and API Gateway tool for GKE environments. This release is a critical step towards making Apigee API management available on every gateway, anywhere.
The Kubernetes-based Apigee APIM Operator allows you build and manage API offerings. Cloud-native developers benefit from its command-line interface for Kubernetes tools like kubectl. APIM resources help the operator sync your Google Kubernetes Engine cluster with Apigee.
Advantages
For your business, the APIM Operator offers:
With the APIM Operator, API producers may manage and protect their APIs using Kubernetes resource definitions. Same tools and methods for managing other Kubernetes resources can be used for APIs.
Load balancer-level API regulation streamlines networking configuration and API security and access for the operator.
Kubernetes' role-based access control (RBAC) and Apigee custom resource definitions enable fine-grained access control for platform administrators, infrastructure administrators, and API developers.
Integration with Kubernetes: The operator integrates Helm charts and Custom Resource Definitions to make cloud-native development easy.
Reduced Context Switching: The APIM Operator lets developers administer APIs from Kubernetes, eliminating the need to switch tools.
Use APIM Operator when
API producers who want Kubernetes API management should utilise APIM Operator. It's especially useful for cloud-native Kubernetes developers who want to manage their APIs using the same tools and methods. Our APIM Operator lets Apigee clients add Cloud Native Computing Foundation (CNCF)-based API management features.
limitations
The APIM Operator's Public Preview has certain restrictions:
Support is limited to REST APIs. Public Preview doesn't support GraphQL or gRPC.
The Public Preview edition supports 25 regional or global GKE Gateway resources and API management policies.
A single environment can have 25 APIM extension policies. Add extra APIM extension policies by creating a new environment.
Gateway resources can have API management policies, but not HTTPRoutes.
Public Preview does not support region extension. A setup APIM Operator cannot be moved to different regions.
Meaning for you?
With Kubernetes-like YAML, you can configure API management for many cloud-native enterprises that use CNCF-standardized tooling without switching tools.
APIM integration with Kubernetes and CNCF toolchains reduces conceptual and operational complexity for platform managers and service developers on Google Cloud.
Policy Management: RBAC administrators can create APIM template rules to let groups use different policies based on their needs. Add Apigee rules to APIM templates to give users and administrators similar capabilities as Apigee Hybrid.
Key Features and Capabilities
The GA version lets users set up a GKE cluster and GKE Gateway to use an Apigee Hybrid instance for API management via a traffic extension (ext-proc callout). It supports factory-built Day-Zero settings with workload modification and maintains API lifespan with Kubernetes/CNCF toolchain YAML rules.
Meeting Customer Needs
This functionality addresses the growing requirement for developer-friendly API management solutions. Apigee was considered less agile owing to its complexity and the necessity to shift from Kubectl to other tools. In response to this feedback, Google Cloud created the APIM Operator, which simplifies and improves API management.
Looking Ahead
It is exploring gRPC and GraphQL support to support more API types, building on current GA version's robust foundation. As features and support are added, it will notify the community. Google Cloud is also considering changing Gateway resource and policy attachment limits.
The APIM Operator will improve developer experience and simplify API management for clients, they believe. It looks forward to seeing how creatively you use this functionality in your apps.
#APIMOperator#ApigeeAPIMOperator#APIGateway#APIAdministration#APIManagement#Apigee#CustomResourceDefinitions#technology#technews#news#technologynews#technologytrends
0 notes
Text
Getting Started with Google Kubernetes Engine: Your Gateway to Cloud-Native Greatness
After spending over 8 years deep in the trenches of cloud engineering and DevOps, I can tell you one thing for sure: if you're serious about scalability, flexibility, and real cloud-native application deployment, Google Kubernetes Engine (GKE) is where the magic happens.
Whether you’re new to Kubernetes or just exploring managed container platforms, getting started with Google Kubernetes Engine is one of the smartest moves you can make in your cloud journey.
"Containers are cool. Orchestrated containers? Game-changing."
🚀 What is Google Kubernetes Engine (GKE)?
Google Kubernetes Engine is a fully managed Kubernetes platform that runs on top of Google Cloud. GKE simplifies deploying, managing, and scaling containerized apps using Kubernetes—without the overhead of maintaining the control plane.
Why is this a big deal?
Because Kubernetes is notoriously powerful and notoriously complex. With GKE, Google handles all the heavy lifting—from cluster provisioning to upgrades, logging, and security.
"GKE takes the complexity out of Kubernetes so you can focus on building, not babysitting clusters."
🧭 Why Start with GKE?
If you're a developer, DevOps engineer, or cloud architect looking to:
Deploy scalable apps across hybrid/multi-cloud
Automate CI/CD workflows
Optimize infrastructure with autoscaling & spot instances
Run stateless or stateful microservices seamlessly
Then GKE is your launchpad.
Here’s what makes GKE shine:
Auto-upgrades & auto-repair for your clusters
Built-in security with Shielded GKE Nodes and Binary Authorization
Deep integration with Google Cloud IAM, VPC, and Logging
Autopilot mode for hands-off resource management
Native support for Anthos, Istio, and service meshes
"With GKE, it's not about managing containers—it's about unlocking agility at scale."
🔧 Getting Started with Google Kubernetes Engine
Ready to dive in? Here's a simple flow to kick things off:
Set up your Google Cloud project
Enable Kubernetes Engine API
Install gcloud CLI and Kubernetes command-line tool (kubectl)
Create a GKE cluster via console or command line
Deploy your app using Kubernetes manifests or Helm
Monitor, scale, and manage using GKE dashboard, Cloud Monitoring, and Cloud Logging
If you're using GKE Autopilot, Google manages your node infrastructure automatically—so you only manage your apps.
“Don’t let infrastructure slow your growth. Let GKE scale as you scale.”
🔗 Must-Read Resources to Kickstart GKE
👉 GKE Quickstart Guide – Google Cloud
👉 Best Practices for GKE – Google Cloud
👉 Anthos and GKE Integration
👉 GKE Autopilot vs Standard Clusters
👉 Google Cloud Kubernetes Learning Path – NetCom Learning
🧠 Real-World GKE Success Stories
A FinTech startup used GKE Autopilot to run microservices with zero infrastructure overhead
A global media company scaled video streaming workloads across continents in hours
A university deployed its LMS using GKE and reduced downtime by 80% during peak exam seasons
"You don’t need a huge ops team to build a global app. You just need GKE."
🎯 Final Thoughts
Getting started with Google Kubernetes Engine is like unlocking a fast track to modern app delivery. Whether you're running 10 containers or 10,000, GKE gives you the tools, automation, and scale to do it right.
With Google Cloud’s ecosystem—from Cloud Build to Artifact Registry to operations suite—GKE is more than just Kubernetes. It’s your platform for innovation.
“Containers are the future. GKE is the now.”
So fire up your first cluster. Launch your app. And let GKE do the heavy lifting while you focus on what really matters—shipping great software.
Let me know if you’d like this formatted into a visual infographic or checklist to go along with the blog!
1 note
·
View note
Text
0 notes
Text
Updating Deprecated Commands in "Kubernetes in Action"
Introduction: The book “Kubernetes in Action” by Marko Luksa is a valuable resource for learning Kubernetes. However, as Kubernetes evolves, some commands in the book have become deprecated. This post provides updated commands to ensure compatibility with the latest Kubernetes version. Original and Updated Commands: kubectl get rc Original Command: kubectl get rc Updated Command: kubectl get…
0 notes
Text
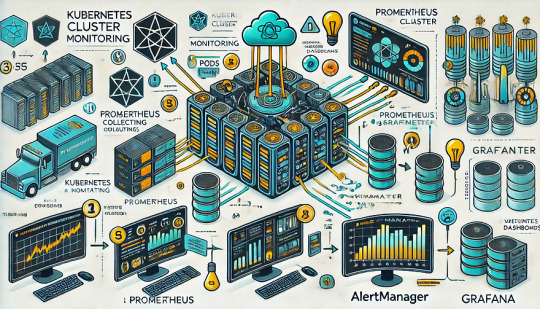
Monitoring Kubernetes Clusters with Prometheus and Grafana
Introduction
Kubernetes is a powerful container orchestration platform, but monitoring it is crucial for ensuring reliability, performance, and scalability.
Prometheus and Grafana are two of the most popular open-source tools for monitoring and visualizing Kubernetes clusters.
In this guide, we’ll walk you through setting up Prometheus and Grafana on Kubernetes and configuring dashboards for real-time insights.
Why Use Prometheus and Grafana for Kubernetes Monitoring?
Prometheus: The Monitoring Backbone
Collects metrics from Kubernetes nodes, pods, and applications.
Uses a powerful query language (PromQL) for analyzing data.
Supports alerting based on predefined conditions.
Grafana: The Visualization Tool
Provides rich dashboards with graphs and metrics.
Allows integration with multiple data sources (e.g., Prometheus, Loki, Elasticsearch).
Enables alerting and notification management.
Step 1: Installing Prometheus and Grafana on Kubernetes
Prerequisites
Before starting, ensure you have:
A running Kubernetes cluster
kubectl and Helm installed
1. Add the Prometheus Helm Chart Repository
Helm makes it easy to deploy Prometheus and Grafana using predefined configurations.shhelm repo add prometheus-community https://prometheus-community.github.io/helm-charts helm repo update
2. Install Prometheus and Grafana Using Helm
shhelm install prometheus prometheus-community/kube-prometheus-stack --namespace monitoring --create-namespace
This command installs: ✅ Prometheus — For collecting metrics ✅ Grafana — For visualization ✅ Alertmanager — For notifications ✅ Node-exporter — To collect system-level metrics
Step 2: Accessing Prometheus and Grafana
Once deployed, we need to access the Prometheus and Grafana web interfaces.
1. Accessing Prometheus
Check the Prometheus service:shkubectl get svc -n monitoring
Forward the Prometheus server port:shkubectl port-forward svc/prometheus-kube-prometheus-prometheus 9090 -n monitoring
Now, open http://localhost:9090 in your browser.
2. Accessing Grafana
Retrieve the Grafana admin password:shkubectl get secret --namespace monitoring prometheus-grafana -o jsonpath="{.data.admin-password}" | base64 --decodeForward the Grafana service port:shkubectl port-forward svc/prometheus-grafana 3000:80 -n monitoring
Open http://localhost:3000, and log in with:
Username: admin
Password: (obtained from the previous command)
Step 3: Configuring Prometheus as a Data Source in Grafana
Open Grafana and navigate to Configuration > Data Sources.
Click Add data source and select Prometheus.
Set the URL to:
sh
http://prometheus-kube-prometheus-prometheus.monitoring.svc.cluster.local:9090
Click Save & Test to verify the connection.
Step 4: Importing Kubernetes Dashboards into Grafana
Grafana provides ready-made dashboards for Kubernetes monitoring.
Go to Dashboards > Import.
Enter a dashboard ID from Grafana’s dashboard repository.
Example: Use 3119 for Kubernetes cluster monitoring.
Select Prometheus as the data source and click Import.
You’ll now have a real-time Kubernetes monitoring dashboard! 🎯
Step 5: Setting Up Alerts in Prometheus and Grafana
Creating Prometheus Alerting Rules
Create a ConfigMap for alerts:yamlapiVersion: v1 kind: ConfigMap metadata: name: alert-rules namespace: monitoring data: alert.rules: | groups: - name: InstanceDown rules: - alert: InstanceDown expr: up == 0 for: 5m labels: severity: critical annotations: summary: "Instance {{ $labels.instance }} is down"
Apply it to the cluster:shkubectl apply -f alert-rules.yaml
Configuring Grafana Alerts
Navigate to Alerting > Notification Channels.
Set up a channel (Email, Slack, or PagerDuty).
Define alert rules based on metrics from Prometheus.
Step 6: Enabling Persistent Storage for Prometheus
By default, Prometheus stores data in memory. To make the data persistent, configure storage:
Modify the Helm values:yamlprometheus: server: persistentVolume: enabled: true size: 10Gi
Apply the changes:shhelm upgrade prometheus prometheus-community/kube-prometheus-stack -f values.yaml
Conclusion
In this guide, we’ve set up Prometheus and Grafana to monitor a Kubernetes cluster. You now have: ✅ Real-time dashboards in Grafana ✅ Prometheus alerts to detect failures ✅ Persistent storage for historical metrics
WEBSITE: https://www.ficusoft.in/devops-training-in-chennai/
0 notes
Text
OpenShift vs Kubernetes: Key Differences Explained
Kubernetes has become the de facto standard for container orchestration, enabling organizations to manage and scale containerized applications efficiently. However, OpenShift, built on top of Kubernetes, offers additional features that streamline development and deployment. While they share core functionalities, they have distinct differences that impact their usability. In this blog, we explore the key differences between OpenShift and Kubernetes.
1. Core Overview
Kubernetes:
Kubernetes is an open-source container orchestration platform that automates the deployment, scaling, and operation of application containers. It provides the building blocks for containerized workloads but requires additional tools for complete enterprise-level functionality.
OpenShift:
OpenShift is a Kubernetes-based container platform developed by Red Hat. It provides additional features such as a built-in CI/CD pipeline, enhanced security, and developer-friendly tools to simplify Kubernetes management.
2. Installation & Setup
Kubernetes:
Requires manual installation and configuration.
Cluster setup involves configuring multiple components such as kube-apiserver, kube-controller-manager, kube-scheduler, and networking.
Offers flexibility but requires expertise to manage.
OpenShift:
Provides an easier installation process with automated scripts.
Includes a fully integrated web console for management.
Requires Red Hat OpenShift subscriptions for enterprise-grade support.
3. Security & Authentication
Kubernetes:
Security policies and authentication need to be manually configured.
Role-Based Access Control (RBAC) is available but requires additional setup.
OpenShift:
Comes with built-in security features.
Uses Security Context Constraints (SCCs) for enhanced security.
Integrated authentication mechanisms, including OAuth and LDAP support.
4. Networking
Kubernetes:
Uses third-party plugins (e.g., Calico, Flannel, Cilium) for networking.
Network policies must be configured separately.
OpenShift:
Uses Open vSwitch-based SDN by default.
Provides automatic service discovery and routing.
Built-in router and HAProxy-based load balancing.
5. Development & CI/CD Integration
Kubernetes:
Requires third-party tools for CI/CD (e.g., Jenkins, ArgoCD, Tekton).
Developers must integrate CI/CD pipelines manually.
OpenShift:
Comes with built-in CI/CD capabilities via OpenShift Pipelines.
Source-to-Image (S2I) feature allows developers to build images directly from source code.
Supports GitOps methodologies out of the box.
6. User Interface & Management
Kubernetes:
Managed through the command line (kubectl) or third-party UI tools (e.g., Lens, Rancher).
No built-in dashboard; requires separate installation.
OpenShift:
Includes a built-in web console for easier management.
Provides graphical interfaces for monitoring applications, logs, and metrics.
7. Enterprise Support & Cost
Kubernetes:
Open-source and free to use.
Requires skilled teams to manage and maintain infrastructure.
Support is available from third-party providers.
OpenShift:
Requires a Red Hat subscription for enterprise support.
Offers enterprise-grade stability, support, and compliance features.
Managed OpenShift offerings are available via cloud providers (AWS, Azure, GCP).
Conclusion
Both OpenShift and Kubernetes serve as powerful container orchestration platforms. Kubernetes is highly flexible and widely adopted, but it demands expertise for setup and management. OpenShift, on the other hand, simplifies the experience with built-in security, networking, and developer tools, making it a strong choice for enterprises looking for a robust, supported Kubernetes distribution.
Choosing between them depends on your organization's needs: if you seek flexibility and open-source freedom, Kubernetes is ideal; if you prefer an enterprise-ready solution with out-of-the-box tools, OpenShift is the way to go.
For more details click www.hawkstack.com
0 notes
Text
Introduction Too much monitoring and alert fatigue is a serious issue for today's engineering teams. Nowadays, there are several open-source and third-party solutions available to help you sort through the noise. It always seems too good to be true, and it probably is. However, as Kubernetes deployments have grown in complexity and size, performance optimization and observability have become critical to guaranteeing optimal resource usage and early issue identification. Kubernetes events give unique and unambiguous information about cluster health and performance. And in these days of too much data, they also give clear insight with minimal noise. In this article, we will learn about Kubernetes events and their importance, their types, and how to access them. What is a Kubernetes Event? A Kubernetes event is an object that displays what is going on inside a cluster, node, pod, or container. These items are typically created in reaction to changes that occur inside your K8s system. The Kubernetes API Server allows all key components to generate these events. In general, each event includes a log message. However, they are quite different and have no other effect on one another. Importance of Kubernetes Events When any of the resources that Kubernetes manages changes, it broadcasts an event. These events frequently provide crucial metadata about the object that caused them, such as the event category (Normal, Warning, Error), as well as the reason. This data is often saved in etcd and made available by running specific kubectl commands. These events help us understand what happened behind the scenes when an entity entered a given state. You may also obtain an aggregated list of all events by running kubectl get events. Events are produced by every part of a cluster, therefore as your Kubernetes environment grows, so will the amount of events your system produces. Furthermore, every change in your system generates events, and even healthy and normal operations require changes in a perfectly running system. This means that a big proportion of the events created by your clusters are purely informative and may not be relevant when debugging an issue. Monitoring Kubernetes Events Monitoring Kubernetes events can help you identify issues with pod scheduling, resource limits, access to external volumes, and other elements of your Kubernetes setup. Events give rich contextual hints that will assist you in troubleshooting these issues and ensuring system health, allowing you to keep your Kubernetes-based apps and infrastructure stable, reliable, and efficient. How to Identify Which Kubernetes Events are Important Naturally, there are a variety of events that may be relevant to your Kubernetes setup, and various issues may arise when Kubernetes or your cloud platform executes basic functions. Let's get into each main event. Failed Events The kube-scheduler in Kubernetes schedules pods, which contain containers that operate your application on available nodes. The kubelet monitors the node's resource use and guarantees that containers execute as intended. The building of the underlying container fails when the kube-scheduler fails to schedule a pod, causing the kubelet to generate a warning event. Eviction Events Eviction events are another crucial event to keep track of since they indicate when a node removes running pods. The most typical reason for an eviction event is a node's insufficient incompressible resources, such as RAM or storage. The kubelet generates resource-exhaustion eviction events on the affected node. In case Kubernetes determines that a pod is utilizing more incompressible resources than what its runtime permits, it can remove the pod from its node and arrange for a new time slot. Volume Events A directory holding data (like an external library) that a pod may access and expose to its containers so they can carry out their workloads with any necessary dependencies is known as a Kubernetes volume.
Separating this linked data from the pod offers a failsafe way for retaining information if the pod breaks, as well as facilitating data exchange amongst containers on the same pod. When Kubernetes assigns a volume to a new pod, it first detaches it from the node it is presently on, attaches it to the required node, and then mounts it onto a pod. Unready Node Events Node readiness is one of the requirements that the node's kubelet consistently returns as true or false. The kubelet creates unready node events when a node transitions from ready to not ready, indicating that it is not ready for pod scheduling. How to Access Kubernetes Events Metrics, logs, and events may be exported from Kubernetes for observability. With a variety of methods at your fingertips, events may be a valuable source of information about what's going on in your services. Kubernetes does not have built-in functionality for accessing, storing, or forwarding long-term events. It stores it for a brief period of time before cleaning it up. However, Kubernetes event logs may be retrieved directly from the cluster using Kubectl and collected or monitored using a logging tool. Running the kubectl describe command on a given cluster resource will provide a list of its events. A more general approach is to use the kubectl get events command, which lists the events of specified resources or the whole cluster. Many free and commercial third-party solutions assist in providing visibility and reporting Kubernetes cluster events. Let's look at some free, open-source tools and how they may be used to monitor your Kubernetes installation: KubeWatch KubeWatch is an excellent open-source solution for monitoring and broadcasting K8s events to third-party applications and webhooks. You may set it up to deliver notifications to Slack channels when major status changes occur. You may also use it to transmit events to analytics and alerting systems such as Prometheus. Events Exporter The Kubernetes Events Exporter is a good alternative to K8s' native observing mechanisms. It allows you to constantly monitor K8s events and list them as needed. It also extracts a number of metrics from the data it collects, such as event counts and unique event counts, and offers a simple monitoring configuration. EventRouter EventRouter is another excellent open-source solution for gathering Kubernetes events. It is simple to build up and seeks to stream Kubernetes events to numerous sources, as described in its documentation. However, like KubeWatch, it does not have querying or persistent capabilities. To get the full experience, you should link it to a third-party storage and analysis tool. Conclusion Kubernetes events provide an excellent approach to monitor and improve the performance of your K8s clusters. They become more effective when combined with realistic tactics and vast toolsets. I hope this article helps you to understand the importance of Kubernetes events and how to get the most out of them.
0 notes
Text
Cheat Sheet: How to install Kubernetes via kubadm on Ubuntu 24.04 (and trying to join it as an additional master to an existing cluster)
ChatGPT helped in this task, but some commands did not work immediately, so I had to ask ChatCPT how to fix the errors I encountered. The command presented here leads through the process of installing Kubernetes using kubeadm on a fresh Ubuntu 24.04 system without any errors (as long as the world does not change too much). Step 1: Install kubeadm, kubelet and kubectl MAJOR_VERSION=1.26 # Add GPG…
0 notes
Text
Getting Started with Kubernetes: A Hands-on Guide
Getting Started with Kubernetes: A Hands-on Guide
Kubernetes: A Brief Overview
Kubernetes, often abbreviated as K8s, is a powerful open-source platform designed to automate the deployment, scaling, and management of containerized applications. It1 simplifies the complexities of container orchestration, allowing developers to focus on building and deploying applications without worrying about the underlying infrastructure.2
Key Kubernetes Concepts
Cluster: A group of machines (nodes) working together to run containerized applications.
Node: A physical or virtual machine that runs containerized applications.
Pod: The smallest deployable3 unit of computing, consisting of one or more containers.
Container: A standardized unit of software that packages code and its dependencies.
Setting Up a Kubernetes Environment
To start your Kubernetes journey, you can set up a local development environment using minikube. Minikube creates a single-node Kubernetes cluster on your local machine.
Install minikube: Follow the instructions for your operating system on the minikube website.
Start the minikube cluster: Bashminikube start
Configure kubectl: Bashminikube config --default-context
Interacting with Kubernetes: Using kubectl
kubectl is the command-line tool used to interact with Kubernetes clusters. Here are some basic commands:
Get information about nodes: Bashkubectl get nodes
Get information about pods: Bashkubectl get pods
Create a deployment: Bashkubectl create deployment my-deployment --image=nginx
Expose a service: Bashkubectl expose deployment my-deployment --type=NodePort
Your First Kubernetes Application
Create a simple Dockerfile: DockerfileFROM nginx:alpine COPY index.html /usr/share/nginx/html/
Build the Docker image: Bashdocker build -t my-nginx .
Push the image to a registry (e.g., Docker Hub): Bashdocker push your-username/my-nginx
Create a Kubernetes Deployment: Bashkubectl create deployment my-nginx --image=your-username/my-nginx
Expose the deployment as a service: Bashkubectl expose deployment my-nginx --type=NodePort
Access the application: Use the NodePort exposed by the service to access the application in your browser.
Conclusion
Kubernetes offers a powerful and flexible platform for managing containerized applications. By understanding the core concepts and mastering the kubectl tool, you can efficiently deploy, scale, and manage your applications.
Keywords: Kubernetes, container orchestration, minikube, kubectl, deployment, scaling, pods, services, Docker, Dockerfile
#redhatcourses#information technology#containerorchestration#kubernetes#docker#container#linux#containersecurity#dockerswarm
1 note
·
View note
Text
CRICTL Kubernetes Command Line Tool for Troubleshooting
CRICTL Kubernetes Command Line Tool for Troubleshooting @vexpert #vmwarecommunities #kubernetes #k8s #crictl #kubectl #kubernetescli #k8stroubleshooting #devops #gitops #homelab #homeserver
CRICTL is not a command that you may have heard about when working with Kubernetes, but it is a really great utility to troubleshoot your Kubernetes cluster at the container runtime level. It provides a direct line of sight to the container runtime such as containerd or others like CRI-O. We will take a look at how to setup CRICTL and use it in a few practical examples for your Kubernetes…
0 notes
Text
Kubernetes Essentials 🚀 kubectl, YAML, Deployments Tips
In this tutorial, we cover essential Kubernetes concepts like kubectl commands, required YAML fields, Deployments, Services, ConfigMaps, and real-world best practices for smarter DevOps workflows!
✔️ Learn how kubectl talks to the Kubernetes API
🔥 Understand must-know YAML fields for production
🎯 Explore Deployments, Services, and scaling
💡 Follow real-world Kubernetes best practices for security, resource limits, and monitoring!
📂 Commands & YAML Files
youtube
0 notes
Text
Chapter 2: Setting Up Your Kubernetes Cluster
In this chapter, we’ll cover the step-by-step process to set up Kubernetes using Minikube. You’ll learn how to install and configure Minikube, explore essential kubectl commands, and navigate the Kubernetes Dashboard. Each section includes detailed commands, live examples, and insights to simulate production-like environments. 1. Installing and Configuring Minikube Minikube creates a…
0 notes