#kubernetes node
Explore tagged Tumblr posts
Visit Tumblr Blog
Explore Tumblr blogs with no restrictions, modern design and the best experience.
Last Seen Tumblr Blogs


Fun Fact
US Tumblr user growth rate is estimated to slow down to 4.1%.
Text
A step-by-step guide to writing a Kubernetes Operator in Golang
https://www.opcito.com/blogs/guide-to-write-a-kubernetes-operator-in-golang

#what is kubernetes operator#kubernetes operator#golang kubernetes"#golang operators#watcher in golang for kubernetes nodes
1 note
·
View note
Text
Kubernetes: Control Plane and Workers
In Kubernetes, the control plane and worker nodes are two key components that together form the foundation of a Kubernetes cluster. They play distinct roles in managing and running containerized applications. Here’s an explanation of each component along with examples and YAML configurations where relevant: Control Plane The control plane is the brain of the Kubernetes cluster. It manages the…

View On WordPress
0 notes
Video
youtube
Session 5 Kubernetes 3 Node Cluster and Dashboard Installation and Confi...
#youtube#In this exciting video tutorial we dive into the world of Kubernetes exploring how to set up a robust 3-node cluster and configure the Kuber
0 notes
Text
#kubernetes cluster setup#kubernetes etcd cluster setup#master node#kubernetes cluster#kubernetes#kubernetes architecture
0 notes
Text
How To Use Llama 3.1 405B FP16 LLM On Google Kubernetes
How to set up and use large open models for multi-host generation AI over GKE
Access to open models is more important than ever for developers as generative AI grows rapidly due to developments in LLMs (Large Language Models). Open models are pre-trained foundational LLMs that are accessible to the general population. Data scientists, machine learning engineers, and application developers already have easy access to open models through platforms like Hugging Face, Kaggle, and Google Cloud’s Vertex AI.
How to use Llama 3.1 405B
Google is announcing today the ability to install and run open models like Llama 3.1 405B FP16 LLM over GKE (Google Kubernetes Engine), as some of these models demand robust infrastructure and deployment capabilities. With 405 billion parameters, Llama 3.1, published by Meta, shows notable gains in general knowledge, reasoning skills, and coding ability. To store and compute 405 billion parameters at FP (floating point) 16 precision, the model needs more than 750GB of GPU RAM for inference. The difficulty of deploying and serving such big models is lessened by the GKE method discussed in this article.
Customer Experience
You may locate the Llama 3.1 LLM as a Google Cloud customer by selecting the Llama 3.1 model tile in Vertex AI Model Garden.
Once the deploy button has been clicked, you can choose the Llama 3.1 405B FP16 model and select GKE.Image credit to Google Cloud
The automatically generated Kubernetes yaml and comprehensive deployment and serving instructions for Llama 3.1 405B FP16 are available on this page.
Deployment and servicing multiple hosts
Llama 3.1 405B FP16 LLM has significant deployment and service problems and demands over 750 GB of GPU memory. The total memory needs are influenced by a number of parameters, including the memory used by model weights, longer sequence length support, and KV (Key-Value) cache storage. Eight H100 Nvidia GPUs with 80 GB of HBM (High-Bandwidth Memory) apiece make up the A3 virtual machines, which are currently the most potent GPU option available on the Google Cloud platform. The only practical way to provide LLMs such as the FP16 Llama 3.1 405B model is to install and serve them across several hosts. To deploy over GKE, Google employs LeaderWorkerSet with Ray and vLLM.
LeaderWorkerSet
A deployment API called LeaderWorkerSet (LWS) was created especially to meet the workload demands of multi-host inference. It makes it easier to shard and run the model across numerous devices on numerous nodes. Built as a Kubernetes deployment API, LWS is compatible with both GPUs and TPUs and is independent of accelerators and the cloud. As shown here, LWS uses the upstream StatefulSet API as its core building piece.
A collection of pods is controlled as a single unit under the LWS architecture. Every pod in this group is given a distinct index between 0 and n-1, with the pod with number 0 being identified as the group leader. Every pod that is part of the group is created simultaneously and has the same lifecycle. At the group level, LWS makes rollout and rolling upgrades easier. For rolling updates, scaling, and mapping to a certain topology for placement, each group is treated as a single unit.
Each group’s upgrade procedure is carried out as a single, cohesive entity, guaranteeing that every pod in the group receives an update at the same time. While topology-aware placement is optional, it is acceptable for all pods in the same group to co-locate in the same topology. With optional all-or-nothing restart support, the group is also handled as a single entity when addressing failures. When enabled, if one pod in the group fails or if one container within any of the pods is restarted, all of the pods in the group will be recreated.
In the LWS framework, a group including a single leader and a group of workers is referred to as a replica. Two templates are supported by LWS: one for the workers and one for the leader. By offering a scale endpoint for HPA, LWS makes it possible to dynamically scale the number of replicas.
Deploying multiple hosts using vLLM and LWS
vLLM is a well-known open source model server that uses pipeline and tensor parallelism to provide multi-node multi-GPU inference. Using Megatron-LM’s tensor parallel technique, vLLM facilitates distributed tensor parallelism. With Ray for multi-node inferencing, vLLM controls the distributed runtime for pipeline parallelism.
By dividing the model horizontally across several GPUs, tensor parallelism makes the tensor parallel size equal to the number of GPUs at each node. It is crucial to remember that this method requires quick network connectivity between the GPUs.
However, pipeline parallelism does not require continuous connection between GPUs and divides the model vertically per layer. This usually equates to the quantity of nodes used for multi-host serving.
In order to support the complete Llama 3.1 405B FP16 paradigm, several parallelism techniques must be combined. To meet the model’s 750 GB memory requirement, two A3 nodes with eight H100 GPUs each will have a combined memory capacity of 1280 GB. Along with supporting lengthy context lengths, this setup will supply the buffer memory required for the key-value (KV) cache. The pipeline parallel size is set to two for this LWS deployment, while the tensor parallel size is set to eight.
In brief
We discussed in this blog how LWS provides you with the necessary features for multi-host serving. This method maximizes price-to-performance ratios and can also be used with smaller models, such as the Llama 3.1 405B FP8, on more affordable devices. Check out its Github to learn more and make direct contributions to LWS, which is open-sourced and has a vibrant community.
You can visit Vertex AI Model Garden to deploy and serve open models via managed Vertex AI backends or GKE DIY (Do It Yourself) clusters, as the Google Cloud Platform assists clients in embracing a gen AI workload. Multi-host deployment and serving is one example of how it aims to provide a flawless customer experience.
Read more on Govindhtech.com
#Llama3.1#Llama#LLM#GoogleKubernetes#GKE#405BFP16LLM#AI#GPU#vLLM#LWS#News#Technews#Technology#Technologynews#Technologytrends#govindhtech
2 notes
·
View notes
Text
CNAPP Explained: The Smartest Way to Secure Cloud-Native Apps with EDSPL

Introduction: The New Era of Cloud-Native Apps
Cloud-native applications are rewriting the rules of how we build, scale, and secure digital products. Designed for agility and rapid innovation, these apps demand security strategies that are just as fast and flexible. That’s where CNAPP—Cloud-Native Application Protection Platform—comes in.
But simply deploying CNAPP isn’t enough.
You need the right strategy, the right partner, and the right security intelligence. That’s where EDSPL shines.
What is CNAPP? (And Why Your Business Needs It)
CNAPP stands for Cloud-Native Application Protection Platform, a unified framework that protects cloud-native apps throughout their lifecycle—from development to production and beyond.
Instead of relying on fragmented tools, CNAPP combines multiple security services into a cohesive solution:
Cloud Security
Vulnerability management
Identity access control
Runtime protection
DevSecOps enablement
In short, it covers the full spectrum—from your code to your container, from your workload to your network security.
Why Traditional Security Isn’t Enough Anymore
The old way of securing applications with perimeter-based tools and manual checks doesn’t work for cloud-native environments. Here’s why:
Infrastructure is dynamic (containers, microservices, serverless)
Deployments are continuous
Apps run across multiple platforms
You need security that is cloud-aware, automated, and context-rich—all things that CNAPP and EDSPL’s services deliver together.
Core Components of CNAPP
Let’s break down the core capabilities of CNAPP and how EDSPL customizes them for your business:
1. Cloud Security Posture Management (CSPM)
Checks your cloud infrastructure for misconfigurations and compliance gaps.
See how EDSPL handles cloud security with automated policy enforcement and real-time visibility.
2. Cloud Workload Protection Platform (CWPP)
Protects virtual machines, containers, and functions from attacks.
This includes deep integration with application security layers to scan, detect, and fix risks before deployment.
3. CIEM: Identity and Access Management
Monitors access rights and roles across multi-cloud environments.
Your network, routing, and storage environments are covered with strict permission models.
4. DevSecOps Integration
CNAPP shifts security left—early into the DevOps cycle. EDSPL’s managed services ensure security tools are embedded directly into your CI/CD pipelines.
5. Kubernetes and Container Security
Containers need runtime defense. Our approach ensures zero-day protection within compute environments and dynamic clusters.
How EDSPL Tailors CNAPP for Real-World Environments
Every organization’s tech stack is unique. That’s why EDSPL never takes a one-size-fits-all approach. We customize CNAPP for your:
Cloud provider setup
Mobility strategy
Data center switching
Backup architecture
Storage preferences
This ensures your entire digital ecosystem is secure, streamlined, and scalable.
Case Study: CNAPP in Action with EDSPL
The Challenge
A fintech company using a hybrid cloud setup faced:
Misconfigured services
Shadow admin accounts
Poor visibility across Kubernetes
EDSPL’s Solution
Integrated CNAPP with CIEM + CSPM
Hardened their routing infrastructure
Applied real-time runtime policies at the node level
✅ The Results
75% drop in vulnerabilities
Improved time to resolution by 4x
Full compliance with ISO, SOC2, and GDPR
Why EDSPL’s CNAPP Stands Out
While most providers stop at integration, EDSPL goes beyond:
🔹 End-to-End Security: From app code to switching hardware, every layer is secured. 🔹 Proactive Threat Detection: Real-time alerts and behavior analytics. 🔹 Customizable Dashboards: Unified views tailored to your team. 🔹 24x7 SOC Support: With expert incident response. 🔹 Future-Proofing: Our background vision keeps you ready for what’s next.
EDSPL’s Broader Capabilities: CNAPP and Beyond
While CNAPP is essential, your digital ecosystem needs full-stack protection. EDSPL offers:
Network security
Application security
Switching and routing solutions
Storage and backup services
Mobility and remote access optimization
Managed and maintenance services for 24x7 support
Whether you’re building apps, protecting data, or scaling globally, we help you do it securely.
Let’s Talk CNAPP
You’ve read the what, why, and how of CNAPP — now it’s time to act.
📩 Reach us for a free CNAPP consultation. 📞 Or get in touch with our cloud security specialists now.
Secure your cloud-native future with EDSPL — because prevention is always smarter than cure.
0 notes
Text
Mastering OpenShift at Scale: Red Hat OpenShift Administration III (DO380)
In today’s cloud-native world, organizations are increasingly adopting Kubernetes and Red Hat OpenShift to power their modern applications. As these environments scale, so do the challenges of managing complex workloads, automating operations, and ensuring reliability. That’s where Red Hat OpenShift Administration III: Scaling Kubernetes Workloads (DO380) steps in.
What is DO380?
DO380 is an advanced-level training course offered by Red Hat that focuses on scaling, performance tuning, and managing containerized applications in production using Red Hat OpenShift Container Platform. It is designed for experienced OpenShift administrators and DevOps professionals who want to deepen their knowledge of Kubernetes-based platform operations.
Who Should Take DO380?
This course is ideal for:
✅ System Administrators managing large-scale containerized environments
✅ DevOps Engineers working with CI/CD pipelines and automation
✅ Platform Engineers responsible for OpenShift clusters
✅ RHCEs or OpenShift Certified Administrators (EX280 holders) aiming to level up
Key Skills You Will Learn
Here’s what you’ll master in DO380:
🔧 Advanced Cluster Management
Configure and manage OpenShift clusters for performance and scalability.
📈 Monitoring & Tuning
Use tools like Prometheus, Grafana, and the OpenShift Console to monitor system health, tune workloads, and troubleshoot performance issues.
📦 Autoscaling & Load Management
Configure Horizontal Pod Autoscaling (HPA), Cluster Autoscaler, and manage workloads efficiently with resource quotas and limits.
🔐 Security & Compliance
Implement security policies, use node taints/tolerations, and manage namespaces for better isolation and governance.
🧪 CI/CD Pipeline Integration
Automate application delivery using Tekton pipelines and manage GitOps workflows with ArgoCD.
Course Prerequisites
Before enrolling in DO380, you should be familiar with:
Red Hat OpenShift Administration I (DO180)
Red Hat OpenShift Administration II (DO280)
Kubernetes fundamentals (kubectl, deployments, pods, services)
Certification Path
DO380 also helps you prepare for the Red Hat Certified Specialist in OpenShift Scaling and Performance (EX380) exam, which counts towards the Red Hat Certified Architect (RHCA) credential.
Why DO380 Matters
With enterprise workloads becoming more dynamic and resource-intensive, scaling OpenShift effectively is not just a bonus — it’s a necessity. DO380 equips you with the skills to:
✅ Maximize infrastructure efficiency
✅ Ensure high availability
✅ Automate operations
✅ Improve DevOps productivity
Conclusion
Whether you're looking to enhance your career, improve your organization's cloud-native capabilities, or take the next step in your Red Hat certification journey — Red Hat OpenShift Administration III (DO380) is your gateway to mastering OpenShift at scale.
Ready to elevate your OpenShift expertise?
Explore DO380 training options with HawkStack Technologies and get hands-on with real-world OpenShift scaling scenarios.
For more details www.hawkstack.com
0 notes
Text
Unlock Infrastructure Mastery: Join the Prometheus MasterClass for Monitoring & Alerting

If you've ever tried to troubleshoot a slow-loading website, debug a crashing server, or simply wanted more insight into what your system is doing behind the scenes — then monitoring and alerting are already on your radar. But here’s the deal: traditional monitoring tools often leave you juggling incomplete data, clunky dashboards, and alerts that scream, “Something’s wrong!” without telling you what, where, or why.
That’s where Prometheus comes in — and more importantly, where the Prometheus MasterClass: Infra Monitoring & Alerting! becomes your ultimate ally.
Whether you're a DevOps engineer, a system administrator, or just an aspiring tech pro, this course can be your game-changer for mastering infrastructure visibility, real-time alerting, and proactive problem-solving.
Let’s dive into why Prometheus is so powerful, what you’ll learn in this masterclass, and how it sets you on a path to dominate infrastructure monitoring like a pro.
Why Infrastructure Monitoring Matters — A Lot
Let’s break it down.
Infrastructure monitoring is like the health tracker for your digital ecosystem. It tells you how your servers, containers, databases, and applications are doing — whether they’re healthy or if they’re about to explode in a flurry of errors.
Think of it like this:
No monitoring? You're driving blindfolded.
Poor monitoring? You’re guessing where the potholes are.
Great monitoring with Prometheus? You're getting real-time traffic alerts, weather updates, and predictive insights to avoid crashes before they happen.
The problem? Setting all this up isn’t always plug-and-play — unless you're learning from a guided course like the Prometheus MasterClass: Infra Monitoring & Alerting!
Meet Prometheus – Your New Monitoring Power Tool
Prometheus is an open-source monitoring and alerting toolkit designed for reliability, performance, and flexibility. Originally developed by SoundCloud, it has since become a CNCF project (Cloud Native Computing Foundation) and a favorite in the DevOps and cloud-native world.
What makes it a rockstar?
✅ Time-series database – stores metrics efficiently ✅ Flexible query language (PromQL) – get exactly what you want ✅ Pull-based architecture – better control and reliability ✅ Built-in alert manager – integrated and customizable alerts ✅ Integration with Grafana – gorgeous dashboards in minutes ✅ Massive community support – plenty of exporters and documentation
If you're working with Kubernetes, Docker, AWS, GCP, or even legacy servers — Prometheus can slide into your stack seamlessly.
But understanding how to actually use Prometheus effectively? That’s a skill.
What You'll Learn in the Prometheus MasterClass
Now let’s talk about the Prometheus MasterClass: Infra Monitoring & Alerting!, because this isn’t just a “read the docs” kind of learning experience.
This course was crafted with both beginners and intermediate learners in mind. It’s hands-on, example-driven, and refreshingly easy to follow — no overwhelming theory, just clear, actionable learning.
Here’s what you’ll walk away with:
🔍 Understanding Metrics and Monitoring Essentials
Difference between monitoring, observability, and alerting
Types of metrics: gauge, counter, histogram, summary
Designing your monitoring strategy
⚙️ Installing and Setting Up Prometheus
How to install Prometheus on Linux and Windows systems
Navigating the configuration file (prometheus.yml)
Setting up node exporters, cAdvisor, and blackbox exporters
📈 Visualizing Metrics with Grafana
Connecting Prometheus with Grafana
Creating custom dashboards and panels
Using variables, annotations, and templating
📡 Collecting and Querying Metrics
Writing PromQL queries like a pro
Building advanced queries for insights
Getting data from third-party services
🚨 Setting Up Alerts That Actually Work
Configuring alert rules and conditions
Using Alertmanager to manage notifications
Integrating Slack, email, and other services
🛠️ Real-World Scenarios and Use Cases
Monitoring CPU, memory, and disk I/O
Detecting and responding to application crashes
Setting thresholds and predictive alerts
Analyzing service availability and response times
☁️ Bonus: Cloud + Kubernetes Monitoring
Kubernetes cluster monitoring with Prometheus
Service discovery and scraping from pods
Best practices for cloud-native environments
The best part? Every lesson is designed to be practical. You’ll be spinning up Prometheus instances, writing queries, and building dashboards right alongside the instructor.
Who Should Take This Course?
This MasterClass is perfect for:
🧠 System administrators tired of jumping between logs and guesswork
💼 DevOps professionals looking to sharpen their monitoring toolset
🌱 Cloud engineers who want visibility across dynamic infrastructures
💻 Developers interested in app performance and availability
🎯 Career switchers or students learning modern DevOps skills
Even if you’ve never touched Prometheus before, the course takes you step-by-step. And if you have used it casually? It’ll take your knowledge to the next level.
Why This Course Beats Random Tutorials
You might be thinking — can’t I just watch YouTube videos or read blog posts?
Sure. You can — but here’s why this MasterClass is a better investment of your time:
🔁 Structured Learning – Each lesson builds on the last 🎯 Focused Content – No fluff, just what works in real environments 🙋 Hands-On Practice – Real scenarios, live configurations 📚 Lifetime Access – Revisit any lesson, anytime 🧑🏫 Expert Guidance – Learn from an instructor with real-world experience 📈 Career-Boosting Value – Add it to your resume, your GitHub, your confidence
And yes — once you enroll in the Prometheus MasterClass: Infra Monitoring & Alerting!, you’ll gain full access to everything, including updates, resources, and community support.
Real Results: What Others Are Saying
💬 "I went from not knowing what a time-series metric was to building real dashboards for my team." 💬 "The best Prometheus learning resource I’ve ever used. Well-structured and practical." 💬 "I finally understand PromQL. The instructor makes it so clear!" 💬 "After this course, I set up alerting that saved us from a major outage last week."
There’s a reason this course is gaining momentum — because it works.
The Future is Observable — Don’t Stay in the Dark
Modern infrastructure is fast, dynamic, and complex. The days of hoping your app works fine in production are long gone. You need visibility, insights, and the power to act fast.
That’s exactly what Prometheus offers — and what this course teaches you to harness.
The Prometheus MasterClass: Infra Monitoring & Alerting! is your opportunity to master one of the most in-demand tools in modern DevOps. Whether you’re upgrading your skills or future-proofing your career — this is the place to start.
Ready to Take Control of Your Infrastructure?
Enroll now in the Prometheus MasterClass: Infra Monitoring & Alerting! and take the first step toward becoming the go-to monitoring expert in your team.
👉 No guesswork. 👉 No overwhelm. 👉 Just clean, clear, confident infrastructure management.
0 notes
Text

Comparison of Ubuntu, Debian, and Yocto for IIoT and Edge Computing
In industrial IoT (IIoT) and edge computing scenarios, Ubuntu, Debian, and Yocto Project each have unique advantages. Below is a detailed comparison and recommendations for these three systems:
1. Ubuntu (ARM)
Advantages
Ready-to-use: Provides official ARM images (e.g., Ubuntu Server 22.04 LTS) supporting hardware like Raspberry Pi and NVIDIA Jetson, requiring no complex configuration.
Cloud-native support: Built-in tools like MicroK8s, Docker, and Kubernetes, ideal for edge-cloud collaboration.
Long-term support (LTS): 5 years of security updates, meeting industrial stability requirements.
Rich software ecosystem: Access to AI/ML tools (e.g., TensorFlow Lite) and databases (e.g., PostgreSQL ARM-optimized) via APT and Snap Store.
Use Cases
Rapid prototyping: Quick deployment of Python/Node.js applications on edge gateways.
AI edge inference: Running computer vision models (e.g., ROS 2 + Ubuntu) on Jetson devices.
Lightweight K8s clusters: Edge nodes managed by MicroK8s.
Limitations
Higher resource usage (minimum ~512MB RAM), unsuitable for ultra-low-power devices.
2. Debian (ARM)
Advantages
Exceptional stability: Packages undergo rigorous testing, ideal for 24/7 industrial operation.
Lightweight: Minimal installation requires only 128MB RAM; GUI-free versions available.
Long-term support: Up to 10+ years of security updates via Debian LTS (with commercial support).
Hardware compatibility: Supports older or niche ARM chips (e.g., TI Sitara series).
Use Cases
Industrial controllers: PLCs, HMIs, and other devices requiring deterministic responses.
Network edge devices: Firewalls, protocol gateways (e.g., Modbus-to-MQTT).
Critical systems (medical/transport): Compliance with IEC 62304/DO-178C certifications.
Limitations
Older software versions (e.g., default GCC version); newer features require backports.
3. Yocto Project
Advantages
Full customization: Tailor everything from kernel to user space, generating minimal images (<50MB possible).
Real-time extensions: Supports Xenomai/Preempt-RT patches for μs-level latency.
Cross-platform portability: Single recipe set adapts to multiple hardware platforms (e.g., NXP i.MX6 → i.MX8).
Security design: Built-in industrial-grade features like SELinux and dm-verity.
Use Cases
Custom industrial devices: Requires specific kernel configurations or proprietary drivers (e.g., CAN-FD bus support).
High real-time systems: Robotic motion control, CNC machines.
Resource-constrained terminals: Sensor nodes running lightweight stacks (e.g., Zephyr+FreeRTOS hybrid deployment).
Limitations
Steep learning curve (BitBake syntax required); longer development cycles.
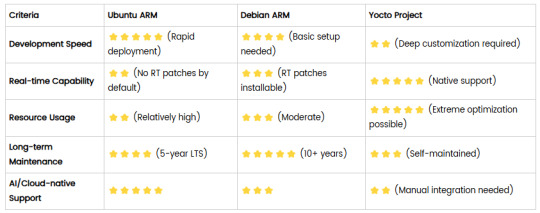
4. Comparison Summary
5. Selection Recommendations
Choose Ubuntu ARM: For rapid deployment of edge AI applications (e.g., vision detection on Jetson) or deep integration with public clouds (e.g., AWS IoT Greengrass).
Choose Debian ARM: For mission-critical industrial equipment (e.g., substation monitoring) where stability outweighs feature novelty.
Choose Yocto Project: For custom hardware development (e.g., proprietary industrial boards) or strict real-time/safety certification (e.g., ISO 13849) requirements.
6. Hybrid Architecture Example
Smart factory edge node:
Real-time control layer: RTOS built with Yocto (controlling robotic arms)
Data processing layer: Debian running OPC UA servers
Cloud connectivity layer: Ubuntu Server managing K8s edge clusters
Combining these systems based on specific needs can maximize the efficiency of IIoT edge computing.
0 notes
Text
Effective Kubernetes cluster monitoring simplifies containerized workload management by measuring uptime, resource use (such as memory, CPU, and storage), and interaction between cluster components. It also enables cluster managers to monitor the cluster and discover issues such as inadequate resources, errors, pods that fail to start, and nodes that cannot join the cluster. Essentially, Kubernetes monitoring enables you to discover issues and manage Kubernetes clusters more proactively. What Kubernetes Metrics Should You Measure? Monitoring Kubernetes metrics is critical for ensuring the reliability, performance, and efficiency of applications in a Kubernetes cluster. Because Kubernetes constantly expands and maintains containers, measuring critical metrics allows you to spot issues early on, optimize resource allocation, and preserve overall system integrity. Several factors are critical to watch with Kubernetes: Cluster monitoring - Monitors the health of the whole Kubernetes cluster. It helps you find out how many apps are running on a node, if it is performing efficiently and at the right capacity, and how much resource the cluster requires overall. Pod monitoring - Tracks issues impacting individual pods, including resource use, application metrics, and pod replication or auto scaling metrics. Ingress metrics - Monitoring ingress traffic can help in discovering and managing a variety of issues. Using controller-specific methods, ingress controllers can be set up to track network traffic information and workload health. Persistent storage - Monitoring volume health allows Kubernetes to implement CSI. You can also use the external health monitor controller to track node failures. Control plane metrics - With control plane metrics we can track and visualize cluster performance while troubleshooting by keeping an eye on schedulers, controllers, and API servers. Node metrics - Keeping an eye on each Kubernetes node's CPU and memory usage might help ensure that they never run out. A running node's status can be defined by a number of conditions, such as Ready, MemoryPressure, DiskPressure, OutOfDisk, and NetworkUnavailable. Monitoring and Troubleshooting Kubernetes Clusters Using the Kubernetes Dashboard The Kubernetes dashboard is a web-based user interface for Kubernetes. It allows you to deploy containerized apps to a Kubernetes cluster, see an overview of the applications operating on the cluster, and manage cluster resources. Additionally, it enables you to: Debug containerized applications by examining data on the health of your Kubernetes cluster's resources, as well as any anomalies that have occurred. Create and modify individual Kubernetes resources, including deployments, jobs, DaemonSets, and StatefulSets. Have direct control over your Kubernetes environment using the Kubernetes dashboard. The Kubernetes dashboard is built into Kubernetes by default and can be installed and viewed from the Kubernetes master node. Once deployed, you can visit the dashboard via a web browser to examine extensive information about your Kubernetes cluster and conduct different operations like scaling deployments, establishing new resources, and updating application configurations. Kubernetes Dashboard Essential Features Kubernetes Dashboard comes with some essential features that help manage and monitor your Kubernetes clusters efficiently: Cluster overview: The dashboard displays information about your Kubernetes cluster, including the number of nodes, pods, and services, as well as the current CPU and memory use. Resource management: The dashboard allows you to manage Kubernetes resources, including deployments, services, and pods. You can add, update, and delete resources while also seeing extensive information about them. Application monitoring: The dashboard allows you to monitor the status and performance of Kubernetes-based apps. You may see logs and stats, fix issues, and set alarms.
Customizable views: The dashboard allows you to create and preserve bespoke dashboards with the metrics and information that are most essential to you. Kubernetes Monitoring Best Practices Here are some recommended practices to help you properly monitor and debug Kubernetes installations: 1. Monitor Kubernetes Metrics Kubernetes microservices require understanding granular resource data like memory, CPU, and load. However, these metrics may be complex and challenging to leverage. API indicators such as request rate, call error, and latency are the most effective KPIs for identifying service faults. These metrics can immediately identify degradations in a microservices application's components. 2. Ensure Monitoring Systems Have Enough Data Retention Having scalable monitoring solutions helps you to efficiently monitor your Kubernetes cluster as it grows and evolves over time. As your Kubernetes cluster expands, so will the quantity of data it creates, and your monitoring systems must be capable of handling this rise. If your systems are not scalable, they may get overwhelmed by the volume of data and be unable to offer accurate or relevant results. 3. Integrate Monitoring Systems Into Your CI/CD Pipeline Source Integrating Kubernetes monitoring solutions with CI/CD pipelines enables you to monitor your apps and infrastructure as they are deployed, rather than afterward. By connecting your monitoring systems to your pipeline for continuous integration and delivery (CI/CD), you can automatically collect and process data from your infrastructure and applications as it is delivered. This enables you to identify potential issues early on and take action to stop them from getting worse. 4. Create Alerts You may identify the problems with your Kubernetes cluster early on and take action to fix them before they get worse by setting up the right alerts. For example, if you configure alerts for crucial metrics like CPU or memory use, you will be informed when those metrics hit specific thresholds, allowing you to take action before your cluster gets overwhelmed. Conclusion Kubernetes allows for the deployment of a large number of containerized applications within its clusters, each of which has nodes that manage the containers. Efficient observability across various machines and components is critical for successful Kubernetes container orchestration. Kubernetes has built-in monitoring facilities for its control plane, but they may not be sufficient for thorough analysis and granular insight into application workloads, event logging, and other microservice metrics within Kubernetes clusters.
0 notes
Text
Scaling Inference AI: How to Manage Large-Scale Deployments
As artificial intelligence continues to transform industries, the focus has shifted from model development to operationalization—especially inference at scale. Deploying AI models into production across hundreds or thousands of nodes is a different challenge than training them. Real-time response requirements, unpredictable workloads, cost optimization, and system resilience are just a few of the complexities involved.
In this blog post, we’ll explore key strategies and architectural best practices for managing large-scale inference AI deployments in production environments.
1. Understand the Inference Workload
Inference workloads vary widely depending on the use case. Some key considerations include:
Latency sensitivity: Real-time applications (e.g., fraud detection, recommendation engines) demand low latency, whereas batch inference (e.g., customer churn prediction) is more tolerant.
Throughput requirements: High-traffic systems must process thousands or millions of predictions per second.
Resource intensity: Models like transformers and diffusion models may require GPU acceleration, while smaller models can run on CPUs.
Tailor your infrastructure to the specific needs of your workload rather than adopting a one-size-fits-all approach.
2. Model Optimization Techniques
Optimizing models for inference can dramatically reduce resource costs and improve performance:
Quantization: Convert models from 32-bit floats to 16-bit or 8-bit precision to reduce memory footprint and accelerate computation.
Pruning: Remove redundant or non-critical parts of the network to improve speed.
Knowledge distillation: Replace large models with smaller, faster student models trained to mimic the original.
Frameworks like TensorRT, ONNX Runtime, and Hugging Face Optimum can help implement these optimizations effectively.
3. Scalable Serving Architecture
For serving AI models at scale, consider these architectural elements:
Model servers: Tools like TensorFlow Serving, TorchServe, Triton Inference Server, and BentoML provide flexible options for deploying and managing models.
Autoscaling: Use Kubernetes (K8s) with horizontal pod autoscalers to adjust resources based on traffic.
Load balancing: Ensure even traffic distribution across model replicas with intelligent load balancers or service meshes.
Multi-model support: Use inference runtimes that allow hot-swapping models or running multiple models concurrently on the same node.
Cloud-native design is essential—containerization and orchestration are foundational for scalable inference.
4. Edge vs. Cloud Inference
Deciding where inference happens—cloud, edge, or hybrid—affects latency, bandwidth, and cost:
Cloud inference provides centralized control and easier scaling.
Edge inference minimizes latency and data transfer, especially important for applications in autonomous vehicles, smart cameras, and IoT
Hybrid architectures allow critical decisions to be made at the edge while sending more complex computations to the cloud..
Choose based on the tradeoffs between responsiveness, connectivity, and compute resources.
5. Observability and Monitoring
Inference at scale demands robust monitoring for performance, accuracy, and availability:
Latency and throughput metrics: Track request times, failed inferences, and traffic spikes.
Model drift detection: Monitor if input data or prediction distributions are changing, signaling potential degradation.
A/B testing and shadow deployments: Test new models in parallel with production ones to validate performance before full rollout.
Tools like Prometheus, Grafana, Seldon Core, and Arize AI can help maintain visibility and control.
6. Cost Management
Running inference at scale can become costly without careful management:
Right-size compute instances: Don’t overprovision; match hardware to model needs.
Use spot instances or serverless options: Leverage lower-cost infrastructure when SLAs allow.
Batch low-priority tasks: Queue and batch non-urgent inferences to maximize hardware utilization.
Cost-efficiency should be integrated into deployment decisions from the start.
7. Security and Governance
As inference becomes part of critical business workflows, security and compliance matter:
Data privacy: Ensure sensitive inputs (e.g., healthcare, finance) are encrypted and access-controlled.
Model versioning and audit trails: Track changes to deployed models and their performance over time.
API authentication and rate limiting: Protect your inference endpoints from abuse.
Secure deployment pipelines and strict governance are non-negotiable in enterprise environments.
Final Thoughts
Scaling AI inference isn't just about infrastructure—it's about building a robust, flexible, and intelligent ecosystem that balances performance, cost, and user experience. Whether you're powering voice assistants, recommendation engines, or industrial robotics, successful large-scale inference requires tight integration between engineering, data science, and operations.
Have questions about deploying inference at scale? Let us know what challenges you’re facing and we’ll dive in.
0 notes
Text
Why GPU PaaS Is Incomplete Without Infrastructure Orchestration and Tenant Isolation
GPU Platform-as-a-Service (PaaS) is gaining popularity as a way to simplify AI workload execution — offering users a friendly interface to submit training, fine-tuning, and inferencing jobs. But under the hood, many GPU PaaS solutions lack deep integration with infrastructure orchestration, making them inadequate for secure, scalable multi-tenancy.
If you’re a Neocloud, sovereign GPU cloud, or an enterprise private GPU cloud with strict compliance requirements, you are probably looking at offering job scheduling of Model-as-a-Service to your tenants/users. An easy approach is to have a global Kubernetes cluster that is shared across multiple tenants. The problem with this approach is poor security as the underlying OS kernel, CPU, GPU, network, and storage resources are shared by all users without any isolation. Case-in-point, in September 2024, Wiz discovered a critical GPU container and Kubernetes vulnerability that affected over 35% of environments. Thus, doing just Kubernetes namespace or vCluster isolation is not safe.
You need to provision bare metal, configure network and fabric isolation, allocate high-performance storage, and enforce tenant-level security boundaries — all automated, dynamic, and policy-driven.
In short: PaaS is not enough. True GPUaaS begins with infrastructure orchestration.
The Pitfall of PaaS-Only GPU Platforms
Many AI platforms stop at providing:
A web UI for job submission
A catalog of AI/ML frameworks or models
Basic GPU scheduling on Kubernetes
What they don’t offer:
Control over how GPU nodes are provisioned (bare metal vs. VM)
Enforcement of north-south and east-west isolation per tenant
Configuration and Management of Infiniband, RoCE or Spectrum-X fabric
Lifecycle Management and Isolation of External Parallel Storage like DDN, VAST, or WEKA
Per-Tenant Quota, Observability, RBAC, and Policy Governance
Without these, your GPU PaaS is just a thin UI on top of a complex, insecure, and hard-to-scale backend.
What Full-Stack Orchestration Looks Like
To build a robust AI cloud platform — whether sovereign, Neocloud, or enterprise — the orchestration layer must go deeper.
How aarna.ml GPU CMS Solves This Problem
aarna.ml GPU CMS is built from the ground up to be infrastructure-aware and multi-tenant-native. It includes all the PaaS features you would expect, but goes beyond PaaS to offer:
BMaaS and VMaaS orchestration: Automated provisioning of GPU bare metal or VM pools for different tenants.
Tenant-level network isolation: Support for VXLAN, VRF, and fabric segmentation across Infiniband, Ethernet, and Spectrum-X.
Storage orchestration: Seamless integration with DDN, VAST, WEKA with mount point creation and tenant quota enforcement.
Full-stack observability: Usage stats, logs, and billing metrics per tenant, per GPU, per model.
All of this is wrapped with a PaaS layer that supports Ray, SLURM, KAI, Run:AI, and more, giving users flexibility while keeping cloud providers in control of their infrastructure and policies.
Why This Matters for AI Cloud Providers
If you're offering GPUaaS or PaaS without infrastructure orchestration:
You're exposing tenants to noisy neighbors or shared vulnerabilities
You're missing critical capabilities like multi-region scaling or LLM isolation
You’ll be unable to meet compliance, governance, and SemiAnalysis ClusterMax1 grade maturity
With aarna.ml GPU CMS, you deliver not just a PaaS, but a complete, secure, and sovereign-ready GPU cloud platform.
Conclusion
GPU PaaS needs to be a complete stack with IaaS — it’s not just a model serving interface!
To deliver scalable, secure, multi-tenant AI services, your GPU PaaS stack must be expanded to a full GPU cloud management software stack to include automated provisioning of compute, network, and storage, along with tenant-aware policy and observability controls.
Only then is your GPU PaaS truly production-grade.
Only then are you ready for sovereign, enterprise, and commercial AI cloud success.
To see a live demo or for a free trial, contact aarna.ml
This post orginally posted on https://www.aarna.ml/
0 notes
Text
Modern Tools Enhance Data Governance and PII Management Compliance

Modern data governance focuses on effectively managing Personally Identifiable Information (PII). Tools like IBM Cloud Pak for Data (CP4D), Red Hat OpenShift, and Kubernetes provide organizations with comprehensive solutions to navigate complex regulatory requirements, including GDPR (General Data Protection Regulation) and CCPA (California Consumer Privacy Act). These platforms offer secure data handling, lineage tracking, and governance automation, helping businesses stay compliant while deriving value from their data.
PII management involves identifying, protecting, and ensuring the lawful use of sensitive data. Key requirements such as transparency, consent, and safeguards are essential to mitigate risks like breaches or misuse. IBM Cloud Pak for Data integrates governance, lineage tracking, and AI-driven insights into a unified framework, simplifying metadata management and ensuring compliance. It also enables self-service access to data catalogs, making it easier for authorized users to access and manage sensitive data securely.
Advanced IBM Cloud Pak for Data features include automated policy reinforcement and role-based access that ensure that PII remains protected while supporting analytics and machine learning applications. This approach simplifies compliance, minimizing the manual workload typically associated with regulatory adherence.
The growing adoption of multi-cloud environments has necessitated the development of platforms such as Informatica and Collibra to offer complementary governance tools that enhance PII protection. These solutions use AI-supported insights, automated data lineage, and centralized policy management to help organizations seeking to improve their data governance frameworks.
Mr. Valihora has extensive experience with IBM InfoSphere Information Server “MicroServices” products (which are built upon Red Hat Enterprise Linux Technology – in conjunction with Docker\Kubernetes.) Tim Valihora - President of TVMG Consulting Inc. - has extensive experience with respect to:
IBM InfoSphere Information Server “Traditional” (IIS v11.7.x)
IBM Cloud PAK for Data (CP4D)
IBM “DataStage Anywhere”
Mr. Valihora is a US based (Vero Beach, FL) Data Governance specialist within the IBM InfoSphere Information Server (IIS) software suite and is also Cloud Certified on Collibra Data Governance Center.
Career Highlights Include: Technical Architecture, IIS installations, post-install-configuration, SDLC mentoring, ETL programming, performance-tuning, client-side training (including administrators, developers or business analysis) on all of the over 15 out-of-the-box IBM IIS products Over 180 Successful IBM IIS installs - Including the GRID Tool-Kit for DataStage (GTK), MPP, SMP, Multiple-Engines, Clustered Xmeta, Clustered WAS, Active-Passive Mirroring and Oracle Real Application Clustered “IADB” or “Xmeta” configurations. Tim Valihora has been credited with performance tuning the words fastest DataStage job which clocked in at 1.27 Billion rows of inserts\updates every 12 minutes (using the Dynamic Grid ToolKit (GTK) for DataStage (DS) with a configuration file that utilized 8 compute-nodes - each with 12 CPU cores and 64 GB of RAM.)
0 notes
Video
youtube
Session 5 Kubernetes 3 Node Cluster and Dashboard Installation and Confi...
#youtube#Kubernetes 3 Node Cluster and Dashboard Installation and Configuration with Podman 🚀 In this exciting video tutorial we dive into the worl
1 note
·
View note
Text
Jenkins vs GitLab CI/CD: Key Differences Explained

In the world of DevOps and software automation, choosing the right CI/CD tool can significantly impact your team's productivity and the efficiency of your development pipeline. Two of the most popular tools in this space are Jenkins and GitLab CI/CD. While both are designed to automate the software delivery process, they differ in structure, usability, and integration capabilities. Below is a detailed look at the differences between Jenkins and GitLab CI/CD, helping you make an informed decision based on your project requirements.
1. Core integration and setup Jenkins is a stand-alone open-source automation server that requires you to set up everything manually, including integrations with source control systems, plugins, and build environments. This setup can be powerful but complex, especially for smaller teams or those new to CI/CD tools. GitLab CI/CD, on the other hand, comes as an integrated part of the GitLab platform. From code repositories to issue tracking and CI/CD pipelines, everything is included in one interface. This tight integration makes it more user-friendly and easier to manage from day one.
2. Plugin dependency vs built-in tools One of Jenkins’ biggest strengths—and weaknesses—is its plugin ecosystem. With over 1,800 plugins available, Jenkins allows deep customization and support for almost any development environment. However, this heavy reliance on plugins also means users must spend time managing compatibility, updates, and security. In contrast, GitLab CI/CD provides most essential features out of the box, reducing the need for third-party plugins. Whether you need container support, auto DevOps, or security testing, GitLab includes these tools natively, making maintenance much easier.
3. Pipeline configuration methods Jenkins pipelines can be configured using a web interface or through a Jenkinsfile written in Groovy. While powerful, this approach requires familiarity with Jenkins syntax and structure, which can add complexity to your workflow. GitLab CI/CD uses a YAML-based file named .gitlab-ci.yml placed in the root of your repository. This file is easy to read and version-controlled, allowing teams to manage pipeline changes along with their codebase. The simplicity of YAML makes GitLab pipelines more accessible, especially to developers with limited DevOps experience.
4. User interface and experience Jenkins’ UI is considered outdated by many users, with limited design improvements over the years. While functional, it’s not the most intuitive experience, especially when managing complex builds and pipeline jobs. GitLab CI/CD offers a modern and clean interface, providing real-time pipeline status, logs, and visual job traces directly from the dashboard. This improves transparency and makes debugging or monitoring easier for teams.
5. Scalability and performance Jenkins can scale to support complex builds and large organizations, especially with the right infrastructure. However, this flexibility comes at a cost: teams are responsible for maintaining, upgrading, and scaling Jenkins nodes manually. GitLab CI/CD supports scalable runners that can be configured for distributed builds. It also works well with Kubernetes and cloud environments, enabling easier scalability without extensive manual setup.
6. Community and support Jenkins, being older, has a large community and long-standing documentation. This makes it easier to find help or solutions for common problems. GitLab CI/CD, though newer, benefits from active development and enterprise support, with frequent updates and a growing user base.
To explore the topic in more depth, check out this guide on the differences between Jenkins and GitLab CI/CD, which breaks down the tools in more technical detail.
Conclusion The choice between Jenkins and GitLab CI/CD depends on your project size, team expertise, and need for customization. Jenkins is ideal for organizations that need deep flexibility and are prepared to handle manual configurations. GitLab CI/CD is perfect for teams looking for an all-in-one DevOps platform that’s easy to set up and manage. Both tools are powerful, but understanding the differences between Jenkins and GitLab CI/CD can help you choose the one that fits your workflow best.
1 note
·
View note
Text
EKS Dashboard: Kubernetes cluster Access over AWS Regions

Kubernetes cluster visibility may be centralised across AWS regions and accounts using EKS Dashboard.
EKS Dashboard
EKS Dashboard is a new AWS feature. A centralised display allows cluster administrators and cloud architects monitor their Kubernetes clusters organisationally. Its major goal is to give clients a single view of clusters across AWS Regions and accounts. This single view helps track cluster inventories, compliance, operational activity planning, and version updates.
The EKS Dashboard helps companies scale Kubernetes deployments. Multiple clusters are often run for data sovereignty, business continuity, or better availability. This distributed technique makes visibility and control difficult, especially in decentralised systems with several regions and accounts. Clients have traditionally used external products for centralised cluster visibility. Third-party solutions' identification and access setup, licensing costs, and ongoing maintenance added complexity.
The EKS Dashboard simplifies this procedure with native AWS Console dashboard features. It offers data about clusters, regulated node groups, and EKS add-ons. Dashboard insights include cluster health indicators, predicted extended support EKS control plane charges, support status, account, version, and cluster distribution by region. Automatic filtering lets users explore certain data points. This feature makes clusters easier to find and focus on.
A brief tour of the EKS Dashboard shows tabular, graphical, and map representations of Kubernetes clusters. Advanced search and filtering are offered. There are several widgets for cluster visualisation. You can visualise managed node groups by AMI versions, launch templates, and instance type distribution. You can also map your clusters worldwide. Data from the dashboard can be exported for study or custom reports.
Setting up EKS Dashboard
According to reports, EKS Dashboard setup is easy. AWS Organisation management and administrator accounts grant clients access to the EKS interface Dashboard. Turning on trusted access on the organization's Amazon EKS settings page is the only setup requirement. Dashboard settings allow trusted access. The management account can view the Dashboard with trusted access. The official AWS Documentation provides setup and configuration details.
Importantly, the EKS Dashboard is not limited to Amazon EKS clusters. It can also provide visibility into linked Kubernetes clusters on-site or on other cloud providers. Even while hybrid or multi-cloud clusters may have inferior data quality than native Amazon EKS clusters, this functionality provides uniform visibility for enterprises.
Availability
The EKS Dashboard is currently available in the US East (N. Virginia). Use it to integrate data from all commercial AWS Regions. No additional fees apply to the EKS Dashboard.
This new functionality emphasises AWS's commitment to simplifying Kubernetes operations. To let clients focus on app development and growth, infrastructure management is removed.
Finally, the native AWS EKS Dashboard provides a unified view of Kubernetes clusters across accounts and regions. It provides basic visibility for linked non-EKS clusters, comprehensive visualisations, extensive insights, and quick setup at no additional cost.
#EKSDashboard#Kubernetesclusters#AmazonEKS#AmazonEKSclusters#AmazonEKSDashboard#AWSRegions#technology#technews#technologynews#news#govindhtech
0 notes