#lm 2.3.1
Text
the montfermeil sequence, according to the musical

75 notes
·
View notes
Text
So much is going on in this relatively short chapter. We learn a thing or two about Montfermeil during Hugo’s era (a town with plaster villas and bourgeois) and back in 1823, when it had problems with drinking water. Almost immediately after this revelation, Cosette, referred to as 'the poor creature,' is reintroduced, highlighting her greatest fear of venturing out after dark to fetch water.
The narrative then shifts, presenting a kaleidoscope of scenes and themes (it comes out that kaleidoscopes were in fashion in 1823). We're immersed in a Christmas fair and a wandering menagerie featuring Brazilian vultures sporting 'a tricolored cockade for an eye'—an attraction likely to evoke nostalgia among local Bonapartists for bygone days. (I had to look for that bird: it’s not just its eye—good, initially I worried that it was somehow mutilated—but the entire head is adorned in red, blue, and whitish-yellowish hues. To be honest, tricolour is the last thing I would think of looking at this creature). Fragments of peasants' conversations at the tavern offer a glimpse into Hugo's early attempts at creating a polyphonic effect, a technique that will unfold further in subsequent Revolution chapters.
The chapter concludes with the poignant introduction of two children, criminally neglected by the Thénardiers. Cosette, with her bare feet exposed to the winter cold, diligently knitting stockings for other children, juxtaposed with Gavroche, who bursts forth with a cry. The scene is complete with a chilling detail—a whip ominously hanging on the wall. Poor children.

21 notes
·
View notes
Text

#my posts#les mis#les miserables#victor hugo#lascelles wraxall#wraxall translation#lynd ward#lm 2.3.1#cosette
14 notes
·
View notes
Photo


LES MIS LETTERS IN ADAPTATION - The Water Question at Montfermeil, LM 2.3.1 (Les Miserables 1925)
At intervals the cry of a very young child, which was somewhere in the house, rang through the noise of the dram-shop. It was a little boy who had been born to the Thénardiers during one of the preceding winters,—“she did not know why,” she said, “the result of the cold,”—and who was a little more than three years old. The mother had nursed him, but she did not love him. When the persistent clamor of the brat became too annoying, “Your son is squalling,” Thénardier would say; “do go and see what he wants.” “Bah!” the mother would reply, “he bothers me.” And the neglected child continued to shriek in the dark.
#Les Mis#Les Miserables#Les Mis Letters#Les Mis Letters in Adaptation#LM 2.3.1#Gavroche#Gavroche Thenardier#Les Mis 1925#Les Miserables 1925#lesmisedit#lesmiserablesedit#silentfilmedit#filmedit#lesmiserables1925edit#pureanonedits
89 notes
·
View notes
Text
Hugo’s description of class in Montfermeil is fascinating. When we’re taking in the town as a whole, it might become a place that the bourgeoisie visit in Hugo’s day, but it’s a small peasant village in 1823. However, as we “zoom in” on the village, we focus on the “aristocracy” that the Thénardiers are part of. Within the town, then, there are hierarchies that have a more tangible day-to-day impact on the lives of the people than their overall class backgrounds. It’s similar to what we saw in Montreuil-sur-Mer’s politics; the central government has a presence there, symbolically represented by the police and tangible when taxes are collected, but otherwise, people mainly saw the mayor as responsible for governance. Similarly, the Thénardiers may not actually be rich, but for the standards of Montfermeil, they’re in a fairly privileged position, and they certainly have power because of it.
When we’re in the inn itself, Hugo reverts to calling the Thénardiers bourgeois, noting that they owned a kaleidoscope and a lamp that were popular in that class in that year. Again, we see that they do enjoy some level of financial comfort; they can not only afford to get water carried uphill for them, but they can buy things that they don’t need fairly regularly (as these decorations were marked with the year). The fact that the people at the inn are bourgeois, craftspeople, or peasants is evident as well from their conversations, which focus on issues like grape-growing for wine, wheat, and grass.
To an extent, the inn has a cheery atmosphere. Everyone is talking to each other, the customers seem content, and it’s Christmastime. However, the darkness that’s always present with the Thénardiers is there. Of course, we see Cosette working to provide the Thénardier girls with stockings (stockings that the parents could possibly just buy, as they can afford extra decorations). She herself covers her feet with wooden shoes because she doesn’t have any stockings, even though it’s winter. This is her usual position, and yet no one comments on this because they’re all inured to her neglect. Worst of all, there’s now the addition of a child’s voice. Cosette is always visible in the background of the inn, but she’s silent, a songless lark; the Thénardier boy now cries constantly for his mother’s care, but he receives nothing. And still, hearing and seeing this neglect, no one interferes. Montfermeil represents the chilling acceptance of this cruelty by society at large, primarily through simply ignoring it. Cosette`s abuse meets a more vengeful acceptance by the townspeople (seeing the Thénardiers’ care for her in any form as charity beyond what they should be expected to do), but even their own son is treated poorly, highlighting that regardless of the excuses given, the people of the town are simply willing to overlook a great deal of suffering to continue with their own lives. Most specifically, they ignore these children’s pain to keep enjoying themselves. The inn is a space of entertainment that they refuse to acknowledge is marred by horrific abuse and neglect.
31 notes
·
View notes
Text
Brick Club 2.3.2 “Two Portraits Filled In”
Hugo acknowledging how much more stressful and intense and exhausting life is for women while discussing Mme Thenardier is interesting. If Mme Thenardier’s life was hard and she was essentially ten years older than her actual age, then we must imagine how much worse it was for Fantine.
(I desperately wish any of the film versions of the Brick had cast Shawna Hamic from the 2011 US tour as Mme Thenardier. She was absolutely perfect in every way as that role. She’s also really really nice.)
Mme Thenardier is the opposite of Sister Simplice in how not-a-woman she is. Simplice is not a woman because she is essentially a sacred being, a sexless vessel of piety and faith. Mme Thenardier is not a woman because she lacks the grace, poise, frame, etc. Essentially, Simplice is not a woman because she is So Pious and Mme Thenardier is not a woman because she is So Brutish.
Thenardier appropriates and twists the history of the last of the Guard and Cambronne’s death in order to create a fictional glory for himself. Only he’s the lone survivor standing ground against the Hussars Of Death rather than Cambronne standing ground against English artillery. And he gets to survive it, in his story, because of course he does. Cambronne was great because he was defiant despite the fact that he didn’t survive. Thenardier is a sleaze, so he’s going to survive, because that’s what he does. He is the opposite of Cambronne, who will sacrifice his life for France and Napoleon; Thenardier will sacrifice others for his own benefit, and will try as hard as possible to survive himself.
Again, we see Thenardier as the embodiment of that sort of mobile cour des miracles that we saw on the field of Waterloo. He can and will change his manner and face and conversation to fit the circumstances. He can place his past or his origin anywhere in time or space that is most useful. He is an actor, a player on the stage of life in order to swindle whatever he can.
Thenardier plays the trickster role in this book. Some characteristics of a trickster: he breaks both societal and physical rules; he can often often shapeshift; his antics hurt or affect or discomfort the protagonists, but he is usually ultimately left untouched; often a trickster character will have gender variability, which we see in Thenardier’s letters to get money; he is often boastful and openly mocking of authority. We see all of these characteristics in Thenardier across the arc of the novel.
It’s so funny that Hugo says that “practiced eyes” found spelling mistakes in Thenardier’s bills, considering the severe amount of mistakes we see in his letters later on in Paris. Did he just become a worse speller when he left Montfermeil? Or was he better able to hide it because presumably bills only really need certain words?
I get the feeling the Mme Thenardier’s view of Thenardier (at least at this moment) is partially informed by her reading of romance books. She obviously isn’t living the life she wanted, and who knows if she was this brutish before being stuck with Thenardier or not. In any case, she wants something else, and that desire is probably increased by her romance novel-reading, and she start to see Thenardier as unknowable, and as the “object of universal desire” that she gets to have and be jealous over. I wonder how much her romantic propensities blinded her, and if she might have become jaded towards Thenardier even earlier than we see in the book. By the time the Thenardiers are in Paris, that veil has definitely fallen away and Mme Thenardier is much more willing to argue with her husband.
The sheer amount of abuse that Cosette endures is laid out in only a few examples here, but I’m sure it’s much more extensive. Mme Thenardier is physically abusive in a much more “forward” way, beating Cosette and knocking her around and insulting her. Thenardier, in character, is much more sinister. He doesn’t seem to actually interact with her much, but he disallows her shoes and probably takes other things from her like food and warm clothes etc. It was probably him that decided to make her eat under the table like a dog.
“The ideal of oppression was realized in this dismal servitude.” What Cosette is going through is extreme, but she’s another Symbol here. This is how society treats women, collectively. They are made to slave away, cold and hungry, to be called names and beaten and to be denied comfort. There aren’t child labor laws in France for about another decade. Cosette is one girl, one child, but we can imagine that there are many others like her out there. And the Thenardier’s treatment of her is ideal in keeping her oppressed: physical abuse paired with neglect and psychological abuse that renders her passive, silent, and terrified. However, later we see her true personality peek through, and the way her strength carries her through all this suffering.
15 notes
·
View notes
Text
Brickclub 2.3.1, “The Problem of Water at Montfermeil.”
I have fallen so far behind but I am catching up!
Fortunately, these chapters mark a return to the plot--characters are doing things in real time, and a lot of this section can really just be read at face value. I always forget how quickly can move his story along when he wants to, but 2.3, “A Deathbed Promise is Fulfilled,” gives us a couple of short chapters of scene-setting and then plunges right in. So--with a couple exceptions, because nothing is ever entirely just what is says on the tin in this book--I’m just going to note random observations as I go, rather than try to prise out larger thematic stuff.
The water-carrier makes about 8 sous/day at a quarter-sou per bucket--so, about 32 buckets a day.
“Now, this was the terror of that poor creature the reader may not yet have forgotten, little Cosette.” I am coming to realize that anything Hugo says about his reader’s expectations is litotes at best, if not outright trolling. The reader has been saying “Yes, but WHAT ABOUT COSETTE” through the entirety of Waterloo.
The vulture with the tricolor cockade attracts Bonapartist veterans to the mountebanks’ stall--trading on the name and the trappings of Napoleon, as Thenardier also does, is the province of mountebanks.
I’m going to pull out one passage to quote at length:
"Or a miller was shouting, ‘Are we responsible for what’s in the sacks? We find countless small seeds in them that we can’t afford to spend time picking out and that just have to be left to go through the mill. There’s darnel, yellow vetchling, corncockle, vetch, hempseed, couch grass, meadow foxtail and a host of other tares, not to mention the quantity of grit in certain types of grain, particularly Breton grain. I don’t like milling Breton wheat any more than pit sawyers like to saw beams with nails in them. Imagine all the unwholesome dust that adds to the yield. And then people complain about the flour. They shouldn’t. The flour’s no fault of ours.’”
1.) I love this list of weeds.
2. ) In the next chapter, Cosette’s abuse by Mme. Thenardier is described as like being crushed by a mill--and in his first long POV section back in book 1, we were told that Valjean’s thoughts were those of a millet seed below a millstone. Between that and Valjean’s nettles speech, where weeds are people society has failed to cultivate and given up on, I smell a metaphor here. Everyone is responsible for what’s in the sacks, and no one is stepping up to keep the fields from going to weeds or the weeds from getting into the crop--just like no one is stepping up to take care of Cosette.
And then the reaper’s speech comes next: “In any case grass like that, your grass, it’s still young and very hard to cut. Being as it’s so tender, you see, it flattens before the blade.” And then in the next paragraph, we meet Cosette, so tiny she’s sitting on the crossbar of the table. Despite her rags and bare feet--and the ominous leather strap on the wall--Cosette is still young enough to bend under the sickle. She’s going to be surprisingly resilient. (Oh--and the first of the three snatches of conversation we get, which didn’t initially seem to fit, is about grapes that can’t be harvested ripe. Is this Eponine, old before her time?)
9 notes
·
View notes
Text
Brickclub 2.3.1 ‘The water question at Montfermeil’
Damn Hugo’s fantasy novel worldbuilding is good. I know this isn’t a fantasy novel (mostly) and he actually lived in this world (sort of) but STILL. This chapter in particular is such a study in building a village from the ground up.
(I’m vaguely fascinated by the green-tinged windows against the shutters of rich person’s houses--particularly by the fact that the image, if I’m picturing it right as the inner side of shutters closed over windows, is from the inside of the house. The narrator doesn’t usually ally our vision so directly with the upper class in that way.)
We get an offhand mention that almost nobody comes this way, which is such a dig at Thenardier’s business sense.
The random mention of the vulture in the traveling show with the tricolor cockade in its eye is a bizarre detail, but it does so much to show how people (or a subset of them) are starved for glimpses of the revolutionary past. The revolution and Napoleon have been crushed, but the people’s desire hasn’t gone away, though our best glimpses at the moment are pretty sordid. Given the Spanish Civil War and the way the Bourbon monarchy is starting to hit its stride, it’s no wonder.
And apparently kaleidoscopes were big in 1823, who knew?
The scene in the inn, aside from having great world-building dialogue in terms of how agricultural work was done, feels like the doppelganger of the scene in the back room of the Musain five years (!?) later. Men sit at tables drinking, and we get snippets of their talk. Sitting alone without participating is Cosette in this version, and Marius in the other. Like Waterloo versus the barricade, the Amis’ version of the scene is lovely and worth aspiring to, and it’s alternative... isn’t.
The Thenardiers’ inn is more inviting here than their haunts sometimes are, with customers actually present and Eponine and Azelma and the cat getting to play. But there’s a strap on the wall, and Cosette overworked and huddling under the table by the fire. (She’s balanced on the crosspiece of the table, which I never noticed before--it may be warmer than the floor, it’s likely less visible than the floor, and it’s a neat fit of acrobatics I'd never noticed from her. I like the image of her as having particular habits like that--it’s very later-Eponine or later-Gavroche.) And, of course, Gavroche, like the child beneath Omelas, is so utterly neglected it’s remarkable he 1) lived and 2) learned to speak, let alone became the character we meet later.
Madame T makes one of the more harrowing allusions in the novel, specifically to the question of what might motivate a person to have sex with Thenardier. Apparently, it was very cold that winter.
Which makes Gavroche more the child of the winter than of anything else, which, alas, sounds about right.
8 notes
·
View notes
Text
GPL Plugins Themes downloads updated at ♥ GPL.life ♥
GPL.life Promoting a new or updated Wordpress Premium GPL Plugin - join our Wordpress GPL Club Latest GPL Plugins and GPL Themes starting at only $5 https://gpl.life/gpl-club-updates-2019-06-17
GPL Club Updates 2019-06-17

Your WordPress GPL Club Updates
Greetings GPL Club Members,
The following WordPress Premium GPL Plugins and/or GPL Themes were updated since our last posting. Please see the listing below.
Active Members, 1st login to your account area to find your direct premium WordPress download links.
Link: ‘Click-2-Goto My Account Login Page’ area.
Our WordPress GPL Club Members Can Download:
These Discounted Bundles – Saves You More Money!
Beaver Builder Ultimate Bundle 2019-06-17
(22) Pro Addons For Elementor Ultimate Bundle 2019-06-17
Events Calendar PRO (8) Plugins Ultimate Bundle 2019-06-17
Gravity Forms and Developers Addons Package 2019-06-17
Ninja Forms Premium Extensions 2019-06-17
Restrict Content Pro & Add-ons 2019-06-17
WooCommerce Payment Gateways (52) 2019-06-17
WooCommerce Sensi Plugin and Extensions Updated 2019-06-17
WordPress Multilingual (16) Plugin Bundle 2019-06-17
WP Job Manager Premium Add-ons 2019-06-17
YITH WooCommerce Pro (114) Plugin Bundle 2019-06-17
Gravity Forms Pro (The Core Plugin) – Version 2.4.10.3
Gravity Forms Dropbox – Version 2.3.1
Gravity Forms Quiz Add-On – Version 3.1.10
iThemes BackupBuddy – Version 8.4.16.0
Modern Tribe Event Tickets Plus Addon 4.10.5.1
WooCommerce Authorize.net CIM Gateway – Version 3.0.4
WooCommerce Checkout Add-Ons – Version 2.0.4
WooCommerce SagePay Form Gateway – Version 3.14.0
WooCommerce Sensei LMS Learning Management 2.1.0
WooCommerce WorldPay 4.0.4
WordPress Multilingual Multi-Language CMS (The Core Plugin) – Version 4.2.7.1
WordPress Multilingual Multi-Language String Translation Add-On – Version 2.10.5.1
WordPress Multilingual Multi-Language Translation Management Add-On – Version 2.8.6.1
YITH WooCommerce Delivery Date Premium 2.1.0
YITH Frontend Manager for WooCommerce Premium 1.5.4
YITH WooCommerce Multi-step Checkout Premium 1.7.1
YITH WooCommerce Multi Vendor Premium 3.3.6
Past GPL Update Newsletters
See our Frequently Asked Questions
Gain access to ALL Premium WordPress Downloads – Compare Prices Here
Active Members Login to Fetch Your Downloads
Not Yet Active? Have A Look At Your Download Options
0 notes
Text
Regional Inequality in Dental Care Utilization in Japan: An Ecological Study Using the National Database of Health Insurance Claims
Abstract
Background
This study examined regional inequalities in dental care utilization in Japan and the association of dental care utilization with socioeconomic factors.
Methods
Using the Fourth National Database of Health Insurance Claims and Specific Health Checkups of Japan Open data, this ecological study analyzed 216 million pieces of aggregated data from April 2017 to March 2018. Nine indicators of dental care utilization were used: outpatient visits, outreach services, cavity fillings, pulpectomies, dental calculus removals, periodontal surgeries, tooth extractions, dental bridges, and dentures. Standardized claim ratios (SCRs) for these indicators were calculated for Japan’s 47 prefectures, which were divided into three groups based on the number of dental clinics per population, average income per capita, and the proportion of university enrollments. Associations of the dental care utilization with dental supply and regional socioeconomic factors were examined.
Findings
The ratios of maximum to minimum of SCRs were 1·4 for outpatient visits, 19·3 for outreach services, and 17·6 for periodontal surgeries. Dental supply was positively associated with outpatient visits, outreach services, dental calculus removal, and periodontal surgeries. Regional average income and educational level were positively associated with dental calculus removals, and negatively associated with pulpectomies, tooth extractions, dental bridges, and dentures.
Interpretation
In Japan, regional inequalities in dental care utilization exist for periodontal care and outreach services but are smaller for urgent and substantial dental care. Regional income and educational levels appear to have influence on dental care utilization.
Funding
Ministry of Health, Labour and Welfare of Japan (H31–19FA1001).
1. Background
Oral health inequalities still exist around the world [[1]
Kassebaum NJ
Smith AG
Bernabé E
et al.
Global, regional, and national prevalence, incidence, and disability-adjusted life years for oral conditions for 195 countries, 1990–2015: a systematic analysis for the global burden of diseases, injuries, and risk factors.]: they have been reported in the United States [2
Feng X
Sambamoorthi U
Wiener RC.
Dental workforce availability and dental services utilization in Appalachia: a geospatial analysis., 3
Mejia GC
Elani HW
Harper S
et al.
Socioeconomic status, oral health and dental disease in Australia, Canada, New Zealand and the United States., 4
Northridge ME
Kumar A
Kaur R.
Disparities in access to oral health care.], Europe [5Socioeconomic inequalities in the non-use of dental care in Europe., 6
Wamala S
Merlo J
Boström G.
Inequity in access to dental care services explains current socioeconomic disparities in oral health: the Swedish National Surveys of Public Health 2004–2005., 7
Schwendicke F
Krasowski A
Rossi JG
et al.
Dental service utilization in the very old: an insurance database analysis from northeast Germany., 8
Piotrowska DE
Jankowska D
Huzarska D
Szpak AS
Pędziński B.
Socioeconomic inequalities in use and non-use of dental services in Poland., 9Income-related inequalities in unmet dental care needs in Spain: traces left by the Great Recession.], Asia [10Inequality in unmet dental care needs among South Korean adults., 11
Limpuangthip N
Purnaveja S
Somkotra T.
Predisposing and enabling factors associated with public denture service utilization among older Thai people: a cross-sectional population-based study., 12
Rezaei S
Hajizadeh M
Irandoost SF
Salimi Y.
Socioeconomic inequality in dental care utilization in Iran: a decomposition approach.], Oceania [[3]
Mejia GC
Elani HW
Harper S
et al.
Socioeconomic status, oral health and dental disease in Australia, Canada, New Zealand and the United States.], and other countries and regions [[13]
Monteiro CN
Beenackers MA
Goldbaum M
et al.
Socioeconomic inequalities in dental health services in Sao Paulo, Brazil, 2003–2008.]. These reports highlight the fact that inequalities in oral health and dental care have been neglected worldwide [[14]
Watt RG
Daly B
Allison P
et al.
Ending the neglect of global oral health: time for radical action.]. Previous studies, including those mentioned above, have identified socioeconomic factors such as income and education and the number of dentists, and others as the causes of such inequalities [[15]
Reda SF
Reda SM
Thomson WM
Schwendicke F.
Inequality in utilization of dental services: a systematic review and meta-analysis.]. In the Global Goals for Oral Health 2020, the World Health Organization aimed to reduce oral health inequalities among different socioeconomic groups within countries and inequalities in oral health across countries [[16]
Peres MA
Macpherson LM
Weyant RJ
et al.
Oral diseases: a global public health challenge.]. The former goal is consistent with the Second Phase of the Healthy Japan 21 plan that was published in 2013, in which the Japanese government acknowledged regional and social inequalities in dental and oral health and emphasized the need for health promotion policies to reduce these inequalities [[17]Ministerial notification no. 430 of the Ministry of Health, Labour and Welfare.].In Japan, previous studies have examined the associations of inequalities in dental visits, number of treated teeth and missing teeth, and dental prosthesis use with socioeconomic factors by analyzing health survey data or healthcare insurance claims data in one region. These studies revealed a linear association between income level and dental visits [[18]Income effects on medical care visits by health insurance association insured persons (in Japanese).,[19]
Nishide A
Fujita M
Sato Y
Nagashima K
Takahashi S
Hata A.
Income-related inequalities in access to dental care services in Japan.]. Additionally, lower-income groups are less likely to use dental prostheses than are higher-income groups [[20]
Matsuyama Y
Aida J
Takeuchi K
et al.
Inequalities of dental prosthesis use under universal healthcare insurance.]. A previous study showed that individuals with fewer years of education had a higher number of treated teeth and a lower number of remaining teeth as compared to their counterparts [[21]
Ueno M
Ohara S
Inoue M
Tsugane S
Kawaguchi Y.
Association between education level and dentition status in Japanese adults: Japan public health center-based oral health study.]. These Japanese results are consistent with those in other Organisation for Economic Co-operation and Development (OECD)-member countries [[3]
Mejia GC
Elani HW
Harper S
et al.
Socioeconomic status, oral health and dental disease in Australia, Canada, New Zealand and the United States.,[8]
Piotrowska DE
Jankowska D
Huzarska D
Szpak AS
Pędziński B.
Socioeconomic inequalities in use and non-use of dental services in Poland.]. The studies mentioned above are, however, small-scale studies conducted in one region. To the best of the authors’ knowledge, no national-level analysis regarding regional inequality in dental care utilization has been conducted in Japan, mainly owing to challenges in data collection. Understanding the current status of regional inequality in dental care utilization at the national level is necessary for planning future dental and oral health policies in Japan. This study, for the first time, examined regional inequality in dental care utilization in Japan using a national-level healthcare claims dataset recently made available to the public. This study also examined the associations of dental care utilization and dental care supply with socioeconomic factors, such as economic and educational levels, in each region.
2. Methods
2.1 Dental care supply system in Japan
In Japan, the universal public healthcare insurance system covers both medical and dental care. Treatment of dental caries, periodontal disease, and oral surgery and provision of dental prostheses are covered by insurance with a 30% copayment for adults younger than 75 years and 10–20% for adults older than 75 years [[22]
Ikegami N
Yoo B-K
Hashimoto H
et al.
Japanese universal health coverage: evolution, achievements, and challenges.]. Dental care services for the total population are provided by approximately 100,500 dentists at 68,500 dental facilities. In 2017, the total public dental expenditure was approximately 26·5 billion USD (i.e., 2·9 trillion JPY at the 2017 exchange rate) [[23]Internal Revenue Service Yearly average currency exchange rates.]; therefore, expenditure per capita on dental care was approximately 209 USD (23,000 JPY). This figure accounted for 6·9% of total healthcare expenditures [[24]
Zaitsu T
Saito T
Kawaguchi Y.
The oral healthcare system in Japan.]. The number of dentists per 100,000 people was 79·6 in 2017, ranking Japan ninth among 28 OECD countries [[25]OECD Stat Health Care Resources 2017.] and ensuring an adequate dental service supply system.
2.2 Study design
An ecological study design at the prefectural level was adopted. The annual data (April 2017–March 2018) of dental care practices, aggregated at the prefectural level from dental care claims of public medical insurance for nearly the entire Japanese population, was used to examine regional differences in access to dental care and treatment. Additionally, the influence of the supply of dental care (number of dental clinics per 100,000 population) and socioeconomic factors (average income and university enrollment rate) in the prefectures were examined. Forty-seven prefectures in the administrative regions of Japan were divided into three groups according to the supply of dental care in the region (the number of dental clinics per 100,000 population) or socioeconomic factors (the average income per person and the proportion of university or college enrollment) to examine national differences in access to dental services and treatment.
2.3 Data sources
2.3.1 Demographics, dental supply, and socioeconomic data
As regional factors for the utilization of dental care, the number of dental clinics per 100,000 population, which indicates the supply of dental care, and the average income and college enrollment rate, which indicate socioeconomic factors, were studied in each prefecture in Japan, with reference to previous literature. To calculate these regional factors, the official data of the population, the number of dental clinics, the average income per person, and the proportion of universities or colleges (including junior colleges, that is, 2- or 3-year programs) in each prefecture were used.
The following datasets were also used: Vital Statistics in 2017 [[26]Japanese Ministry of Health, Labour and Welfare
Vital statistics in 2017.] for population data, Survey of Medical Institutions in 2017 [[27]Japanese Ministry of Health, Labour and Welfare
Survey of medical institutions in 2017.] for the number of dental clinics, ESRI Statistics Annual Report on Prefectural Accounts for average income [[28]Japanese Cabinet Office
ESRI Statistics Annual Report on Prefectural Accounts.], and School Basic Survey in 2017 [[29]Japanese Ministry of Health, Labour and Welfare
School basic survey in 2017.] for the proportion of universities or colleges.
2.3.2 Health data
The Fourth National Database of Health Insurance Claims and Specific Health Checkups of Japan (NDB) Open data [[30]
Itoh H
Saito T
Nojiri S
Hiratsuka Y
Yokoyama K.
National burden of the pharmaceutical cost of wet compresses and its cost predictors: nationwide cross-sectional study in Japan.,[31]
Katano H
Ozeki N
Kohno Y
et al.
Trends in arthroplasty in Japan by a complete survey, 2014–2017.], which contain information on medical claims over the course of one year (April 2017 to March 2018) for nearly the entire population (approximately 126·2 million people) of Japan was used. The dental treatment codes on 216 million medical claims for dental treatment, excluding hospitalization treatment, were analyzed using data aggregated at the prefectural level. Since 2009, the Japanese Ministry of Health, Labour and Welfare has promoted the development of the NDB, and it aggregates all medical, dental, and pharmaceutical claims (covered primary, secondary, and tertiary care). Since 2016, the main aggregated data from the NDB have been published online as NDB Open Data. The NDB includes virtually all relevant information, such as patients’ sex and age, inpatient and outpatient appointments, diagnoses, medical/dental treatments, procedures, and prescribed medications provided through healthcare insurance.
2.4 Dental care indicators
The nine chosen indicators representing dental care utilization are as follows: outpatient visits, outreach services (dental care at home or in a nursing home for people who have difficulty visiting a dental clinic, such as older people receiving nursing care) representing access to dental services, cavity fillings, pulpectomies representing caries treatments, dental calculus removal, periodontal surgeries representing periodontal treatments, tooth extractions (with the exception of deciduous or impacted teeth) representing terminal treatment of teeth, dental bridges, and dentures representing occlusal restorative treatments (see Supplementary Table 2 for more details).
Table 1Standardized claim ratios of the nine indicators representing dental care utilizations
2.5 Standardized claim ratio (SCR)
Each indicator was standardized using an indirect method stratified by age, and sex, as described below. The standardized claim ratios (SCRs) of the nine indicators were then calculated in each of the 47 prefectures.
As an index to show the level of a target prefecture of the medical claims relative to the whole Japan, standardized claim ratio (SCR) has been developed32 as adjusting both sex ratio and age distribution, which was defined as:
Standardizedclaimratio(SCR)=ObservednumberofclaimsExpectednumberofclaims×100
Here observed claims are the total number of claims in a target prefecture in a year, and expected claims are the number of claims in a year if the situation of submitting claims (sex and age specific claims rate) of whole Japan was assumed for the population in the target prefecture. Expected number of claims is calculated as,
Expectednumberofclaims=∑sex,ageagegroups(populationofasexandagegroupinatargetprefecture×sexandagespecificclaimrateofthesexandagegroupinwholeJapan)
where the standard population of 2017 is applied for whole Japan, and sex- and age-specific groups were the total 2 × 18=36 groups of the combinations of (males, females) × (0-4,5-9,….,85 and over). Here, sex- and age- specific claim rate is, sex- and age- specific claim rate = (total claims for each sex and age group in a year) / (population for the sex and age group in a year).
The SCR is an index of the level of dental care utilization relative to whole Japan (100 for whole Japan) adjusted by sex ratio and age distribution of target prefecture with indirect method, which is similar to standardized mortality ratio.
SCR of 100 indicates the number of sex- and age- adjusted claims in a prefecture are equal to the whole Japan, which means the prefecture is the same level as the whole Japan for dental care utilization. SCR of higher(smaller) than 100 means the more(less) frequent level in dental care utilization relative to whole Japan.
The SCR can provide an objective and relative understanding of the nationwide status of medical care provision in Japan, and it can also be used to compare the status of medical care provision among regions. Therefore, it is used in research on regional differences in medical care [[32]
Murakami G
Muramatsu K
Hayashida K
Fijimori K
Matsuda S.
Ecological analysis of factors associated with mortality of cerebral infarction in Japan.]. Additionally, since it can be quickly calculated from the aggregated data, it is also used as an indicator for policymakers of national and prefectural governments to formulate medical plans.
As seen in the definition of SCR, the easiness to access to dental clinics (the concentration of dental clinics) is not adjusted. So, for examining regional difference in dental supply. we defined the supply-adjusted SCR (supply-adjusted SCR) as, supply adjusted SCR in a target prefecture = SCR / the number of dental clinics per 100,000 population
2.7 Statistical analysis
Dental care supply (i.e., the number of dental clinics per 100,000 population) and socioeconomic factors (economic level: average income per capita, educational level: the proportion of university enrollments) were configured to show regional inequality (differences) in Japan.
Regional differences in dental care utilization (outpatient visits, outreach services, cavity fillings, pulpectomies, dental calculus removals, periodontal surgeries, tooth extractions, dental bridges, dentures) were configured and tabulated using SCR.
We divided the 47 prefectures into three groups by tertile based on the number of dental clinics per 100,000 population, average income per person, and proportion of university or college enrollments. The associations of dental care utilization (nine SCRs) with dental care supply were then explored by the differences among the three groups (a) the number of dental clinics. Next, the associations of dental care utilization (nine supply-adjusted standardized claim ratios) with socioeconomic factors (economic or educational) were explored among the three groups based on (b) average income per person and (c) the proportion of university or college enrollments (Figures 1b and 1c, Supplementary Table 1).
Figure 1(a) Map of 47 prefectures categorized into three groups based on the number of dental clinics per 100,000 population
Show full caption
(b) Map of 47 prefectures categorized into three groups based on the average income per person
(c) Map of 47 prefectures categorized into three groups based on the proportion of university or college enrollment
Each difference among the three levels of groups was explored using rank statistics (Mann-Whitney test) with no adjustment for pairwise comparisons [[33]No adjustments are needed for multiple comparison.]. A two-sided p-value of less than 0·05 was considered significant. Statistical analyses were performed using Stata/16·0 (Stata-Corp LLC, 4905 Lakeway Drive, College Station, Texas 77845 USA).
2.8 Ethical considerations
This study was approved by the Research Ethics Committee of the University of Tsukuba (No. 1446). There was no direct patient involvement in this study. The NDB Open Data are anonymized medical claims data compiled and released by the Japanese Ministry of Health, Labour and Welfare; thus, the data do not identify individual patients and do not constitute personal information. Therefore, informed consent was waived.
2.9 Role of the funding source
This work was supported by a Health and Labour Sciences Research Grant from the Ministry of Health, Labour and Welfare of Japan (multidisciplinary research project on measures against lifestyle-related diseases such as cardiovascular diseases and diabetes mellitus). The research project aimed at the development of new evaluation indicators and methods for the preservation of dental and oral health: health services research to reduce health inequalities in Japan (no. H31-19FA1001, the principal investigator: Nanako Tamiya, MD). The funding source of this study had no role in study design, data collection, data analysis, data interpretation, or writing the manuscript.
3. Results
For the SCRs of the nine indicators, the median, mean, maximum, minimum, the ratios of maximum to minimum, and distribution are shown in Table 1 and Figure 2. The ratios of maximum to minimum of SCRs were 1·4 for outpatient visits and 19·3 for outreach services. For dental procedures, the ratios of maximum to minimum of SCRs were 1·5 for cavity fillings, 1·4 for pulpectomies, 3·1 for dental calculus removals, 17·6 for periodontal surgeries, 1·3 for tooth extractions, 1·7 for dental bridges, and 1·5 for dentures (see Supplementary Table 3-1 for the results in each prefecture).
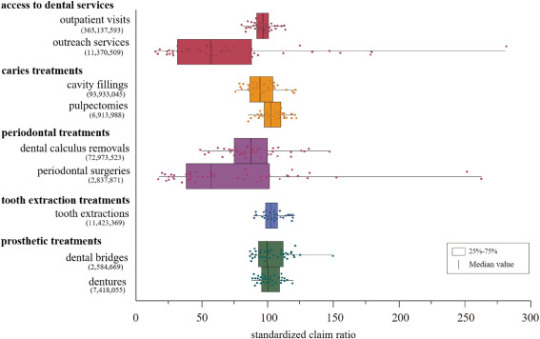
Figure 2Standardized claim ratios of the nine indicators representing dental care utilization
Show full caption
The dots indicate the following: red for access to dental services, yellow for caries treatments, purple for periodontal treatments, blue for tooth extraction treatments, and green for prosthetic treatments. Bold text represents the category of the indicators. ( ) :number of dental care records.
The mean number of dental clinics per 100,000 people of the 47 prefectures was 49·8. In the higher, medium, and lower groups, the mean values were 56·2 (range: 51·2–77·5), 49·2 (range: 47·8–50·5), and 43·6 (range: 38·0–46·8), respectively. The mean prefectural average income per resident of the 47 prefectures was approximately 26,500 USD (2·91 million JPY). In the higher, medium, and lower groups, the mean values were 30,100(range: 27,400–48,600) USD (3·31 (range: 3·01–5·35) million JPY), 26,200 (24,900–27,000) USD (2·88 (2·74–2·97) million JPY), and 23,000 (20,600–24,800) USD (2·53 (2·27–2·73) million JPY), respectively. The mean percentage of university or college education attainment of all 47 prefectures was 51·2%. In the higher, medium, and lower groups, the mean values were 58·6% (range: 54·2–66·2), 50·6% (47·2–53·1), and 44·2% (39·5–46·9), respectively (Supplementary Table 1).
The number of dental clinics per 100,000 people was positively associated with outpatient visits (pFigure 3, Supplementary Table 4-1).
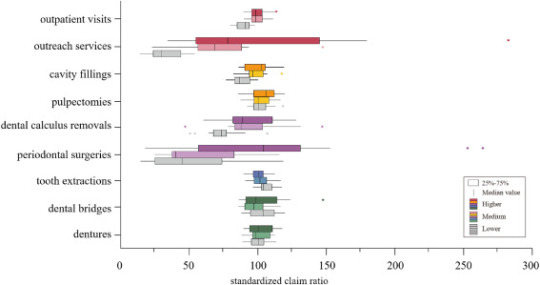
Figure 3Comparison of standardized claim ratios of dental services among the three groups based on the number of dental clinics per 100,000 population
Show full caption
The dots indicate the following: red for access to dental services, yellow for caries treatments, purple for periodontal treatments blue for tooth extraction treatments, and green for prosthetic treatments. The 47 prefectures were divided into three groups by tertile (higher: 16, medium: 15, and lower:16) according to the number of dental clinics per 100,000 population. Each difference of the standardized claim ratio based on the nine indicators among three groups of the number of dental clinics per 100,000 population was explored using rank statistics (Mann-Whitney test) without adjustment for multiple comparisons.
The average income per person was positively associated with dental calculus removals (p=0·024 L–H) but was negatively associated with pulpectomies (p=0·022 L–M), tooth extractions (p=0·033 L–M), dental bridges (p=0·018 L–M), and dentures (p=0·010 L–M, p=0·042 L–H) (Figure 4, Supplementary Table 4-2-1).
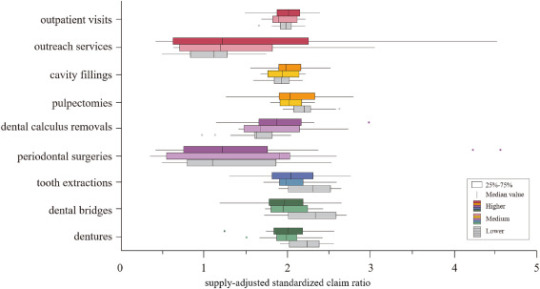
Figure 4Comparison of supply-adjusted standardized claim ratios of dental services among the three groups based on the regional average income
Show full caption
The dots indicate the following: red for access to dental services, yellow for caries treatments, purple for periodontal treatments, blue for tooth extraction treatments, and green for prosthetic treatments. The 47 prefectures were divided into three groups by tertile (higher: 16, medium: 15, and lower:16) according to regional average income. Each difference of the supply-adjusted standardized claim ratios based on the nine indicators among the three groups of regional average income was explored using rank statistics (Mann-Whitney test) without adjustment for multiple comparisons.
The proportion of university or college enrollments was positively associated with outreach services (p=0·002 L–H, p=0·004 M–H) and dental calculus removals (p=0·001 L–H, p=0·024 M–H), but was negatively associated with pulpectomies (p=0·018 L–H), tooth extractions (p=0·011 L–M, p=0·004 L–H), dental bridges (pFigure 5, Supplementary Table 4-3-1).
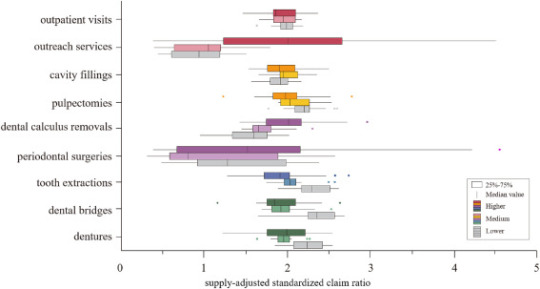
Figure 5Comparison of supply-adjusted standardized claim ratios of dental services among the three groups based on the proportion of university or college enrollment
Show full caption
The dots indicate the following: red for access to dental services, yellow for caries treatments, purple for periodontal treatments, blue for tooth extraction treatments, and green for prosthetic treatments. The 47 prefectures were divided into three groups by tertile (higher: 16, medium: 15, and lower:16) according to the proportions of university or college enrollment. Each difference of the supply-adjusted standardized claim ratios based on the nine indicators among the three groups of the proportion of university or college enrollment was explored using by rank statistics (Mann-Whitney test) without adjustment for multiple comparisons.
4. Discussion
Using the Fourth NDB Open Data, an ecological study was conducted to examine dental care utilization in Japan. Regional inequality in dental care utilization in Japan appears to be larger for outreach services and periodontal treatments and smaller for urgent and substantial dental care. When regional dental care supply was considered, regional income levels or educational levels appear to have an influence on dental care utilization.
The ratio of maximum to minimum of outpatient visits was 1·4, indicating a small regional inequality, while the ratio of maximum to minimum of SCRs of outreach services was 19·3, indicating considerable regional inequality. In Japan, outpatient dental visits decrease sharply after the age of 75 years [[34]Assessing the dental care needs of the dependent elderly and a short-term plan of the provision of home dental care in Japan (in Japanese).]. To meet the older population’s dental care needs, which have increased alongside a rapidly aging population, the government has taken measures to promote an increase in the provision of outreach services by giving dental care providers incentives in their medical fees [[35]Japanese Ministry of Health, Labour and Welfare
Revisions in the reimbursement of medical fees (dental care) for fiscal year 2016 (in Japanese).]. Future measures to promote outreach services should also consider the perspective of correcting the difference in supply between regions. Considerable inequalities in periodontal treatment were found nationwide; the ratio of maximum to minimum of SCRs of periodontal treatment were 3·1 for dental calculus removal and 17·6 for periodontal surgery. These values were higher than those of other dental treatments. Dental calculus removal, which is an initial preventive treatment against periodontal disease, is greatly influenced by geographical and socioeconomic factors [[36]
Murakami K
Aida J
Ohkubo T
Hashimoto H
Income-related inequalities in preventive and curative dental care use among working-age Japanese adults in urban areas: a cross-sectional study.]. Further, periodontal surgery is a conservative treatment for severe periodontal disease and is typically performed by periodontal disease specialists [[37]The Japanese Society of Periodontology
JSP clinical practice guideline for the periodontal treatment.]. A previous study reported regional inequalities in the number of periodontists compared to that of general dentists [[38]
Ishimaru M
Ono S
Matsui H
Yasunaga H
Koike S.
Geographic disparity in dental specialist using the national survey of physicians, dentists, and pharmacists in Japan (in Japanese).]. Periodontal surgery is often performed by periodontists and since there are regional differences in the number of periodontists, there may be regional differences depending on the supply of dental care []. Older individuals now retain more of their teeth than in the past, and the percentage of adults with periodontal disease has consequently been increasing. To respond to the expected increase in periodontal disease among older adults, it may be necessary to introduce incentives to promote the prevention and treatment of periodontal disease according to the actual situation of dental care in different regions. This can be done with reference to approaches taken in European countries, such as requiring health checkups and visits to the dental clinic at least once a year as a condition for prosthetic treatment coverage [[40]Who chooses prepaid dental care? A baseline report of a prospective observational study.], and by eliminating the uneven distribution of dentists involved in the treatment of periodontal disease.
The results show that outpatient visits, outreach services, cavity fillings, dental calculus removals, and periodontal surgeries were associated with the supply of dental care. In contrast, pulpectomies or tooth extractions to treat acute symptoms accompanying intense pain or inflammation and dental bridges or dentures to restore occlusal function were not associated with the supply of dental care. These results seem to suggest that dental care services for acute symptoms and occlusal recovery have been well established and are available across Japan.
The initial phase of dental caries treatment and periodontal treatment showed regional inequalities owing to differences in the number of dental clinics per region. Previous studies indicated that in areas with more (vs. less) medical facilities, visits for mild cases and recurrent visits are more common, as patients’ healthcare costs are lower and they have better access to services [[41]
Schulz M
Kunst AE
Brockmann H.
High educational attainment moderates the association between dental health-care supply and utilization in Europe.,[42]
Noguchi H, Shimizutani S, Masuda Y. Physician-induced demand for treatments for heart attack patients in Japan: evidence from the Tokai Acute Myocardial Study (TAMIS). ESRI Discussion paper series no. 147. June 2005: 1–25.
]. Additionally, in such areas, there is more physician-induced demand as a result of competition and information asymmetry. In areas with more dental clinics, there may potentially be excessive initial dental caries and periodontal treatments. In contrast, in areas with few dental clinics, dentists might spend most of their time providing first aid treatment or treating severe diseases; they might not have time to treat mild or moderate diseases.Concerning the associations between the indicators of dental care utilization with regional socioeconomic factors (i.e., average income per capita) and the proportion of university enrollments, in lower areas, initial or preventive treatments such as dental calculus removals were lower, and urgent or substantial treatments such as pulpectomies and tooth extractions were higher. These results are consistent with those of a previous study in which groups with higher levels of income had higher preventive dental care [[36]
Murakami K
Aida J
Ohkubo T
Hashimoto H
Income-related inequalities in preventive and curative dental care use among working-age Japanese adults in urban areas: a cross-sectional study.], groups with higher levels of education had higher preventive dental care, and groups with lower levels of education had more extractions [[21]
Ueno M
Ohara S
Inoue M
Tsugane S
Kawaguchi Y.
Association between education level and dentition status in Japanese adults: Japan public health center-based oral health study.]. In contrast, this study showed a greater use of dental bridges or dentures in lower-income areas as compared to higher-income areas. These results were inconsistent with a previous study [[20]
Matsuyama Y
Aida J
Takeuchi K
et al.
Inequalities of dental prosthesis use under universal healthcare insurance.]. Several reasons can be considered. First, this study only included prosthetic treatments covered by universal healthcare insurance and not those outside of it such as ceramic bridges, metal dentures, and dental implants. Therefore, the prosthetic treatments not covered by universal healthcare insurance for typical high-income patients may have been underestimated. Second, this study was based on the data of those who received dental care, while the previous study was based on a questionnaire survey of older adult residents in the community [[20]
Matsuyama Y
Aida J
Takeuchi K
et al.
Inequalities of dental prosthesis use under universal healthcare insurance.]. The previous study showed that 30% of older adults with 19 or fewer teeth did not use dental bridges or dentures, indicating an unmet need for dental care among those who did not visit dental clinics. Finally, this was an ecological study, whereas the previous study was performed on an individual basis. Prosthetic treatments were significantly more often provided in areas with lower income levels. This suggests that the need for occlusal restorative treatment may be higher in low-income areas [[43]
Tashiro A
Aida J
Shobugawa Y
et al.
Association between income inequality and dental status in Japanese older adults:Analysis of data from JAGES2013.] and that, under Japan’s universal healthcare system, occlusal restorative treatment is provided even in low-income areas.
These findings suggest that access to preventive dental care may be limited in the lower income or educational areas, and thus there may be fewer dentist visits for early-stage treatments such as dental calculus removal. In these areas, dental diseases may have already reached an advanced stage by the time the patient visits a dental clinic. As a result, tooth preservation becomes more difficult or even impossible, requiring subsequent occlusal rehabilitation. The tendency to visit a dental clinic after an advanced illness was observed in areas with lower average income levels or lower educational levels after adjusting for the number of dental clinics in each region.
This study has several limitations. First, as this is an ecological study, the results might not be suitable for extrapolation to an individual level owing to the risk of ecological fallacy. Second, since the NDB data were a collection of requests for reimbursement of medical fees paid for medical services provided through universal healthcare insurance, the data do not include treatments such as dental implants, ceramic bridges, or orthodontic treatments, as these are excluded from the insurance coverage. Thus, dental prosthetic treatment was likely to have been underestimated in urban areas where medical treatments not covered by insurance are performed more often. Third, the differences in oral health (e.g., number of remaining teeth) and the relative incidences of oral diseases in the regions were not considered. The number of remaining teeth in members of a community may be affected by the frequency of prosthetic treatments, and the percentage of edentulous people may affect the practice of periodontal disease treatment. Fourth, the validation of the data published by the NDB is ongoing [[44]Current status and issues of the national database.]. In recent years, research focusing on validation in medical and pharmacy claims has been conducted on data published using the NDB [[45]
Sato I
Yagata H
Ohashi Y.
The accuracy of Japanese claims data in identifying breast cancer cases.,[46]
Iwagami M
Aoki K
Akazawa M
et al.
Task force report on the validation of diagnosis codes and other outcome definitions in the Japanese receipt data.]. Thus, the validity of the published dental claims data needs to be verified in the future.
Despite these limitations, this study has a notable strength: It is the first national-level study to clarify regional inequality in dental care utilization including caries treatments, periodontal treatments, extractions, and prosthodontic treatments in Japan using NDB Open Data, which comprises comprehensive health insurance claims for nearly the entire population. Additionally, the associations between inequalities in dental care utilization with regional dental care supply and socioeconomic factors were examined. This study is a first important step in demonstrating regional inequalities in dental care utilization in Japan; thus, such inequalities can be appropriately addressed.
Declaration of Competing Interest
Takahiro Mori’s appointment as an associate professor at the University of Tsukuba was sponsored by JMDC Inc. in the financial year 2018 (i.e., April 2018–March 2019), by SMS CO., LTD. in the financial year 2019 (i.e., April 2019–March 2020), and by FAST DOCTOR CO., LTD in the financial year 2020 (i.e., April 2020–March 2021). JMDC Inc., SMS CO., LTD, and FAST DOCTOR CO., LTD did not play any role in the conception, designing, conducting, or reporting of this study.
Sakata Nobuo’s appointment as an associate professor at the University of Tsukuba was sponsored by JMDC Inc. in the financial year 2020 (i.e., April 2020–present). JMDC Inc. did not play any role in the conception, design, conduct, or reporting of this study.
The other authors declare that they have no competing interests.
source https://livehealthynews.com/regional-inequality-in-dental-care-utilization-in-japan-an-ecological-study-using-the-national-database-of-health-insurance-claims/
0 notes
Text

#my posts#les mis#les miserables#victor hugo#lascelles wraxall#wraxall translation#lynd ward#lm 2.3.1
13 notes
·
View notes
Text
Global E-learning Software Market 2018 – Industry Trend, Research, Insights and Forecast 2025
10-dec-2018 In 2017, the global E-learning Software market size was million US$ and it is expected to reach million US$ by the end of 2025, with a CAGR of during 2018-2025.
This report focuses on the global E-learning Software status, future forecast, growth opportunity, key market and key players. The study objectives are to present the E-learning Software development in United States, Europe and China.
The key players covered in this study
• IBM
• SAP
• Net Dimensions
• Citrix
• Upside learning
• Litmos
• iSpring Solutions
• Versal
• Docebo
• Absorb
• Traineaze
• Mindflash Technologies
• SkyPrep
• Accord LMS
• Adobe
• Configio
Market segment by Type, the product can be split into
• Mobile Content Authoring
• E-books
• Portable LMS
• Mobile and Video-based Courseware
• Interactive Assessments
• Content Development
• M-Enablement
Request a Sample Copy of This Report: https://www.radiantinsights.com/research/global-e-learning-software-market-size-status-and-forecast-2018-2025/request-sample
Market segment by Application, split into
• BFSI
• Healthcare
• Government
• Professional Services
• Telecom and IT
• Other
Market segment by Regions/Countries, this report covers
• United States
• Europe
• China
• Japan
• Southeast Asia
• India
• Central & South America
The study objectives of this report are:
• To analyze global E-learning Software status, future forecast, growth opportunity, key market and key players.
• To present the E-learning Software development in United States, Europe and China.
• To strategically profile the key players and comprehensively analyze their development plan and strategies.
• To define, describe and forecast the market by product type, market and key regions.
In this study, the years considered to estimate the market size of E-learning Software are as follows:
• History Year: 2013-2017
• Base Year: 2017
• Estimated Year: 2018
• Forecast Year 2018 to
Table of Contents
1 Report Overview
1.1 Study Scope
1.2 Key Market Segments
1.3 Players Covered
1.4 Market Analysis by Type
1.4.1 Global E-learning Software Market Size Growth Rate by Type (2013-2025)
1.4.2 Mobile Content Authoring
1.4.3 E-books
1.4.4 Portable LMS
1.4.5 Mobile and Video-based Courseware
1.4.6 Interactive Assessments
1.4.7 Content Development
1.4.8 M-Enablement
1.5 Market by Application
1.5.1 Global E-learning Software Market Share by Application (2013-2025)
1.5.2 BFSI
1.5.3 Healthcare
1.5.4 Government
1.5.5 Professional Services
1.5.6 Telecom and IT
1.5.7 Other
1.6 Study Objectives
1.7 Years Considered
2 Global Growth Trends
2.1 E-learning Software Market Size
2.2 E-learning Software Growth Trends by Regions
2.2.1 E-learning Software Market Size by Regions (2013-2025)
2.2.2 E-learning Software Market Share by Regions (2013-2018)
2.3 Industry Trends
2.3.1 Market Top Trends
2.3.2 Market Drivers
2.3.3 Market Opportunities
Browse Full Research Report With TOC: https://www.radiantinsights.com/research/global-e-learning-software-market-size-status-and-forecast-2018-2025
3 Market Share by Key Players
3.1 E-learning Software Market Size by Manufacturers
3.1.1 Global E-learning Software Revenue by Manufacturers (2013-2018)
3.1.2 Global E-learning Software Revenue Market Share by Manufacturers (2013-2018)
3.1.3 Global E-learning Software Market Concentration Ratio (CR5 and HHI)
3.2 E-learning Software Key Players Head office and Area Served
3.3 Key Players E-learning Software Product/Solution/Service
3.4 Date of Enter into E-learning Software Market
3.5 Mergers & Acquisitions, Expansion Plans
For the data information by region, company, type and application, 2017 is considered as the base year. Whenever data information was unavailable for the base year, the prior year has been considered.
0 notes
Text
Brick Club 2.3.1 “The Water Question At Montfermeil”
I feel like I’m reading the opening pan over a village from a Disney movie or something with this chapter.
How often would players come to Montfermeil? It’s not very far away from Paris. I’m just wondering if this is an unusual occasion. The unusual arrival of the players as a sort of herald to the unusual arrival of Valjean would make sense.
Hugo calls the vulture he’s talking about the Crested Caracara, but if it’s a vulture with a tricolor eye, he probably means a King Vulture.
Cosette is seven? eight? and is knitting socks for the Thenardier children and fetching water. She’s still small enough to sit under the table. I always imagine her as being very tiny even when she’s grown. I read an article a month or two ago about the condition of Russian orphanages in the 80s and 90s, and it mentioned how the children there were 13 years old but looked like 5 years younger because they were so small and malnourished. I always kind of imagine Cosette like that as a child, and then she stays tiny even when she grows up.
We hear Gavroche but are not introduced to him. He’s three, a winter child, ignored and unloved and uncared for. Gavroche and Cosette are like two different paths of surviving the trauma of childhood abuse and abandonment. Cosette essentially forgets or represses it once she is in Valjean’s care. Gavroche learns from it and learns to survive until he’s able to get out and be independent on the streets.
Eponine and Azelma are stuck in their situation because of their attachment to their parents, but by dint of being unloved, Gavroche is able to escape it into something that is a situation he’s able to survive better in. It always makes me wonder what Gavroche would have been like had he stayed with the Thenardiers, and what he would have been like if he hadn’t but had survived. If he stayed, would he have ended up like Montparnasse? Hard-hearted and obsessed with appearance and willing to murder? Certainly it seems he would have been more miserable if he’d stayed with his parents. If he had survived the barricade, would he have lived on the streets until he was an adult and...then what?
Anyway, I’m getting ahead of myself and Hugo in the narrative.
9 notes
·
View notes
Text
*4. Interwined With Nature

❤ Shape: {Baby Bug’s Shapes} - Bailey Shape MP
❤ Head: *TD* Baby Mesh Head #Bento - MOON MP
❤ Body: Bad Seed Bebe Body V 2.3.1 MP
❤ Eyes: ToddleeDoo - Essential Eyes Pack MP
❤ Skin: { Clair de Lune } Amalthea Skin LM
❤ Freckles: Ohai. Cute Freckles MP
❤ Hair: [^.^Ayashi^.^] Dassy hair LM
❤ Dress: {Ribbons} Cooki Dress - Pink for TD and BEBE LM
❤ Shoes: [M] Anabelle Shoes - Tea Cake MP
❤ Hairbows: *Chantilly Lace Boutique* Shirley MP
❤ Poses : [Expressive Poses] - Moa FREE (Bento Pose) MP
0 notes
Text
Smart Education and Learning Market by Hardware (IWB & SBL), Software (LMS/LCMS, ERP, Test & Assessment, Mobile Education Apps), Educational Content (Audio & Video Courseware, E-Textbooks), Learnin...
Over the past few years, the market for smart education has developed and adopted the latest technology due to an increasing demand from K-12 and higher education institutions. This market involves the recent implementation of innovative hardware, software and services, and educational content to cr
Sahil Sharma's insight:
Over the past few years, the market for smart education has developed and adopted the latest technology due to an increasing demand from K-12 and higher education institutions. This market involves the recent implementation of innovative hardware, software and services, and educational content to create an innovative learning environment. The smart education & learning market in this report is defined as the summation of education products, applications, and learning modes.
The smart education & learning market identifies the latest patterns and technologies that are vital for any institute across the globe. This market is still in the growth stage, as K-12 schools and higher education institutions across all regions are not very receptive towards the latest technological changes. The report analyzes the importance of technology in education and the impact on students and other educational constituents in the long run.
Mobility in education is fundamentally changing for content providers. Many institutions lack proper adoption of software and hardware systems due to the privacy and security issues related to them. It is estimated that the use of technology to its fullest potential would take a few years. The advent of mobile technology has given rise to innovative learning modes such as simulation-based learning and social learning.
Download FREE Sample of this Report @ https://www.grandresearchstore.com/report-sample/smart-education-and-learning-market-by-hardware-iwb-26-sbl-software-lms2Flcms-erp-test-26-assessment-mobile-education-apps-educational-content-audio-26-video-courseware-e-textbooks-learning-modes-user-type-26-region---global-forecast-to-2020
The major restraints in this market are the lack of digital fluency among educational institutions and competition from new models of education.
There are various assumptions that have been taken into consideration for the market sizing and forecasting exercise. A few of the global assumptions include political, economic, social, technological, and economic factors. For instance, exchange rates are expected to have a moderate rating of impact on this market. Therefore, the dollar fluctuations are not expected to seriously affect the forecast in the emerging Asia-Pacific (APAC) regions.
The report will help the market leaders/new entrants in this market in the following ways:
1. This report segments the market into products, application market, and learning modes covering this market comprehensively. The report provides the closest approximations of the revenue numbers for the overall market and the sub-segments. The market numbers are further split across different users and regions.
2. This report will help them better understand the competitors and gain more insights to better position ones business. There is a separate section on competitive landscape, including end user analysis, mergers and acquisition and venture capital funding. Besides this, there are company profiles of the ten major players in this market. In this section, market internals are provided that can help place oneâÂÂs company ahead of the competitors.
3. The report helps them understand the pulse of the market. The report provides information on the key market drivers, restraints, challenges, and opportunities.
Get the Complete Report & TOC @ https://www.grandresearchstore.com/ict-and-media/smart-education-and-learning-market-by-hardware-iwb-26-sbl-software-lms2Flcms-erp-test-26-assessment-mobile-education-apps-educational-content-audio-26-video-courseware-e-textbooks-learning-modes-user-type-26-region---global-forecast-to-2020
Table of content
1 INTRODUCTION 15
1.1 OBJECTIVES OF THE STUDY 15
1.2 MARKET DEFINITION 15
1.3 MARKET SCOPE 16
1.3.1 MARKETS COVERED 17
1.3.2 YEARS CONSIDERED FOR THE STUDY 17
1.4 CURRENCY 18
1.5 STAKEHOLDERS 18
2 RESEARCH METHODOLOGY 19
2.1 MARKET SIZE ESTIMATION 20
2.2 MARKET BREAKDOWN AND DATA TRIANGULATION 23
2.3 MARKET SHARE ESTIMATION 24
2.3.1 KEY DATA FROM SECONDARY SOURCES 24
2.3.2 KEY DATA FROM PRIMARY SOURCES 25
2.4 ASSUMPTIONS 26
2.4.1.1 Key industry insights 27
3 EXECUTIVE SUMMARY 28
4 PREMIUM INSIGHTS 33
4.1 ATTRACTIVE MARKET OPPORTUNITIES IN SMART EDUCATION AND LEARNING MARKET 33
4.2 SMART EDUCATION AND LEARNING MARKET: TOP THREE LEARNING MODES 34
4.3 GLOBAL SMART EDUCATION AND LEARNING MARKET 35
4.4 SMART EDUCATION AND LEARNING MARKET POTENTIAL 35
4.5 SMART EDUCATION AND LEARNING MARKET, BY USER TYPE 36
Key questions answered in this report:
What will the SMART EDUCATION AND LEARNING the growth rate be in 2025?
What are the key factors driving the Global SMART EDUCATION AND LEARNING with a focus on the Chinese market?
What are the key market trends impacting the growth of the Global SMART EDUCATION AND LEARNING market?
What are the challenges to Global SMART EDUCATION AND LEARNING market growth?
What are the market opportunities and threats faced by the vendors in the Global SMART EDUCATION AND LEARNING market industry?
What are the key outcomes of the five forces analysis of SMART EDUCATION AND LEARNING?
If You Have Any Question Related To This Report Contact Us @ https://www.grandresearchstore.com/enquire-now/smart-education-and-learning-market-by-hardware-iwb-26-sbl-software-lms2Flcms-erp-test-26-assessment-mobile-education-apps-educational-content-audio-26-video-courseware-e-textbooks-learning-modes-user-type-26-region---global-forecast-to-2020
What our report offers:
Strategic suggestions and proposals for the beginners to understand Assessments of the market share from different countries and regions were conducted Top key market players, market share analysis included.
The market observations such as constraints, drivers, threats, opportunities, investment opportunities, challenges, and recommendations are added.
The competitive landscaping mappings of the ongoing trends are discussed. Based on the market estimations, the strategic recommendations are made in the business segments The competitive landscaping mappings of the current trends are detailed. Various companies detailed profiles are included.
The latest technology advancements are mapped with the trends of the supply chain. The analysis of competitiveness between different markets players are added to provide
CONTACT US:
276 5th Avenue, New York, NY 10001, United States
International: +1(212)-6344884 / +1(646)-7817170
Fax: +1(212)-6344885
Email: [email protected]
Follow Us On linkedin :- www.linkedin.com/company/grand-research-store
0 notes
Text
Corded Work Light Market Development Factors and Investment Analysis by Leading Manufacturers| SCANGRIP, Bayco Products, Streamlight
”

Los Angeles, United State: QY Research has evaluated the global Corded Work Light market in its latest research report. The research study is a compilation of brilliant, thorough, and accurate analyses on different areas of the global Corded Work Light market. The researchers have made it a point to explore hidden growth opportunities and pin-point key strategies of prominent players and the successes achieved with their implementation. The segmentation study provided in the report helps players to understand the growth trajectory of all-important segments of the global Corded Work Light market. The highly detailed cost analysis, sales study, and pricing structure analysis offered in the report will help players to make some powerful moves in the global Corded Work Light market.
Get Full PDF Sample Copy of Report: (Including Full TOC, List of Tables & Figures, Chart) https://www.qyresearch.com/sample-form/form/3278886/global-corded-work-light-market
Buyers of the report will be equipped with exhaustive analysis of the competitive landscape and powerful insights into the nature of competition to secure a position of strength in the global Corded Work Light market. Apart from analyzing the international and regional growth of leading players of the global Corded Work Light market, the researchers have shed light on their market share, sales growth, production areas, key markets, capacity, and revenue. The analysts have specially focused on the nature and characteristics of the competitive landscape and changes expected in the next few years.
Key Players Mentioned in the Global Corded Work Light Market Research Report: SCANGRIP, Bayco Products, Streamlight, Makita, Stanley Black & Decker, BRENNENSTUHL, Snap-on Incorporated, SONLUX, Philips, Luceco, METABO, BOSCH, PANASONIC, Lena Lighting S.A., FSL, EZRED, Ericson Manufacturing, WORX
Global Corded Work Light Market by Type: Below 500 lm, From 500 to 2000 lm, Above 2000 lm
Global Corded Work Light Market by Application: Industrial, Constructional, Repair Shop, Others
The global Corded Work Light market has been spilt into different segments and sub-segments with the help of data triangulation and market breakdown procedures. The authors of the research study have carefully estimated the market sizes of all segments studied in the Corded Work Light report. They have also validated market figures of the segments using trustworthy sources.
The regional analysis provided in the Corded Work Light research study is an outstanding attempt made by the researchers to help players identify high-growth regions and modify their strategies according to the specific market scenarios therein. Each region is deeply analyzed with large focus on CAGR, market growth, market share, market situations, and growth forecast.
Questions Answered by the Report:
(1) How will the global Corded Work Light market perform during the forecast period? What will be the market size in terms of value and volume?
(2) Which segment will drive the global Corded Work Light market? Which regional market will show extensive growth in the future? What are the reasons?
(3) How will the Corded Work Light market dynamics change because of the impact of future market opportunities, restraints, and drivers?
(4) What are the key strategies adopted by players to sustain themselves in the global Corded Work Light market?
(5) How will these strategies influence the Corded Work Light market growth and competition?
Request for customization in Report: https://www.qyresearch.com/customize-request/form/3278886/global-corded-work-light-market
Table of Contents
1 Study Coverage
1.1 Corded Work Light Product Introduction
1.2 Market by Type
1.2.1 Global Corded Work Light Market Size Growth Rate by Type
1.2.2 Below 500 lm
1.2.3 From 500 to 2000 lm
1.2.4 Above 2000 lm
1.3 Market by Application
1.3.1 Global Corded Work Light Market Size Growth Rate by Application
1.3.2 Industrial
1.3.3 Constructional
1.3.4 Repair Shop
1.3.5 Others
1.4 Study Objectives
1.5 Years Considered
2 Global Corded Work Light Production
2.1 Global Corded Work Light Production Capacity (2016-2027)
2.2 Global Corded Work Light Production by Region: 2016 VS 2021 VS 2027
2.3 Global Corded Work Light Production by Region
2.3.1 Global Corded Work Light Historic Production by Region (2016-2021)
2.3.2 Global Corded Work Light Forecasted Production by Region (2022-2027)
2.4 North America
2.5 Europe
2.6 China
2.7 Japan
3 Global Corded Work Light Sales in Volume & Value Estimates and Forecasts
3.1 Global Corded Work Light Sales Estimates and Forecasts 2016-2027
3.2 Global Corded Work Light Revenue Estimates and Forecasts 2016-2027
3.3 Global Corded Work Light Revenue by Region: 2016 VS 2021 VS 2027
3.4 Global Top Corded Work Light Regions by Sales
3.4.1 Global Top Corded Work Light Regions by Sales (2016-2021)
3.4.2 Global Top Corded Work Light Regions by Sales (2022-2027)
3.5 Global Top Corded Work Light Regions by Revenue
3.5.1 Global Top Corded Work Light Regions by Revenue (2016-2021)
3.5.2 Global Top Corded Work Light Regions by Revenue (2022-2027)
3.6 North America
3.7 Europe
3.8 Asia-Pacific
3.9 Latin America
3.10 Middle East & Africa
4 Competition by Manufactures
4.1 Global Corded Work Light Production Capacity by Manufacturers
4.2 Global Corded Work Light Sales by Manufacturers
4.2.1 Global Top Corded Work Light Manufacturers by Sales (2016-2021)
4.2.2 Global Top Corded Work Light Manufacturers Market Share by Sales (2016-2021)
4.2.3 Global Top 10 and Top 5 Companies by Corded Work Light Sales in 2020
4.3 Global Corded Work Light Revenue by Manufacturers
4.3.1 Global Top Corded Work Light Manufacturers by Revenue (2016-2021)
4.3.2 Global Top Corded Work Light Manufacturers Market Share by Revenue (2016-2021)
4.3.3 Global Top 10 and Top 5 Companies by Corded Work Light Revenue in 2020
4.4 Global Corded Work Light Sales Price by Manufacturers
4.5 Analysis of Competitive Landscape
4.5.1 Manufacturers Market Concentration Ratio (CR5 and HHI)
4.5.2 Global Corded Work Light Market Share by Company Type (Tier 1, Tier 2, and Tier 3)
4.5.3 Global Corded Work Light Manufacturers Geographical Distribution
4.6 Mergers & Acquisitions, Expansion Plans
5 Market Size by Type
5.1 Global Corded Work Light Sales by Type
5.1.1 Global Corded Work Light Historical Sales by Type (2016-2021)
5.1.2 Global Corded Work Light Forecasted Sales by Type (2022-2027)
5.1.3 Global Corded Work Light Sales Market Share by Type (2016-2027)
5.2 Global Corded Work Light Revenue by Type
5.2.1 Global Corded Work Light Historical Revenue by Type (2016-2021)
5.2.2 Global Corded Work Light Forecasted Revenue by Type (2022-2027)
5.2.3 Global Corded Work Light Revenue Market Share by Type (2016-2027)
5.3 Global Corded Work Light Price by Type
5.3.1 Global Corded Work Light Price by Type (2016-2021)
5.3.2 Global Corded Work Light Price Forecast by Type (2022-2027)
6 Market Size by Application
6.1 Global Corded Work Light Sales by Application
6.1.1 Global Corded Work Light Historical Sales by Application (2016-2021)
6.1.2 Global Corded Work Light Forecasted Sales by Application (2022-2027)
6.1.3 Global Corded Work Light Sales Market Share by Application (2016-2027)
6.2 Global Corded Work Light Revenue by Application
6.2.1 Global Corded Work Light Historical Revenue by Application (2016-2021)
6.2.2 Global Corded Work Light Forecasted Revenue by Application (2022-2027)
6.2.3 Global Corded Work Light Revenue Market Share by Application (2016-2027)
6.3 Global Corded Work Light Price by Application
6.3.1 Global Corded Work Light Price by Application (2016-2021)
6.3.2 Global Corded Work Light Price Forecast by Application (2022-2027)
7 North America
7.1 North America Corded Work Light Market Size by Type
7.1.1 North America Corded Work Light Sales by Type (2016-2027)
7.1.2 North America Corded Work Light Revenue by Type (2016-2027)
7.2 North America Corded Work Light Market Size by Application
7.2.1 North America Corded Work Light Sales by Application (2016-2027)
7.2.2 North America Corded Work Light Revenue by Application (2016-2027)
7.3 North America Corded Work Light Sales by Country
7.3.1 North America Corded Work Light Sales by Country (2016-2027)
7.3.2 North America Corded Work Light Revenue by Country (2016-2027)
7.3.3 United States
7.3.4 Canada
8 Europe
8.1 Europe Corded Work Light Market Size by Type
8.1.1 Europe Corded Work Light Sales by Type (2016-2027)
8.1.2 Europe Corded Work Light Revenue by Type (2016-2027)
8.2 Europe Corded Work Light Market Size by Application
8.2.1 Europe Corded Work Light Sales by Application (2016-2027)
8.2.2 Europe Corded Work Light Revenue by Application (2016-2027)
8.3 Europe Corded Work Light Sales by Country
8.3.1 Europe Corded Work Light Sales by Country (2016-2027)
8.3.2 Europe Corded Work Light Revenue by Country (2016-2027)
8.3.3 Germany
8.3.4 France
8.3.5 U.K.
8.3.6 Italy
8.3.7 Russia
9 Asia Pacific
9.1 Asia Pacific Corded Work Light Market Size by Type
9.1.1 Asia Pacific Corded Work Light Sales by Type (2016-2027)
9.1.2 Asia Pacific Corded Work Light Revenue by Type (2016-2027)
9.2 Asia Pacific Corded Work Light Market Size by Application
9.2.1 Asia Pacific Corded Work Light Sales by Application (2016-2027)
9.2.2 Asia Pacific Corded Work Light Revenue by Application (2016-2027)
9.3 Asia Pacific Corded Work Light Sales by Region
9.3.1 Asia Pacific Corded Work Light Sales by Region (2016-2027)
9.3.2 Asia Pacific Corded Work Light Revenue by Region (2016-2027)
9.3.3 China
9.3.4 Japan
9.3.5 South Korea
9.3.6 India
9.3.7 Australia
9.3.8 China Taiwan
9.3.9 Indonesia
9.3.10 Thailand
9.3.11 Malaysia
10 Latin America
10.1 Latin America Corded Work Light Market Size by Type
10.1.1 Latin America Corded Work Light Sales by Type (2016-2027)
10.1.2 Latin America Corded Work Light Revenue by Type (2016-2027)
10.2 Latin America Corded Work Light Market Size by Application
10.2.1 Latin America Corded Work Light Sales by Application (2016-2027)
10.2.2 Latin America Corded Work Light Revenue by Application (2016-2027)
10.3 Latin America Corded Work Light Sales by Country
10.3.1 Latin America Corded Work Light Sales by Country (2016-2027)
10.3.2 Latin America Corded Work Light Revenue by Country (2016-2027)
10.3.3 Mexico
10.3.4 Brazil
10.3.5 Argentina
10.3.6 Colombia
11 Middle East and Africa
11.1 Middle East and Africa Corded Work Light Market Size by Type
11.1.1 Middle East and Africa Corded Work Light Sales by Type (2016-2027)
11.1.2 Middle East and Africa Corded Work Light Revenue by Type (2016-2027)
11.2 Middle East and Africa Corded Work Light Market Size by Application
11.2.1 Middle East and Africa Corded Work Light Sales by Application (2016-2027)
11.2.2 Middle East and Africa Corded Work Light Revenue by Application (2016-2027)
11.3 Middle East and Africa Corded Work Light Sales by Country
11.3.1 Middle East and Africa Corded Work Light Sales by Country (2016-2027)
11.3.2 Middle East and Africa Corded Work Light Revenue by Country (2016-2027)
11.3.3 Turkey
11.3.4 Saudi Arabia
11.3.5 UAE
12 Corporate Profiles
12.1 SCANGRIP
12.1.1 SCANGRIP Corporation Information
12.1.2 SCANGRIP Overview
12.1.3 SCANGRIP Corded Work Light Sales, Price, Revenue and Gross Margin (2016-2021)
12.1.4 SCANGRIP Corded Work Light Product Description
12.1.5 SCANGRIP Recent Developments
12.2 Bayco Products
12.2.1 Bayco Products Corporation Information
12.2.2 Bayco Products Overview
12.2.3 Bayco Products Corded Work Light Sales, Price, Revenue and Gross Margin (2016-2021)
12.2.4 Bayco Products Corded Work Light Product Description
12.2.5 Bayco Products Recent Developments
12.3 Streamlight
12.3.1 Streamlight Corporation Information
12.3.2 Streamlight Overview
12.3.3 Streamlight Corded Work Light Sales, Price, Revenue and Gross Margin (2016-2021)
12.3.4 Streamlight Corded Work Light Product Description
12.3.5 Streamlight Recent Developments
12.4 Makita
12.4.1 Makita Corporation Information
12.4.2 Makita Overview
12.4.3 Makita Corded Work Light Sales, Price, Revenue and Gross Margin (2016-2021)
12.4.4 Makita Corded Work Light Product Description
12.4.5 Makita Recent Developments
12.5 Stanley Black & Decker
12.5.1 Stanley Black & Decker Corporation Information
12.5.2 Stanley Black & Decker Overview
12.5.3 Stanley Black & Decker Corded Work Light Sales, Price, Revenue and Gross Margin (2016-2021)
12.5.4 Stanley Black & Decker Corded Work Light Product Description
12.5.5 Stanley Black & Decker Recent Developments
12.6 BRENNENSTUHL
12.6.1 BRENNENSTUHL Corporation Information
12.6.2 BRENNENSTUHL Overview
12.6.3 BRENNENSTUHL Corded Work Light Sales, Price, Revenue and Gross Margin (2016-2021)
12.6.4 BRENNENSTUHL Corded Work Light Product Description
12.6.5 BRENNENSTUHL Recent Developments
12.7 Snap-on Incorporated
12.7.1 Snap-on Incorporated Corporation Information
12.7.2 Snap-on Incorporated Overview
12.7.3 Snap-on Incorporated Corded Work Light Sales, Price, Revenue and Gross Margin (2016-2021)
12.7.4 Snap-on Incorporated Corded Work Light Product Description
12.7.5 Snap-on Incorporated Recent Developments
12.8 SONLUX
12.8.1 SONLUX Corporation Information
12.8.2 SONLUX Overview
12.8.3 SONLUX Corded Work Light Sales, Price, Revenue and Gross Margin (2016-2021)
12.8.4 SONLUX Corded Work Light Product Description
12.8.5 SONLUX Recent Developments
12.9 Philips
12.9.1 Philips Corporation Information
12.9.2 Philips Overview
12.9.3 Philips Corded Work Light Sales, Price, Revenue and Gross Margin (2016-2021)
12.9.4 Philips Corded Work Light Product Description
12.9.5 Philips Recent Developments
12.10 Luceco
12.10.1 Luceco Corporation Information
12.10.2 Luceco Overview
12.10.3 Luceco Corded Work Light Sales, Price, Revenue and Gross Margin (2016-2021)
12.10.4 Luceco Corded Work Light Product Description
12.10.5 Luceco Recent Developments
12.11 METABO
12.11.1 METABO Corporation Information
12.11.2 METABO Overview
12.11.3 METABO Corded Work Light Sales, Price, Revenue and Gross Margin (2016-2021)
12.11.4 METABO Corded Work Light Product Description
12.11.5 METABO Recent Developments
12.12 BOSCH
12.12.1 BOSCH Corporation Information
12.12.2 BOSCH Overview
12.12.3 BOSCH Corded Work Light Sales, Price, Revenue and Gross Margin (2016-2021)
12.12.4 BOSCH Corded Work Light Product Description
12.12.5 BOSCH Recent Developments
12.13 PANASONIC
12.13.1 PANASONIC Corporation Information
12.13.2 PANASONIC Overview
12.13.3 PANASONIC Corded Work Light Sales, Price, Revenue and Gross Margin (2016-2021)
12.13.4 PANASONIC Corded Work Light Product Description
12.13.5 PANASONIC Recent Developments
12.14 Lena Lighting S.A.
12.14.1 Lena Lighting S.A. Corporation Information
12.14.2 Lena Lighting S.A. Overview
12.14.3 Lena Lighting S.A. Corded Work Light Sales, Price, Revenue and Gross Margin (2016-2021)
12.14.4 Lena Lighting S.A. Corded Work Light Product Description
12.14.5 Lena Lighting S.A. Recent Developments
12.15 FSL
12.15.1 FSL Corporation Information
12.15.2 FSL Overview
12.15.3 FSL Corded Work Light Sales, Price, Revenue and Gross Margin (2016-2021)
12.15.4 FSL Corded Work Light Product Description
12.15.5 FSL Recent Developments
12.16 EZRED
12.16.1 EZRED Corporation Information
12.16.2 EZRED Overview
12.16.3 EZRED Corded Work Light Sales, Price, Revenue and Gross Margin (2016-2021)
12.16.4 EZRED Corded Work Light Product Description
12.16.5 EZRED Recent Developments
12.17 Ericson Manufacturing
12.17.1 Ericson Manufacturing Corporation Information
12.17.2 Ericson Manufacturing Overview
12.17.3 Ericson Manufacturing Corded Work Light Sales, Price, Revenue and Gross Margin (2016-2021)
12.17.4 Ericson Manufacturing Corded Work Light Product Description
12.17.5 Ericson Manufacturing Recent Developments
12.18 WORX
12.18.1 WORX Corporation Information
12.18.2 WORX Overview
12.18.3 WORX Corded Work Light Sales, Price, Revenue and Gross Margin (2016-2021)
12.18.4 WORX Corded Work Light Product Description
12.18.5 WORX Recent Developments
13 Industry Chain and Sales Channels Analysis
13.1 Corded Work Light Industry Chain Analysis
13.2 Corded Work Light Key Raw Materials
13.2.1 Key Raw Materials
13.2.2 Raw Materials Key Suppliers
13.3 Corded Work Light Production Mode & Process
13.4 Corded Work Light Sales and Marketing
13.4.1 Corded Work Light Sales Channels
13.4.2 Corded Work Light Distributors
13.5 Corded Work Light Customers
14 Market Drivers, Opportunities, Challenges and Risks Factors Analysis
14.1 Corded Work Light Industry Trends
14.2 Corded Work Light Market Drivers
14.3 Corded Work Light Market Challenges
14.4 Corded Work Light Market Restraints
15 Key Finding in The Global Corded Work Light Study
16 Appendix
16.1 Research Methodology
16.1.1 Methodology/Research Approach
16.1.2 Data Source
16.2 Author Details
16.3 Disclaimer
About Us:
QY Research established in 2007, focus on custom research, management consulting, IPO consulting, industry chain research, data base and seminar services. The company owned a large basic data base (such as National Bureau of statistics database, Customs import and export database, Industry Association Database etc), expert’s resources (included energy automotive chemical medical ICT consumer goods etc.
”
from NeighborWebSJ https://ift.tt/2UE0i66
via IFTTT
from WordPress https://ift.tt/3wZKxU3
via IFTTT
0 notes
Last Seen Blogs

bentsenmclean73
The Journaling of Mckenzie 158

killerbumblebee
The Great Unknown

wantingnothingbutskinni
Ness
{active May 2021}

rooster-writes
Hello and welcome to my writing cave

nppm-blog
Neo, Post-Progressivecore Music Thoughts