#logback
Explore tagged Tumblr posts
Visit Tumblr Blog
Explore Tumblr blogs with no restrictions, modern design and the best experience.
Last Seen Tumblr Blogs


Fun Fact
Tumblr was the first site to host the blog for President Barack Obama in 2011.
Note
heyyyyyyyy been a while since we've talked, what's new with you???
HELLO!
LIFE UPDATES TIME!!
○ Lots of babysitting! I babysit weekly and pick up extra babysitting / petsitting when I can
○ Lots of photography! I feel a lot more confident in navigating a camera and I'm enjoying photography a lot.
○ I've been helping a neglected Uromastyx named Doc Holliday recover to health in my student nat class! He's doing great now and I adore him very very dearly.
○ I was just invited to go to Vegas to compete in grappling come July?!???
○ I've been working on a cosplay!
○ I've been making more Kandi!
○ "Minecraft and Schizophrenia" by Easton Logback is BOMB philosophy
○ Lots of new characters as ALWAYS!
○ Improvement with my art, I feel!
4 notes
·
View notes
Text
Splunk is a popular choice for log analytics. I am a java developer and really love to use splunk for production analytics. I have used splunk for more than 5 years and like its simplicity. This article is a list of best practices that I have learned from good splunk books and over my splunk usage in everyday software projects. Most of the learnings are common for any software architect however it becomes important to document them for new developers. This makes our life easier in maintaining the software after it goes live in production. Almost any software becomes difficult change after its live in production. There are some many things you may need to worry about. Using these best practices while implementing splunk in your software will help you in long run. First Thing First : Keep Splunk Logs Separate Keep splunk log separate from debug / error logs. Debug logs can be verbose. Define a separate splunk logging file in your application. This will also save you on licensing cost since you will not index unwanted logs. Use Standard Logging Framework Use existing logging framework to log to splunk log files. Do not invent your own logging framework. Just ensure to keep the log file separate for splunk. I recommend using Asynchronous logger to avoid any performance issues related to too much logging. Some popular choice of logging frameworks in Java are listed below Log4j SLF4J Apache commons logging Logback Log In KEY=VALUE Format Follow Key=Value format in splunk logging - Splunk understands Key=Value format, so your fields are automatically extracted by splunk. This format is also easier to read without splunk too. You may want to follow this for all other logs too. Use Shorter KEY Names Keep the key name short - preferable size should be less than 10 characters. Though you may have plenty of disc space. Its better to keep a tap on how much you log since it may create performance problems in long run. At the same time keep them understandable. Use Enums For Keys Define a Java Enum for SplunkKeys that has Description of each key and uses name field as the splunk key. public enum SplunkKey TXID("Transaction id"); /** * Describes the purpose of field to be splunked - not logged */ private String description; SplunkKey(String description) this.description = description; public String getDescription() return description; Create A Util Class To Log In Splunk Define a SplunkAudit class in project that can do all splunk logging using easy to call methods. public class SplunkAudit private Map values = new HashMap(); private static ThreadLocal auditLocal = new ThreadLocal(); public static SplunkAudit getInstance() SplunkAudit instance = auditLocal.get(); if (instance == null) instance = new SplunkAudit(); auditLocal.set(instance); return instance; private SplunkAudit() public void add(SplunkKey key, String message) values.put(key.name(), message); public void flush() StringBuilder fullMessage = new StringBuilder(); for (Map.Entry val : values.entrySet()) fullMessage.append(val.getKey()); fullMessage.append("="); fullMessage.append(val.getValue()); fullMessage.append(" "); //log the full message now //log.info(fullMessage); Collect the Splunk Parameters (a collection of key,value pairs ) in transaction and log them at the end of transaction to avoid multiple writes. Use Async Log Writer Its recommended to use async logger for splunk logs. Async logging will perform logging in a separate thread. Below are some options Async Logger Appender for Log4j Logback Async Appender Setup Alerts Setup Splunk queries as alerts - get automatic notifications. Index GC Logs in Splunk Index Java Garbage Collection Logs separately in splunk.
The format of GC log is different and it may get mixed with your regular application logs. Therefore its better to keep it separate. Here are some tips to do GC log analytics using splunk. Log These Fields Production logs are key to debug problems in your software. Having following fields may always be useful. This list is just the minimum fields, you may add more based on your application domain. ThreadName Most important field for Java application to debug and identify multithreading related problems. Ensure every thread has a logical name in your application. This way you can differentiate threads. For example transaction threads and background threads may have different prefix in thread name. Ensure to give a unique id for each thread. Its super easy to set thread names in java. One line statement will do it. Thread.currentThread().setName(“NameOfThread-UniqueId”) Thread Count Print count of threads at any point in time in JVM. Below one liner should provide you java active thread count at any point in JVM. java.lang.Thread.activeCount() Server IP Address Logging the server IP address become essential when we are running the application on multiple servers. Most enterprise application run cluster of servers. Its important to be able to differentiate errors specific to a special server. Its easy to get IP address of current server. Below line of code should work for most places (unless the server has multiple ip addresses) InetAddress.getLocalHost().getHostAddress() Version Version of software source from version control is important field. The software keeps changing for various reasons. You need to be able to identify exact version that is currently live on production. You can include your version control details in manifest file of deployable war / ear file. This can be easily done by maven. Once the information is available in your war/ear file, it can be read in application at runtime and logged in splunk log file. API Name Every application performs some tasks. It may be called API or something else. These are the key identifier of actions. Log unique API names for each action in your application. For example API=CREATE_USER API=DELETE_USER API=RESET_PASS Transaction ID Transaction id is a unique identifier of the transaction. This need not be your database transaction id. However you need a unique identifier to be able to trace one full transaction. User ID - Unique Identifier User identification is important to debug many use cases. You may not want to log user emails or sensitive info, however you can alway log a unique identifier that represents a user in your database. Success / Failure of Transaction Ensure you log success or failure of a transaction in the splunk. This will provide you a easy trend of failures in your system. Sample field would look like TXS=S (Success transaction) TXS=F (Failed transaction) Error Code Log error codes whenever there is a failure. Error codes can uniquely identify exact scenario therefore spend time defining them in your application. Best way is to define enum of ErrorCodes like below public enum ErrorCodes INVALID_EMAIL(1); private int id; ErrorCodes(int id) this.id = id; public int getId() return id; Elapsed Time - Time Taken to Finish Transaction Log the total time take by a transaction. It will help you easily identify the transactions that are slow. Elapsed Time of Each Major Component in Transaction If you transaction is made of multiple steps, you must also include time take for each step. This can narrow down your problem to the component that is performing slow. I hope you find these tip useful. Please share with us anything missed in this page.
0 notes
Text
10 Must-Know Java Libraries for Developers
Java remains one of the most powerful and versatile programming languages in the world. Whether you are just starting your journey with Java or already a seasoned developer, mastering essential libraries can significantly improve your coding efficiency, application performance, and overall development experience. If you are considering Java as a career, knowing the right libraries can set you apart in interviews and real-world projects. In this blog we will explore 10 must-know Java libraries that every developer should have in their toolkit.

1. Apache Commons
Apache Commons is like a Swiss Army knife for Java developers. It provides reusable open-source Java software components covering everything from string manipulation to configuration management. Instead of reinventing the wheel, you can simply tap into the reliable utilities offered here.
2. Google Guava
Developed by Google engineers, Guava offers a wide range of core libraries that include collections, caching, primitives support, concurrency libraries, common annotations, string processing, and much more. If you're aiming for clean, efficient, and high-performing code, Guava is a must.
3. Jackson
Working with JSON data is unavoidable today, and Jackson is the go-to library for processing JSON in Java. It’s fast, flexible, and a breeze to integrate into projects. Whether it's parsing JSON or mapping it to Java objects, Jackson gets the job done smoothly.
4. SLF4J and Logback
Logging is a critical part of any application, and SLF4J (Simple Logging Facade for Java) combined with Logback offers a powerful logging framework. SLF4J provides a simple abstraction for various logging frameworks, and Logback is its reliable, fast, and flexible implementation.
5. Hibernate ORM
Handling database operations becomes effortless with Hibernate ORM. It maps Java classes to database tables, eliminating the need for complex JDBC code. For anyone aiming to master backend development, getting hands-on experience with Hibernate is crucial.
6. JUnit
Testing your code ensures fewer bugs and higher quality products. JUnit is the leading unit testing framework for Java developers. Writing and running repeatable tests is simple, making it an essential part of the development workflow for any serious developer.
7. Mockito
Mockito helps you create mock objects for unit tests. It’s incredibly useful when you want to test classes in isolation without dealing with external dependencies. If you're committed to writing clean and reliable code, Mockito should definitely be in your toolbox.
8. Apache Maven
Managing project dependencies manually can quickly become a nightmare. Apache Maven simplifies the build process, dependency management, and project configuration. Learning Maven is often part of the curriculum in the best Java training programs because it’s such an essential skill for developers.
9. Spring Framework
The Spring Framework is practically a requirement for modern Java developers. It supports dependency injection, aspect-oriented programming, and offers comprehensive infrastructure support for developing Java applications. If you’re planning to enroll in the best Java course, Spring is something you’ll definitely want to master.
10. Lombok
Lombok is a clever little library that reduces boilerplate code in Java classes by automatically generating getters, setters, constructors, and more using annotations. This means your code stays neat, clean, and easy to read.
Conclusion
Choosing Java as a career is a smart move given the constant demand for skilled developers across industries. But mastering the language alone isn't enough—you need to get comfortable with the libraries that real-world projects rely on. If you are serious about becoming a proficient developer, make sure you invest in the best Java training that covers not only core concepts but also practical usage of these critical libraries. Look for the best Java course that blends hands-on projects, mentorship, and real-world coding practices. With the right skills and the right tools in your toolkit, you'll be well on your way to building powerful, efficient, and modern Java applications—and securing a bright future in this rewarding career path.
0 notes
Text
Java/React Technical Project Lead
to team of Developers (React/Java) Proficient in ReactJS/Java including framework, GitHub, Git commands Develop code based….4), Spring UT: React testing library for unit testing, JESTng (v5.3), SLF4J/Logback, Quarkus, Redis, Jax-Rs, ReactJS: React… Apply Now
0 notes
Text
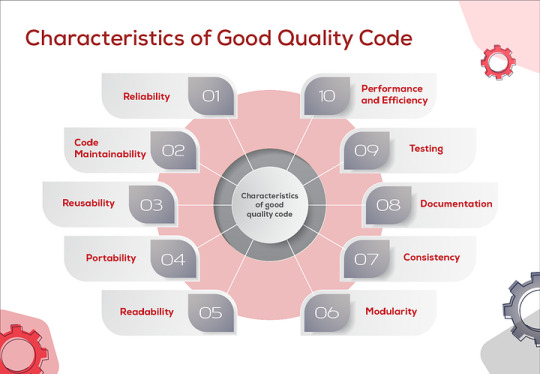
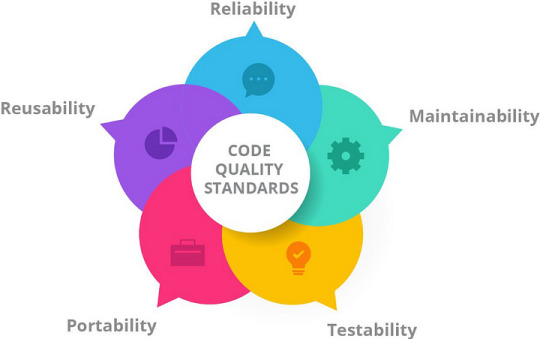
Share tips for improving code quality and maintainability.
1. Follow Java Naming Conventions
Classes: Use PascalCase for class names (e.g., EmployeeDetails).
Methods/Variables: Use camelCase for method and variable names (e.g., calculateSalary).
Constants: Use uppercase letters with underscores for constants (e.g., MAX_LENGTH).
2. Use Proper Object-Oriented Principles
Encapsulation: Make fields private and provide public getters and setters to access them.
Inheritance: Reuse code via inheritance but avoid deep inheritance hierarchies that can create tightly coupled systems.
Polymorphism: Use polymorphism to extend functionalities without changing existing code.
3. Write Clean and Readable Code
Keep Methods Small: Each method should do one thing and do it well. If a method is too long or does too much, break it down into smaller methods.
Avoid Nested Loops/Conditionals: Too many nested loops or conditionals can make code hard to read. Extract logic into separate methods or use design patterns like the Strategy or State pattern.
4. Use Design Patterns
Leverage proven design patterns like Singleton, Factory, Observer, and Strategy to solve common problems in a standardized, maintainable way.
Avoid overcomplicating things; use patterns only when they add clarity and solve a specific problem.
5. Implement Proper Error Handling
Use exceptions appropriately. Don’t overuse them, and catch only the exceptions you can handle.
Ensure that exceptions are logged for better debugging and auditing.
Use custom exceptions to represent domain-specific issues, so they are easier to debug.
6. Utilize Java’s Stream API
The Stream API (introduced in Java 8) helps reduce boilerplate code when performing collection operations like filtering, mapping, and reducing.
It makes code more concise and expressive, which helps with readability and maintainability.
7. Write Unit Tests
Use JUnit and Mockito for unit testing and mocking dependencies.
Write test cases for all critical methods and components to ensure the behavior is as expected.
Use Test-Driven Development (TDD) to ensure code correctness from the start.
8. Use Dependency Injection
Prefer Dependency Injection (DI) for managing object creation and dependencies. This decouples components and makes testing easier (using tools like Spring Framework or Guice).
DI helps to make your classes more modular and improves maintainability.
9. Avoid Code Duplication
Use methods or utility classes to avoid repeating code.
If the same logic is used in multiple places, refactor it into a single reusable method.
10. Use Annotations
Use Java annotations (like @Override, @NotNull, @Entity, etc.) to improve code clarity and reduce boilerplate code.
Annotations help to enforce business logic and constraints without having to manually check them.
11. Leverage IDE Features
Use tools like IntelliJ IDEA or Eclipse to automatically format code and identify potential issues.
Many IDEs have integrated tools for running tests, refactoring code, and applying coding standards, so make full use of these features.
12. Optimize for Performance Without Sacrificing Readability
Only optimize performance when necessary. Premature optimization can lead to complex code that’s difficult to maintain.
Profile your code to identify bottlenecks, but prioritize clarity and maintainability over micro-optimizations.
13. Implement Proper Logging
Use a logging framework like SLF4J with Logback or Log4j2 for logging. This provides a consistent logging mechanism across the application.
Ensure that logs are meaningful, providing information about the application’s state, errors, and flow, but avoid excessive logging that clutters output.
14. Document Your Code
Use JavaDocs to generate documentation for public methods and classes.
Document not just the what but also the why behind critical decisions in the codebase.
15. Keep Your Codebase Modular
Break your project into smaller, well-defined modules, and avoid large monolithic classes.
Use packages to group related classes, ensuring that each class or module has a single responsibility.
16. Use Static Analysis Tools
Integrate tools like Checkstyle, PMD, and SonarQube to enforce coding standards, detect bugs, and ensure code quality.
These tools help you identify code smells and areas where quality can be improved.
0 notes
Text
Java Logging: A Comprehensive Guide to SLF4J and Logback
====================================================== Introduction Java Logging is a crucial aspect of any software development project. Proper logging helps developers troubleshoot issues, diagnose performance problems, and understand how their applications behave. In this tutorial, we’ll explore the world of SLF4J (Simple Logging Facade for Java) and Logback, two popular logging frameworks…
0 notes
Text
Best Practices for Java Development: Navigating Common Pitfalls with Finesse
Introduction
In the ever-evolving landscape of software development, Java remains a cornerstone for building robust and scalable applications. However, even the most seasoned Java developers can find themselves ensnared in common pitfalls that compromise the quality, performance, and maintainability of their code. In this comprehensive guide, we’ll dissect these challenges and provide actionable insights to navigate the intricacies of Java development with finesse
1. Meticulous Memory Management
Misstep: Overlooking memory management can result in memory leaks and inefficient resource allocation.
Solution: Exercise diligence in memory management. Leverage tools like the Java Virtual Machine (JVM) profiler to scrutinize memory usage intricacies. Implement garbage collection judiciously to release dormant objects, optimizing overall memory efficiency.
2. Exemplary Exception Handling
Misstep: Inadequate exception handling begets erratic behaviour and compounds debugging complexities.
Solution: Institute airtight exception handling mechanisms. Discriminately catch exceptions and propagate those that elude resolution. Offer articulate error messages and systematically log exceptions for expedited troubleshooting.
3. Fastidious Performance Optimization
Misstep: Disregarding performance optimization compromises user experience and application efficiency.
Solution: Systematically profile and scrutinize code with tools like JProfiler or VisualVM. Optimize critical sections, eschew gratuitous loops, and harness caching mechanisms. Stay abreast of performance tuning best practices in the Java ecosystem.
4. Adherence to Java Updates
Misstep: Languishing on outdated Java versions exposes applications to security vulnerabilities and forfeits performance enhancements.
Solution: Maintain currency with Java releases and updates. Routinely scrutinize security patches and embrace the latest features. Employ dependency management tools like Maven or Gradle for streamlined version control.
5. Vigilant Thread Safety
Misstep: Inadequate synchronization in multithreaded applications compromises data integrity.
Solution: Espouse robust synchronization mechanisms using synchronized blocks or classes. Leverage the java.util.concurrent package for streamlined concurrency management. Employ thread-safe data structures judiciously.
6. Eradicating Code Duplication
Misstep: Repetition of code blocks across the application breeds maintenance challenges.
Solution: Embrace the DRY (Don’t Repeat Yourself) principle. Encapsulate common functionalities into modular methods or classes for seamless reuse. Enlist design patterns to foster a modular and maintainable codebase.
7. Comprehensive Testing Protocols
Misstep: Inadequate testing compromises the application’s reliability and exposes latent bugs.
Solution: Champion a comprehensive testing strategy encompassing unit tests, integration tests, and end-to-end tests. Leverage stalwart testing frameworks like JUnit and sophisticated tools such as Mockito for rigorous unit testing. Integrate continuous testing practices for automated validation.
8. Inefficient Database Access
Misstep: Poorly optimized database queries and data access can bottleneck application performance.
Solution: Optimize database queries, use indexing judiciously, and consider employing an Object-Relational Mapping (ORM) framework for streamlined data access. Leverage connection pooling to efficiently manage database connections.
9. Inadequate Logging and Monitoring
Misstep: Neglecting comprehensive logging and monitoring hinders issue diagnosis and tracking.
Solution: Implement robust logging using frameworks like SLF4J and Logback or Log4j. Integrate monitoring tools to track application metrics, log errors systematically, and set up alerts for critical issues.
10. Overlooking Design Patterns
Misstep: Failing to apply design patterns can result in code that is harder to understand, maintain, and extend.
Solution: Familiarize yourself with common design patterns such as Singleton, Factory, Observer, and Strategy. Apply these patterns judiciously to enhance code organization, flexibility, and maintainability.
11. Ignoring Security Best Practices
Misstep: Neglecting security measures can expose applications to vulnerabilities, jeopardizing data and user privacy.
Solution: Adhere to security best practices, including input validation, secure coding guidelines, and encryption mechanisms. Regularly update dependencies to patch known vulnerabilities. Consider leveraging frameworks like Spring Security for robust authentication and authorization.
12. Unoptimized Resource Handling
Misstep: Inefficient resource handling, such as file I/O or network operations, can lead to performance bottlenecks.
Solution: Optimize resource handling by using buffered I/O, minimizing network calls, and releasing resources promptly. Consider leveraging try-with-resources statements for automatic resource management.
13. Ignoring Code Reviews and Collaboration
Misstep: Neglecting code reviews and collaborative development compromises code quality.
Solution: Foster a culture of code reviews within your development team. Embrace collaborative tools such as Git for version control and establish coding standards. Regularly engage in knowledge-sharing sessions to enhance the collective expertise of the team.
14. Lack of Documentation
Misstep: Inadequate or outdated documentation makes it challenging for developers to understand and maintain the codebase.
Solution: Maintain comprehensive and up-to-date documentation, including code comments, README files, and inline documentation. Use tools like Javadoc for generating API documentation to enhance code comprehension.
15. Dependency Mismanagement
Misstep: Using outdated or incompatible dependencies can lead to compatibility issues and security vulnerabilities.
Solution: Regularly update dependencies to the latest stable versions. Utilize dependency management tools like Maven or Gradle to streamline dependency resolution and version control.
By conscientiously implementing these best practices, Java developers can elevate their craft, fortifying their projects against common pitfalls, and ensuring the development of robust, secure, and maintainable applications.
0 notes
Text
The thing about being a software developer is every time there's a vulnerability in a library your software DOESN'T depend on you can approach the situation it with the same manic enthusiasm of someone whose favourite character didn't just get royally fucked over on Supernatural. Half your friends are in tears but he he I guess you should have backed the winning horse on this one. There's absolutely no possibility it's going to be me wallowing on the floor in a few weeks time. Don't be ridiculous.
#supernatural#rip to log4j where my logback homies at#embarsssing. just realised i typod my favourite spn character i mean logging library of choice
2 notes
·
View notes
Note
[ ☾ How is sleep deprivation and other side effects from losing track of time working handled? Is he crankier? Super hostile? Fairly loopy? Heck, how do his peons handle him in these times of going well over 48 hours no sleep and only work?]
Send me a ☾ and a question regarding my character and I’ll write a drabble that answers it
“No! No! I already told you assholes—” Ein paused mid sentence, as if looking track of his own thought process, pointed finger over his head, “I already told you–” His arm dropped completely slack when his thought process derailed yet again.“Oh for gods sake–”
“Ein, what are you even going on about?!”
“Wh– Kotan! What the hell are you doing down here?!”
Kotan glaces nervously at the ceiling, “Just trying to figure out why most of the other researchers are hiding outside the lab.”
“Oh, fantastic! So that’s what they’ve been doing all goddamn day!” Ein threw his hands up in the air, “Glad to see I pay these spineless asswipes for their oh so diligent work! Not like I have plenty enough on my plate as is!”
“I mean, to be fair sir.” Kotan interjected cautiously, “You do have a tendency to threaten to eviscerate anyone who as much touches your Shadow Pokemon project.”
“For the record I don’t–” Ein opened his mouth as if to say something more, but whether it was an overabundance of rage or sleep deprivation, the man merely clutched his forehead, slicking back the strands of dark hair that simply refused to stay in place, his frontal lock in complete disarray. “Oh, piss off! If I wanted your opinion, I wouldn’t be goddamn Chief Lab now, would I?!”
Kotan crooked his brow, “What?”
“…What?? Oh for Arceus sake, I don’t have time for this, I’ve got—” Ein scrambled for his P*DA, fingers smacking at the screen, “Dammit, how many shadow pokemon did I need to do now??”
Kotan stretched his mouth. He recalled Nascour giving Ein a backlog of Pokemon from Snagem to shadowfy, but…
That was…
Oh no…
“Ein…” Kotan pried cautiously, “Have you slept at all since I went home?”
“Whats that got to do with anything?!” Ein snapped, squinting at his P*DA before fumbling at his face, “Oh for gods sake, where are my goddamn glasses!?”
“Ein, I left the lab Monday afternoon…” Kotan noted a couple timid heads starting peeking from the wall behind them, “It’s Wednesday evening.”“Wh– did I really– wh– How in th-” The head scientist seemed disorientated struggling with basic sentences before slamming his hand on the desk in front of him, eyes completely crazed with a now obvious lack of sleep.

“WHAT DOES THAT MATTER, KOTAN?!” Kotan wasn’t sure if he heard the desk squeaking or if some unfortunate soul was trying to hide underneath the desk. “I’VE GOT A LOGBACK OF POKEMON TO DEAL WITH, AND APPARENTLY I’M THE ONLY ONE TO–” Ein paused for a moment, looking not as much in a ponder, but more as in the fact that it seemed that his brain stopped working for a moment or two.
“Ein…” Kotan attempted to request, “Please for Arceus’ sake, go to bed. I’m sure Nascour will–”
“Oh no, no, no. No. Nascour wants them done immediately, and he’s going to get them immediately.” Ein sneered, “And I’m also going to tell that fairy-dressed bastard that he can kiss my ass– You know what, I’m doing that right now.” Ein furiously typed on his P*DA, bloodshot eyes squinting at the screen. With a roar in frustration, he flung his head back, “OH GODDAMMIT, WHERE ARE MY FUCKING GLASSES?!”
“Well um–” Kotan attempted to interject as he watched Eins 75,000 pokedollar shades fly off from the top of his head and clash onto the ground. The researchers peeking from the walls scrambled away from the frenzied Cipher Admin. Kotan sighed, picking up the shades, handing them to Ein.
Ein snatched them from his second-in-command, grumbling something indecipherable and he placed his shades back on, hitting send on the P*DA.
“You know what? Screw this, I’m going to bed.” The lab chief slammed his fist onto the nearby elevator lift buttons before spinning back to face Kotan, pointing furiously, “–Not because you told me to, you old bastard!” Ein grumbled to himself, lifting a finger, but almost falling immediately slack, “Consider yourself lucky I forgot I was going to say!” The Cipher Admin snarled before the lift doors opened, almost falling over getting into the lift.
Kotan shook his head as the lift dropped, taking the head loon with it.
And with Eins disappearance, Cipher peons and researchers began to show out of the woodworks, one of them even remarking to Kotan, “You do realize you just sent the most terrifying man in this facility to bed, yes?”
Kotan shrugged, “Categorically.”
3 notes
·
View notes
Video
youtube
0 notes
Text
Cinnamon: Way For Monitoring & Metrics Generation for Akka ActorSystem
Cinnamon: Way For Monitoring & Metrics Generation for Akka ActorSystem
We are developing huge applications and deployed on multiple virtual machines and clusters. For monitoring applications, we need to enable logs into our application and analysis that logs with help of some tools like elastic stack. But !! what if we need to check health of application on virtual machines and clusters? For that, we are using several Metrics for system health check like Gauges, Hist…
View On WordPress
#Cinnamon#telemetry#actosystem#Akka#cluster#gradle#lightbend#Logback#logs#maven#opensource#sbt#scala#technology
0 notes
Text
NewRelic Logs With Logback on Azure Cloud
http://i.securitythinkingcap.com/SnXGK1
0 notes
Text
Heart v8.4.0
Today I released v8.4.0 of my Heart library to GitHub and Maven Central. I did this mainly to incorporate the DecalManager class that I created for More Advanced Vehicles, though that wasn't the only change.
DecalManager has obvious utility in apps that don't involve vehicles, so Heart is a more logical home for it.
Also, I upgraded an external library: logback-classic v1.4.7 .
0 notes
Text
Full Stack Java Developer
Kforce has a client in Westlake, TX that is seeking a Full Stack Java Developer (40% Angular/60% Spring boot Java). The…, frameworks, libraries, and related technologies: Java EE, Apache Tomcat, Spring MVC/Spring Boot, Logback, SLF4j, Maven Client… Apply Now
0 notes
Link
1 note
·
View note
Text
Application Performance Monitoring (APM) can be defined as the process of discovering, tracing, and performing diagnoses on cloud software applications in production. These tools enable better analysis of network topologies with improved metrics and user experiences. Pinpoint is an open-source Application Performance Management(APM) with trusted millions of users around the world. Pinpoint, inspired by Google Dapper is written in Java, PHP, and Python programming languages. This project was started in July 2012 and later released to the public in January 2015. Since then, it has served as the best solution to analyze the structure as well as the interconnection between components across distributed applications. Features of Pinpoint APM Offers Cloud and server Monitoring. Distributed transaction tracing to trace messages across distributed applications Overview of the application topology – traces transactions between all components to identify potentially problematic issues. Lightweight – has a minimal performance impact on the system. Provides code-level visibility to easily identify points of failure and bottlenecks Software as a Service. Offers the ability to add a new functionality without code modifications by using the bytecode instrumentation technique Automatically detection of the application topology that helps understand the configurations of an application Real-time monitoring – observe active threads in real-time. Horizontal scalability to support large-scale server group Transaction code-level visibility – response patterns and request counts. This guide aims to help you deploy Pinpoint APM (Application Performance Management) in Docker Containers. Pinpoint APM Supported Modules Below is a list of modules supported by Pinpoint APM (Application Performance Management): ActiveMQ, RabbitMQ, Kafka, RocketMQ Arcus, Memcached, Redis(Jedis, Lettuce), CASSANDRA, MongoDB, Hbase, Elasticsearch MySQL, Oracle, MSSQL(jtds), CUBRID, POSTGRESQL, MARIA Apache HTTP Client 3.x/4.x, JDK HttpConnector, GoogleHttpClient, OkHttpClient, NingAsyncHttpClient, Akka-http, Apache CXF JDK 7 and above Apache Tomcat 6/7/8/9, Jetty 8/9, JBoss EAP 6/7, Resin 4, Websphere 6/7/8, Vertx 3.3/3.4/3.5, Weblogic 10/11g/12c, Undertow Spring, Spring Boot (Embedded Tomcat, Jetty, Undertow), Spring asynchronous communication Thrift Client, Thrift Service, DUBBO PROVIDER, DUBBO CONSUMER, GRPC iBATIS, MyBatis log4j, Logback, log4j2 DBCP, DBCP2, HIKARICP, DRUID gson, Jackson, Json Lib, Fastjson Deploy Pinpoint APM (Application Performance Management) in Docker Containers Deploying the PInpoint APM docker container can be achieved using the below steps: Step 1 – Install Docker and Docker-Compose on Linux. Pinpoint APM requires a Docker version 18.02.0 and above. The latest available version of Docker can be installed with the aid of the guide below: How To Install Docker CE on Linux Systems Once installed, ensure that the service is started and enabled as below. sudo systemctl start docker && sudo systemctl enable docker Check the status of the service. $ systemctl status docker ● docker.service - Docker Application Container Engine Loaded: loaded (/usr/lib/systemd/system/docker.service; enabled; vendor preset: disabled) Active: active (running) since Wed 2022-01-19 02:51:04 EST; 1min 4s ago Docs: https://docs.docker.com Main PID: 34147 (dockerd) Tasks: 8 Memory: 31.3M CGroup: /system.slice/docker.service └─34147 /usr/bin/dockerd -H fd:// --containerd=/run/containerd/containerd.sock Verify the installed Docker version. $ docker version Client: Docker Engine - Community Version: 20.10.12 API version: 1.41 Go version: go1.16.12 Git commit: e91ed57 Built: Mon Dec 13 11:45:22 2021 OS/Arch: linux/amd64 Context: default Experimental: true
..... Now proceed and install Docker-compose using the dedicated guide below: How To Install Docker Compose on Linux Add your system user to the Docker group to be able to run docker commands without sudo sudo usermod -aG docker $USER newgrp docker Step 2 – Deploy the Pinpoint APM (Application Performance Management) The Pinpoint docker container can be deployed by pulling the official docker image as below. Ensure that git is installed on your system before you proceed. git clone https://github.com/naver/pinpoint-docker.git Once the image has been pulled, navigate into the directory. cd pinpoint-docker Now we will run the Pinpoint container that will have the following containers joined to the same network: The Pinpoint-Web Server Pinpoint-Agent Pinpoint-Collector Pinpoint-QuickStart(a sample application, 1.8.1+) Pinpoint-Mysql(to support certain feature) This may take several minutes to download all necessary images. Pinpoint-Flink(to support certain feature) Pinpoint-Hbase Pinpoint-Zookeeper All these components and their configurations are defined in the docker-compose YAML file that can be viewed below. cat docker-compose.yml Now start the container as below. docker-compose pull docker-compose up -d Sample output: ....... [+] Running 14/14 ⠿ Network pinpoint-docker_pinpoint Created 0.3s ⠿ Volume "pinpoint-docker_mysql_data" Created 0.0s ⠿ Volume "pinpoint-docker_data-volume" Created 0.0s ⠿ Container pinpoint-docker-zoo3-1 Started 3.7s ⠿ Container pinpoint-docker-zoo1-1 Started 3.0s ⠿ Container pinpoint-docker-zoo2-1 Started 3.4s ⠿ Container pinpoint-mysql Sta... 3.8s ⠿ Container pinpoint-flink-jobmanager Started 3.4s ⠿ Container pinpoint-hbase Sta... 4.0s ⠿ Container pinpoint-flink-taskmanager Started 5.4s ⠿ Container pinpoint-collector Started 6.5s ⠿ Container pinpoint-web Start... 5.6s ⠿ Container pinpoint-agent Sta... 7.9s ⠿ Container pinpoint-quickstart Started 9.1s Once the process is complete, check the status of the containers. $ docker ps CONTAINER ID IMAGE COMMAND CREATED STATUS PORTS NAMES cb17fe18e96d pinpointdocker/pinpoint-quickstart "catalina.sh run" 54 seconds ago Up 44 seconds 0.0.0.0:8000->8080/tcp, :::8000->8080/tcp pinpoint-quickstart 732e5d6c2e9b pinpointdocker/pinpoint-agent:2.3.3 "/usr/local/bin/conf…" 54 seconds ago Up 46 seconds pinpoint-agent 4ece1d8294f9 pinpointdocker/pinpoint-web:2.3.3 "sh /pinpoint/script…" 55 seconds ago Up 48 seconds 0.0.0.0:8079->8079/tcp, :::8079->8079/tcp, 0.0.0.0:9997->9997/tcp, :::9997->9997/tcp pinpoint-web 79f3bd0e9638 pinpointdocker/pinpoint-collector:2.3.3 "sh /pinpoint/script…" 55 seconds ago Up 47 seconds 0.0.0.0:9991-9996->9991-9996/tcp, :::9991-9996->9991-9996/tcp, 0.0.0.0:9995-9996->9995-9996/udp,
:::9995-9996->9995-9996/udp pinpoint-collector 4c4b5954a92f pinpointdocker/pinpoint-flink:2.3.3 "/docker-bin/docker-…" 55 seconds ago Up 49 seconds 6123/tcp, 0.0.0.0:6121-6122->6121-6122/tcp, :::6121-6122->6121-6122/tcp, 0.0.0.0:19994->19994/tcp, :::19994->19994/tcp, 8081/tcp pinpoint-flink-taskmanager 86ca75331b14 pinpointdocker/pinpoint-flink:2.3.3 "/docker-bin/docker-…" 55 seconds ago Up 51 seconds 6123/tcp, 0.0.0.0:8081->8081/tcp, :::8081->8081/tcp pinpoint-flink-jobmanager e88a13155ce8 pinpointdocker/pinpoint-hbase:2.3.3 "/bin/sh -c '/usr/lo…" 55 seconds ago Up 50 seconds 0.0.0.0:16010->16010/tcp, :::16010->16010/tcp, 0.0.0.0:16030->16030/tcp, :::16030->16030/tcp, 0.0.0.0:60000->60000/tcp, :::60000->60000/tcp, 0.0.0.0:60020->60020/tcp, :::60020->60020/tcp pinpoint-hbase 4a2b7dc72e95 zookeeper:3.4 "/docker-entrypoint.…" 56 seconds ago Up 52 seconds 2888/tcp, 3888/tcp, 0.0.0.0:49154->2181/tcp, :::49154->2181/tcp pinpoint-docker-zoo2-1 3ae74b297e0f zookeeper:3.4 "/docker-entrypoint.…" 56 seconds ago Up 52 seconds 2888/tcp, 3888/tcp, 0.0.0.0:49155->2181/tcp, :::49155->2181/tcp pinpoint-docker-zoo3-1 06a09c0e7760 zookeeper:3.4 "/docker-entrypoint.…" 56 seconds ago Up 52 seconds 2888/tcp, 3888/tcp, 0.0.0.0:49153->2181/tcp, :::49153->2181/tcp pinpoint-docker-zoo1-1 91464a430c48 pinpointdocker/pinpoint-mysql:2.3.3 "docker-entrypoint.s…" 56 seconds ago Up 52 seconds 0.0.0.0:3306->3306/tcp, :::3306->3306/tcp, 33060/tcp pinpoint-mysql Access the Pinpoint APM (Application Performance Management) Web UI The Pinpoint Web run on the default port 8079 and can be accessed using the URL http://IP_address:8079. You will be granted the below page. Select the desired application to analyze. For this case, we will analyze our deployed Quickapp. Select the application and proceed. Here, click on inspector to view the detailed metrics. Here select the app-in-docker You can also make settings to Pinpoint such as setting user groups, alarms, themes e.t.c. Under administration, you can view agent statistics for your application Manage your applications under the agent management tab To set an alarm, you first need to have a user group created. you also need to create a pinpoint user and add them to the user group as below. With the user group, an alarm for your application can be created, a rule and notification methods to the group members added as shown. Now you will have your alarm configured as below. You can also switch to the dark theme which appears as below. View the Apache Flink Task manager page using the URL http://IP_address:8081. Voila! We have triumphantly deployed Pinpoint APM (Application Performance Management) in Docker Containers. Now you can discover, trace, and perform diagnoses on your applications.
0 notes