#longitudinal datasets
Explore tagged Tumblr posts
Visit Tumblr Blog
Explore Tumblr blogs with no restrictions, modern design and the best experience.
Last Seen Tumblr Blogs


Fun Fact
Tumblr has 4 main sources of revenue.
Text
AI-Driven Real-World Imaging Data for Precision Healthcare
Segmed provides de-identified, standardized real-world imaging data (RWiD) from diverse global sources to accelerate AI development, clinical research, and precision medicine. Our platform ensures secure, interoperable access to imaging datasets that drive innovation in life sciences, healthcare, and diagnostics.
#real world data#Foundation model#oncology data#longitudinal datasets#electronic medical records#real world imaging#real world imaging data#real-world medical imaging
0 notes
Note
I keep seeing this claim that schools/the education system today are designed for girls and disadvantage boys and that’s why girls and women are out performing boys and men at basically every level of education. Does this claim actually have any merit or truth to it? Because tbh I have a hard time believing it and I find it interesting that this seems to be the popular explanation for why girls are doing better in school when I somehow doubt a similar explanation would be widely used if girls were doing worse.
Thanks in advance and I hope you have a lovely rest of your day (or afternoon/evening/night)!
I hope you have a lovely day as well! I know this response took a while, so I hope you still see it!
Evidence For and Against a Gender Gap in Education
There's been a lot of reporting about how boys are "falling behind" in education but there is ... much less evidence to support this. (At least for young children, who are generally the focus in this sort of conversation.)
To start with, we can look at the data from the National Assessment of Educational Progress (NAEP), which is "a congressionally mandated program that is overseen and administered by the National Center for Education Statistics (NCES), within the U.S. Department of Education and the Institute of Education Sciences" [1]. Using their data explorer to examine trends in performance, we see very similar performance between boys and girls in general. However, looking at the most recent year for any particular subject and grade level (grade 4 ~ age 9; grade 8 ~ age 13; grade 12 ~ age 17), we can see some small differences.
Boys have higher scores than girls in:
Mathematics (500 point scale for grade 4 and 8; 300 point scale for grade 12) in grade 4 (-6 points), 8 (-2), and 12 (-3)
Science (300 point scale) in grade 12 (-4); girls and boys show no significant difference in grade 4 or 8
US history (500 point scale) for 8 (-4) and 12 (-4); girls and boys show no significant difference in grade 4
Geography (500 point scale) for grade 4 (-4), 8 (-3), and 12 (-5)
Girls have higher score than boys in:
Reading (500 point scale) for grade 4 (+6), 8 (+8), and 12 (+13)
Writing (300 point scale) for grade 4 (+17), 8 (+19), and 12 (+14)
Civics (300 point scale) for grade 4 (+7) and 8 (+2); girls and boys show no difference in grade 12
So, according to a standardized test measurement in the USA, there is little difference in boys and girls performance. Where there are differences they: tend to be small (mostly single digit differences on 300- and 500-point scales) and varied in direction (i.e., boys score higher in some things and girls in others).
Notably, there are substantially higher racial gaps (20-30+ points) in these subjects, suggesting that there isn't a "boy crisis" there's a "marginalized races crisis". (For both sexes, but, interestingly, more so for boys.)
In addition to that, this examination of longitudinal data [2] reaches essentially the same conclusion (different direction of gap by subject, small effect size, bigger racial difference, etc.) but also concludes that most boys "gain ground" as they age. This Dutch article [3] examines several large-scale national and international datasets and also comes to the same conclusion. (Importantly, however, as this will come up later, they did find substantial gender differences in "non-cognitive domains".)
All in all, this suggests the empirical evidence for a "boy crisis" in grade school education is weak.
That being said, there are a couple measures that do provide support for the idea specifically in older students. First, Brookings analyzed data from the Department of Education [4], and found that there is a sex gap in high school graduation rates such that a lower proportion of boys than girls graduated. Notably, however, this gap is much smaller for Asian Americans and White Americans than for Black Americans and Hispanic Americans, which suggests this is – again – more of racial issue than a gender issue.
In addition that, women are outpacing men in college entrance and graduation in the USA, according to the Pew Research Center [5]. Specifically, 39% of women over age 25 have a Bachelor's degree compared to 37% of men. However, when considering only the most recent cohort (adults aged 25 to 34), 46% of women have a Bachelor's degree compared to 36% of men.
Importantly, however, this difference is not driven by structural inequality. For individuals who did not earn a Bachelor's degree, 44% of women report financial constraints and 38% report family obligations, compared to 39% and 35% of men respectively. In contrast, 34% of men reported they "just didn't want to" and 26% report they didn't need it for their desired job, compared to 25% and 20% of women respectively. This does not support the narrative of an external "boy's crisis".
And, in addition to all of that, men are still the majority in highest paying jobs, the majority in governmental and commercial leadership positions, more likely to be the primary or sole earner in a family, and earn more - on average - that women [6].
I'd propose that any differences in educational achievement – if they existed – would be irrelevant without a similar "real world" impact. That is, what does it matter if girls outperform boys on reading tests (or boys outperform on math tests) if they are not also gaining ground in their adult professional careers?
---
Boy's Behavior
Having established that there isn't very strong evidence for a sex gap in educational achievement, I want to note that there is evidence for another type of sex gap: behavior.
This study [7] actually provides evidence that nearly all of the sex differences in grades (i.e., girls receiving higher grades from teachers in primary school) is dependent on the student's behaviors. In other words, once adjusted for "noncognitive skills", differences in grades disappears.
And remember that Dutch study [3] from earlier? They also found that teacher rated young girls "substantially more favourably than boys" for "social behaviour and work attitude". For older students, boys rated themselves less "peaceable" than girls.
The common belief that female teachers (as compared to male teachers) hurt boys performance also appears unfounded, as indicated by this review article [8]. These studies [9, 10] also draw the same conclusion, and additionally suggest that boys behavior/attitudes in school is worse than girls for both female and male teachers.
(Some people may read this and think that this is the result of girls "maturing faster" than boys. So, I'd like to point out that is almost certainly a result of socialization. Someone else has written a blog post about this topic [11], but also see this post about brain sex that also considers the reach and effects of early socialization.)
---
Conclusion
All in all, there isn't strong evidence of a "boy's education crisis". While there are gender differences in education performance they vary by subject and grade level, tend to be very small (much smaller than other demographic differences), and don't appear to have a "real world" impact.
There is evidence that boys are less disciplined and less positive in educational environments, a difference that is most likely driven by how boys are socialized in comparison to girls. (For example, boys are encouraged to be more out-going, girls are more likely to be praised for "good behavior", girls are included in chores more often and at younger ages, etc.)
I hope this helps!
References below the cut:
NAEP: National Assessment of Educational Progress. (2024, March 21). About NAEP: A Common Measure of Student Achievement; National Center for Education Statistics. https://nces.ed.gov/nationsreportcard/about/
Husain, M., & Millimet, D. L. (2009). The mythical ‘boy crisis’? Economics of Education Review, 28(1), 38–48. https://doi.org/10.1016/j.econedurev.2007.11.002
Driessen, G., & Van Langen, A. (2013). Gender differences in primary and secondary education: Are girls really outperforming boys? International Review of Education, 59(1), 67–86. https://doi.org/10.1007/s11159-013-9352-6
Reeves, R. V., Buckner, E., & Smith, E. (2021). The unreported gender gap in high school graduation rates. Brookings. https://www.brookings.edu/articles/the-unreported-gender-gap-in-high-school-graduation-rates/
Parker, K. (2021, November 8). What’s behind the growing gap between men and women in college completion? Pew Research Center. https://www.pewresearch.org/short-reads/2021/11/08/whats-behind-the-growing-gap-between-men-and-women-in-college-completion/
Schaeffer, K. (2024, February 27). For Women’s History Month, a look at gender gains – and gaps – in the U.S. Pew Research Center. https://www.pewresearch.org/short-reads/2024/02/27/for-womens-history-month-a-look-at-gender-gains-and-gaps-in-the-us/
Cornwell, C., Mustard, D. B., & Van Parys, J. (2013). Noncognitive skills and the gender disparities in test scores and teacher assessments: Evidence from primary school. Journal of Human resources, 48(1), 236-264.
Coenen, J., Cornelisz, I., Groot, W., Maassen van den Brink, H., & Van Klaveren, C. (2018). Teacher characteristics and their effects on student test scores: A systematic review. Journal of economic surveys, 32(3), 848-877.
de Zeeuw, E. L., van Beijsterveldt, C. E., Glasner, T. J., Bartels, M., de Geus, E. J., & Boomsma, D. I. (2014). Do children perform and behave better at school when taught by same-gender teachers?. Learning and Individual Differences, 36, 152-156.
Carrington, B., Tymms, P., & Merrell, C. (2008). Role models, school improvement and the ‘gender gap’—do men bring out the best in boys and women the best in girls?. British Educational Research Journal, 34(3), 315-327.
Graham, R. (2023, September 22). Do girls really mature faster than boys, or do we just force them to? The Noösphere. https://archive.is/2023.09.22-090402/https://medium.com/the-no%C3%B6sphere/do-girls-really-mature-faster-than-boys-or-do-we-just-force-them-to-68e31307abf3
66 notes
·
View notes
Text
There's something in the water...
While on my way to the college this morning, I saw a guy dancing in his tighty whities at the intersection. Just shaking it, without a care in the world.🩲
Then, I saw another guy running down the street screaming, "FUUUCK THIS SHIIIITTTT!" repeatedly, with a blanket wrapped around himself.🦸♂️
Then, I run into one of my super nice Canadian doctoral mentors (sweetest man ever❤️), and we talk about datasets, longitudinal case control studies, and epidemiological statistics for random small talk. 😂🤓
I don't know how to explain this, but somehow, all of this just seems par for the course in my life right now 😂 it just makes sense....crazy people and stats.
Not sure what that says about my life, but I'm glad to be along for this crazy ride 😜
60 notes
·
View notes
Text
trends in astolfo penis size over time analyzed from imageboard datasets, a longitudinal study
10 notes
·
View notes
Text
By: Ryan Burge
Published: Apr 7, 2025
There’s this very much overused saying in my line of work - data is the new oil. When you hear someone giving a ‘hype’ speech at a data science conference that line usually comes up one way or another. The assumption here is that with the right kind of data, the right kind of analysis, and the right kind of interpretation it’s possible to make decisions that can save lives, lower carbon emissions, avert wars, and make the world a better place.
My aims in life are a whole lot more modest - just describe the wonderful and maddening world of American religion. That’s it, really. But even in my little niche of a subfield of social science, I still need oil. I can’t tell you how many times that I am in the middle of a talk and I’m pointing at a graph, describing a result and thinking, “Man, I wish I could have an even more recent data point to figure out this trend line.”
Well, that day has come my friends. The 2024 Cooperative Election Study has been released. It’s Christmas, New Year’s, Easter, and my birthday — all on a random Tuesday. Here’s why this is a big deal - the CES is the largest longitudinal survey that exists. During an election year, its sample size is at least 60,000. When I combine every single CES data file from way back in 2006 through 2024, the result is a dataset of nearly 700,000 Americans.
You can expect me to strip mine this new 2024 data over the next year or so, but before I get into the weeds I wanted to provide you all with a high-level overview of how much (or how little) has changed in the last year.
Let’s start with the top line finding for me - I continue to double and triple down on a statement that I made about a year ago - the rise of the nones is essentially over for now. Let me show you what I mean.

In 2008, about 21% of the entire sample identified as atheist, agnostic, or claimed no religion in particular. Just six years later the share of the sample who were non-religious was 28%. A jump of seven percentage points in a very short window of time. Six years later, it was up to 34% - up six points from 2014 and a thirteen point increase since 2008. The non-religious share of the population was growing about as fast as anything in the world of demography.
But look back at that bar graph for both 2019 and 2020. The overall share of nones was 35% during that time period. For the samples collected in 2021, 2022, and 2023 the portion who were non-religious was between 35% and 36%. In the most recent data collected less than six months ago the percentage was down to 34%. In other words, there’s been no discernible change in the nones in the United States in the last five years. If anything, there’s a hint that things are actually moving very slowly in the other direction.
The share of Americans who are atheist? It hasn’t really changed at all in the last decade or so. The modal percentage has been 6%. The same is true for the agnostic share, too. It’s not changed in a substantive way since 2012, really. Maybe up a single percent. It’s the nothing in particulars that shifted the most - but their share was just 21% in 2024 - that’s lower than it was in 2019.
But how is this happening? A generational analysis is always helpful.
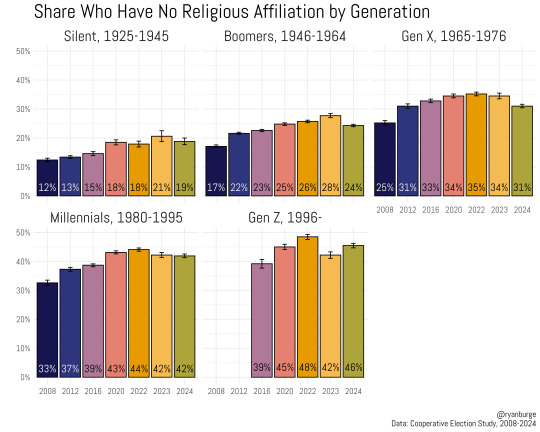
Let me just start with the Baby Boomers. The share of non-religious Boomers grew slowly and steadily over time from 17% in 2008 to 28% in the 2023 data. But look at what this new survey reveals - the share of Boomers who are non-religious is now just 24%. That’s back to the 2018 levels. And that same general trend is there for Generation X, too. They rose from 25% to 35% between 2008 and 2022. But the estimate in 2023 was 34% and it’s down to 31% in the 2024 results. That’s the same percentage as 2012.
For Millennials, it’s basically the same story as Generation X - it’s just that the overall percentages are higher across the board. There was a ten point increase in the nones between 2008 and 2022, but then a two point decline to 42% in both 2023 and 2024. And Generation Z is a weird one because the same 2022 peak is there at 48%, then a big decline - six points in 2023. (For what it’s worth, I thought that it couldn’t be that large and I said so to numerous groups over the last year). Now, the 2024 number is 46%, which honestly makes perfect sense. I would have guessed the real number was around 45%. So this is confirmation to me that 2023 was just a wonky sample for Gen Z.
Let me put the “I am going to take a picture of your slide with my camera” graph right below. This is the one that sort of encapsulates the entirety of religious change in the United States in a pretty succinct way.

To me, this graph really comports well with how I am thinking about things in American religion right now. The first thing to note is that Christianity has just not been doing well in transferring itself down through the next generation - that’s especially true for Protestants. Among the Silent Generation, 47% were Protestants. It was 5 points lower among Boomers, dropped another six points among Gen X, then declined a whopping nine points among Millennials - just 27% of them are Protestants. Gen Z is even worse at only 22% Protestant - a drop of 25 points from top to bottom.
Catholics, on the other hand, look a whole lot more robust. Among Silents, 22% are Catholic. It’s 20% of Boomers, and 18% of Gen X. It's notable that the Catholic percentage seems to have hit a floor - 16% with both Millennials and Gen Z. But overall, about 70% of the Silent Generation are Christians compared to only 38% of Gen Z. Certainly not great news for the Christians who read this newsletter.
Okay - enough about religious belonging. Let me pivot to the other metric that is incredibly relevant - religious attendance.
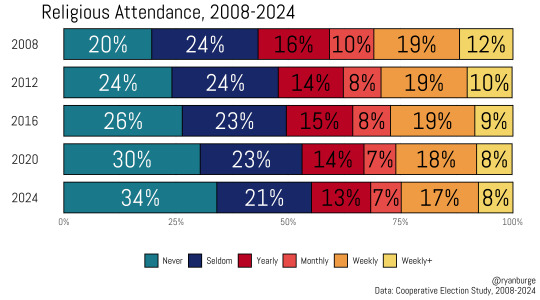
If the headline from this post is that religious belonging may be seeing a glimmer of hope, that enthusiasm is dampened significantly when glancing at this graph. The overall decline in attendance at houses of worship has continued at a pretty steady pace since 2008. In that sample, 44% of folks attended less than once a year while 31% were attending religious services on a weekly basis. It’s been all downhill from there.
In the 2024 data, about a third of the sample said that they never attended religious services. That’s a four-point jump since 2020 and a fourteen-point increase from 2008. Overall, 55% of American adults attend a religious service less than once a year now - that’s an eleven point jump in sixteen years.
What buoys this a little bit is the share of Americans who are incredibly religiously active. Again, it was 31% weekly attenders in 2008 and it was still 28% by 2016. Three points in eight years isn’t that bad really. In the next eight years, it also dropped another three points. Today, a quarter of Americans are weekly attenders. Low-attenders bested high-attenders by 13 points in 2008. In the 2024 result it had ballooned to 30 points. There’s no evidence of any type of revival in this graph.
But, if I break this down into generations, there is a bit more nuance that is worth conveying.
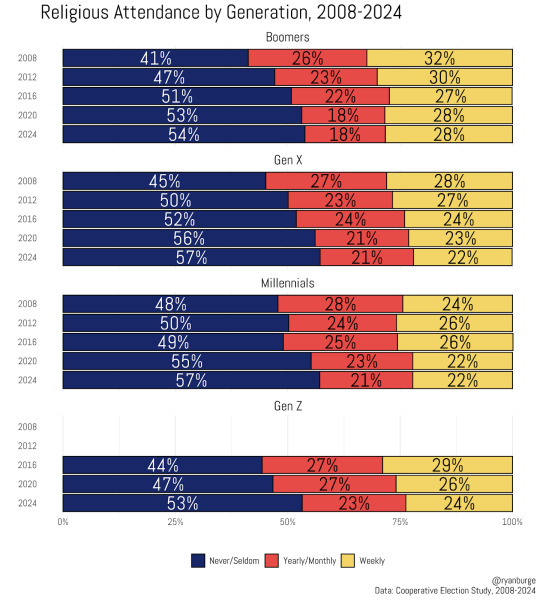
Okay - I think we can all admit that the very low attendance category has gained ground among older Americans and younger Americans, too. The never/seldom percentage is up thirteen points among Boomers, twelve points among Gen X, and nine points among Millennials between 2008 and 2024. Meanwhile the high attending share is down four points, six points, and two points respectively. Read that last sentence again, please. There’s not been a huge drop in the share of each generation that is incredibly religious engaged. Instead it’s a lot of movement from the yearly/monthly group down to the seldom/never bucket. The strong core of highly engaged religious people is still there.
Here’s the other piece of this that I think is a pretty interesting result - the religious attendance of Gen Z is actually pretty robust compared to other generations. In 2024, 24% of Gen Z were attending weekly - that was two points higher than Millennials and Gen X. While 53% of Gen Z are attending less than once a year, that’s actually the lowest percentage of any generation in this analysis. Maybe, just maybe Generation Z is more religiously engaged than their parents or grandparents.
So - there you go. It’s a really mixed bag for Christians who are hoping for a revival. This is most certainly not a catastrophic set of data where the nones have just continued to explode in size and religious activity has fallen off a cliff. But there's also not any evidence at all of “A Great Awakening” or anything like that. Religion seems to have hit a bit of stasis in the last five years.
What comes next? I have no idea. But I’m already waiting for another release of CES data.
==
Hopefully it's just a temporary pause and resumes its downward trajectory.
#Ryan Burge#rise of the nones#religion#decline of religion#leaving religion#empty the pews#no religion#irreligion#religion is a mental illness
4 notes
·
View notes
Text
North America Leads Preclinical Imaging Boom While Asia-Pacific Grows Fastest
The preclinical in‑vivo imaging market is undergoing rapid transformation as demand grows across biomedical research, drug discovery, and translational science. Valued at approximately $1.0 billion in 2023, the market is expected to reach $1.4 billion by 2030, reflecting a compound annual growth rate (CAGR) of 4.8%.

This momentum is driven by innovations in multimodal imaging technologies, the rising integration of artificial intelligence (AI), and surging global R&D investments. These advancements are enabling scientists to study disease progression, therapeutic effects, and molecular changes in real time, non-invasively, using live animal models.
To Get Sample Report: https://www.datamintelligence.com/download-sample/grow-lights-market
Key Market Drivers & Growth Factors
1. Technological Innovation & Multimodal Imaging
Hybrid imaging systems, such as PET/CT, PET/MRI, and optical/nuclear combinations, have revolutionized the ability to collect complementary data simultaneously. This not only reduces animal usage but also improves the quality and speed of translational research.
2. Artificial Intelligence & Automated Image Analysis
AI and machine learning are significantly transforming preclinical imaging by reducing the time spent on manual data interpretation and enabling automated, reproducible analysis across high-throughput studies. This technology is especially critical for analyzing multimodal datasets.
3. Expansion in Research Funding
Governments and private institutions are increasing their funding for preclinical and translational research, especially in areas like oncology, neuroscience, and regenerative medicine. Funding increases are encouraging the acquisition of new imaging systems across academic labs and research organizations.
4. Demand for Non-Invasive Longitudinal Imaging
Longitudinal studies using non-invasive imaging enable researchers to follow the same animal throughout an entire experiment, greatly improving data reliability while reducing the number of animals used.
5. Miniaturization & Cost-Effectiveness of Imaging Devices
Innovations in hardware design are making compact, cost-effective systems more accessible, especially for academic institutions and startups. Entry-level optical and ultrasound systems are driving increased adoption in emerging markets.
Regional Insights
North America: Leading the Global Market
North America maintains its dominance due to strong infrastructure, large pharmaceutical pipelines, and substantial R&D spending. The U.S., in particular, holds the largest market share, supported by its leading academic institutions, biotech hubs, and research-driven collaborations.
Asia-Pacific: Fastest-Growing Region
Asia-Pacific is projected to register the highest CAGR of approximately 9% through 2033. Japan, China, and India are emerging as significant players, thanks to improvements in healthcare infrastructure, government support, and rapidly expanding biotech ecosystems. The region’s market is forecast to grow from $189.6 million in 2024 to over $400 million by 2033.
Application Areas
Oncology Research
Oncology remains the dominant application in preclinical imaging, driven by the need to visualize tumor progression, metastasis, and response to therapy. High-resolution PET and fluorescence imaging are widely used to assess cancer biomarkers and treatment efficacy.
Cardiovascular and Neurological Disorders
Cardiovascular and neurodegenerative diseases are becoming key focus areas due to the increasing availability of targeted imaging probes and platforms that allow researchers to study functional changes in small animal hearts and brains in vivo.
Infectious Disease & Immunology
Preclinical imaging is also being utilized to track infection progression and immune responses in real time. These applications saw a notable rise during the COVID-19 pandemic and continue to expand in virology and immuno-oncology research.
Industry Trends & Innovation
Rise of Contract Research Organizations (CROs)
The outsourcing of preclinical studies to CROs is increasing, enabling pharmaceutical companies to focus on core competencies while accessing specialized imaging expertise and facilities.
Multimodal Imaging Systems
Manufacturers are increasingly offering hybrid systems that combine multiple imaging technologies into a single platform. These systems offer flexibility for researchers conducting studies across multiple therapeutic areas.
Integration of AI & Deep Learning
AI-based solutions are now embedded into imaging platforms to enhance sensitivity, automate quantification, and reduce human error. This development allows for faster, more accurate preclinical trials.
Customization & Workflow Automation
Companies are designing systems that cater to specific research needs whether in oncology, toxicology, or neurology and automating workflows to support high-throughput demands.
Competitive Landscape
Key players in the market include Bruker Corporation, PerkinElmer (Revvity), FUJIFILM VisualSonics, Mediso Ltd., and MILabs. These companies are investing in product innovation, regional expansion, and partnerships to solidify their positions.
Recent product launches and strategic alliances indicate a focus on providing compact, affordable systems that integrate cloud-based data analysis and AI support. Cross-sector collaborations with pharma companies and academic research centers are also becoming more common.
🇺🇸 United States Trends
The U.S. continues to lead in system sales, installations, and research output.
Federal funding through NIH and DoD remains a major market driver.
Startups and mid-size firms are increasingly offering AI-enabled analysis as a service.
🇯🇵 Japan Trends
Japan has bolstered investment in life sciences, regenerative medicine, and preclinical infrastructure.
National research policies encourage imaging adoption, especially in stem cell, iPSC, and gene therapy research.
Japanese universities and CROs are adopting new-generation compact systems for diverse applications, boosting local innovation.
Outlook & Future Potential
Market Growth: Expected CAGR of 4.8% through 2030 reflects the steady demand and expansion of advanced systems across the globe.
Emerging Economies: New adoption in Latin America, Southeast Asia, and the Middle East could further unlock opportunities.
Precision Medicine Support: As personalized therapies rise, preclinical imaging will become indispensable for therapeutic validation and early-stage efficacy studies.
Conclusion
The preclinical in‑vivo imaging market is poised for robust growth rising from $1.0 billion in 2023 to $1.4 billion by 2030. This expansion is driven by technological innovation, growing applications in drug discovery and disease modeling, and increasing integration of AI and automation.
From the dominance of North America to the high-growth pace in Asia-Pacific, this market presents enormous opportunities for manufacturers, researchers, CROs, and investors alike to participate in the future of translational science.
#preclinical in‑vivo imaging#preclinical in‑vivo imaging market#preclinical in‑vivo imaging Market size
0 notes
Text
Module 1 Assignment
As an educator, I’m interested in how student mental health correlates with academic performance, so I decided to work with the ADD datasets, specifically INHOME05 Academics and Education; INHOME10 Feelings Scale; and INHOME04 Taught in School. To narrow down my research question, I’m curious about how student academic performance in their English courses (INHOME05) correlate with how they rank their feelings of social belonging at school (“You feel like you belong at your school” (INHOME05)) and how they rank statements related to self-efficacy or attention (like “You had trouble keeping your mind on what you were doing” (INHOME10)); my secondary question is how the rankings for the same feelings claim correlate to whether they received any instruction at school about how to deal with stress (INHOME04). It’s interesting to conduct a lit review now, because the data is from 1994-1995, so before social media and the pandemic. I picked three articles for my literature review. I really liked Clarke et al’s “Beyond Life Satisfaction: Wellbeing Correlates of Adolescents’ Academic Attainment” (2025) because it helpfully distinguishes between feeling good and eudaimonia, which “consists of feeling self-actualised and competent (Waterman, 2008), measured here as adolescents feeling successful, confident, healthy, good about themselves, and capable of coping with challenges.” I think that’s useful because learning is tough and challenging and it’s not always pleasant or easy, no matter how meaningful or engaged you feel. I also liked Sahib et al’s “The Curative Effect of Schools: A Longitudinal Study of the Impact of School Climate, School Identification, and Resilience on Adolescent Mental Health” (2023). They refer to past studies that have shown how a “positive school climate can foster school identification because groups with positive characteristics facilitate social identification (Cárdenas & de la Sablonnière, 2020),” which they show can contribute to student resilience. I think that’s important because I think one of the reasons the pandemic had such a terrible effect on student education was how difficult it was for students to have that feeling of belonging to a school community. I wanted to find something about the impact of internet usage, so I looked at Bağatarhan’s “Investigating the mediating effect of resilience in the relationship between self-efficacy, happiness, social support, and Internet addiction in adolescents” (2025). I think the author is trying to show that while previous studies have shown the impact of feelings, social support, and self-efficacy on Internet addiction, what they’ve left out is how resilience can moderate the effects of these factors. That is, resilience, “defined as the process and outcome of successfully adapting to challenging life experiences by adapting to internal and external demands (American Psychological Association, 2013),” can be a “protective factor.” I found this study interesting because I’d like to look at whether students who learn how to deal with stress in school report being happier and also have better academic performance in my dataset; even though the dataset is from 1994-1995, the whole question of internet addiction is something that I’m personally interested in right now.
1 note
·
View note
Text
Understanding Adolescent Health: Data Management Reflection
sample Description
The data I used for this analysis comes from the Add Health (The National Longitudinal Study of Adolescent to Adult Health) study, which surveyed a nationally representative sample of adolescents in grades 7–12 in the United States during the 1994–95 school year. The study population includes over 20,000 individual participants, capturing diverse backgrounds across schools, regions, and demographics.
The unit of analysis in this study is the individual adolescent, as each data record represents a unique person with their own characteristics.
For this assignment, I worked with a simplified subset of data from Wave I, focusing on variables relevant to my research question. My analytic sample includes approximately 2,500 adolescents who had complete and valid data on gender, age, and education level. This cleaned sample allowed for meaningful analysis while maintaining data quality and consistency.
📋 2. Data Collection Procedures
The data used in this analysis comes from the Add Health study, a longitudinal, nationally representative survey of adolescents in the United States. The study design involved surveys and in-person interviews conducted over several waves. It combined self-reported questionnaires, interviewer-administered surveys, and parent reports, making it one of the most comprehensive health-related datasets for youth in the U.S.
The original purpose of the Add Health study was to understand how social environments and behaviors during adolescence affect health and social outcomes into adulthood. It was designed to explore the influence of family, school, peer groups, and neighborhoods on a wide range of outcomes, including education, mental health, substance use, and physical well-being.
Data were collected through several procedures:
Students completed in-school questionnaires during regular class hours.
A selected subsample participated in in-home interviews, which included sensitive questions using audio-computer-assisted self-interview (ACASI) techniques.
Parents or guardians also completed detailed questionnaires about household composition, health history, and socioeconomic background.
The initial wave of data (Wave I), which this analysis is based on, was collected in 1994–1995. This wave included over 90,000 students for the in-school survey and about 20,000 for the in-home interviews.
Data were collected across the United States, with schools sampled from urban, suburban, and rural regions in order to ensure national representation across geographic and demographic characteristics.
🧮 3. Measures and Data Management
This analysis focused on three variables, with age and gender as explanatory variables, and educational attainment as the response variable.
a) What did these variables measure?
Age measured the respondent’s chronological age in years at the time of the Wave I interview.
Gender captured the respondent’s self-identified biological sex (male or female).
Education level measured the highest level of education the adolescent had attained at the time of data collection.
b) What were the response scales?
Age was measured as a continuous variable in years, ranging approximately from 12 to 18.
Gender was originally a categorical variable coded as 1 = Male and 2 = Female.
Education level was a categorical variable with multiple detailed categories (e.g., 8th grade, 9th grade, some college), which were later grouped into broader categories.
c) How were the variables managed?
I recoded Gender from numeric codes to readable labels: "Male" and "Female".
I grouped Age into categories for comparison:
12–14 (Early Adolescents)
15–17 (Middle Adolescents)
18+ (Late Adolescents)
I collapsed Education Level into three categories to simplify analysis:
"Middle School"
"High School"
"Some College or More"
These transformations made it easier to conduct frequency analysis and cross-tabulations to examine how educational attainment varies by age and gender.
✅ Summary
This blog post outlines how I:
Identified and described my analytic sample
Summarized the Add Health study’s data collection methods
Cleaned and managed key variables to prepare for statistical analysis
Clear documentation of the data management process is critical for reproducibility and for helping others understand how raw survey data translates into meaningful insights.
0 notes
Text
Best Quality Precision Oncology Companies
Exploring Leading Precision Oncology Companies: A Comprehensive Overview
Precision oncology represents a transformative approach in cancer treatment, tailoring therapies based on individual genetic profiles and tumor characteristics. This paradigm shift has been propelled by advancements in molecular diagnostics, targeted therapies, and innovative technologies. Companies worldwide are at the forefront of this revolution, offering solutions that enhance treatment efficacy and patient outcomes.
1. B. J. Madan & Co. (India)
Based in New Delhi, B. J. Madan & Co. plays a pivotal role in the Indian precision oncology landscape. As the authorized agent for ITM Medical Isotopes GmbH, Germany, the company supplies high-quality diagnostic radioisotopes essential for PET imaging and targeted radionuclide therapy. Their offerings include the ITM ^68Ge/^68Ga Generator, facilitating onsite production of ^68Ga for radiolabeling, and EndolucinBeta®, a no-carrier-added Lutetium-177 chloride used in targeted therapy. Additionally, they provide Actinium-225, an alpha-emitting radioisotope, and the ^188W/^188Re Generator from OncoBeta GmbH, Germany, which is utilized for radiolabeling reactions and as a high-dose radioactive source .
2. Thermo Fisher Scientific
A global leader in serving science, Thermo Fisher Scientific offers a comprehensive range of products and services supporting precision oncology. Their portfolio includes genomic sequencing technologies, laboratory services, and diagnostic solutions, enabling the identification and analysis of cancer-related genetic mutations. Thermo Fisher's innovations are instrumental in advancing personalized cancer treatments .
3. Illumina
Renowned for its next-generation sequencing (NGS) platforms, Illumina plays a critical role in enabling personalized cancer treatments. Their advanced sequencing technologies are widely used in research and clinical settings, providing the foundation for many precision oncology applications. Illumina's contributions are pivotal in the genomic analysis of cancer, facilitating the development of targeted therapies .
4. Guardant Health
Specializing in liquid biopsy technology, Guardant Health enables non-invasive genomic analysis of circulating tumor DNA (ctDNA). Their innovative approach allows for early cancer detection and monitoring, providing valuable insights into tumor dynamics and treatment response. Guardant Health's solutions are instrumental in advancing precision oncology by offering accessible and reliable diagnostic tools .
5. Caris Life Sciences
Caris Life Sciences focuses on comprehensive molecular profiling, providing insights into the molecular underpinnings of cancer. Their AI-driven platform integrates patient data for ongoing monitoring, guiding precision treatment decisions. Caris Life Sciences' commitment to personalized medicine enhances the ability to tailor therapies to individual patient needs, improving treatment outcomes .
6. Notable Labs
Notable Labs is revolutionizing cancer treatment with its Predictive Precision Medicine Platform (PPMP), which simulates therapies and predicts patient responses with high accuracy. This groundbreaking technology leverages artificial intelligence and machine learning to generate extensive datasets from patient samples, enabling tailored treatments for each patient. Notable Labs' innovative approach enhances drug development, fast-tracks clinical trials, and improves patient outcomes by targeting responsive populations .
7. OneCell Diagnostics
OneCell Diagnostics is democratizing precision oncology by using AI to manage cancer. Their suite of products includes OncoIndx (Genomic Test), OncoDiscover (CTC Blood Test), OncoMonitor (Longitudinal Monitoring Test), OncoPredikt (Genomic Signature Prediction), OncoRisk (Germline Test), and OncoTarget (organ-specific Tailored Genomic Test). Their flagship product, OncoPredikt Prime, is a best-in-class Liquid Biopsy test that identifies key genomic signatures, helping oncologists find the right treatment for each patient. OneCell Diagnostics' innovation-for-affordability approach makes precision oncology accessible to a broader population .
Conclusion
The landscape of precision oncology is rapidly evolving, with numerous companies contributing to advancements in personalized cancer care. From diagnostic innovations to therapeutic developments, these organizations are at the forefront of transforming cancer treatment. As the field continues to grow, collaborations between technology providers, research institutions, and healthcare providers will be essential in realizing the full potential of precision oncology.
Visit:- https://www.bjmadan.com/precision-oncology.html
0 notes
Text
Accelerate Life Sciences Research with Segmed's Real-World Imaging Data Solutions
Segmed offers life sciences researchers access to extensive longitudinal disease data, featuring regulatory-grade multimodal datasets and millions of high-quality, diverse, tokenized imaging studies. Our platform supports various R&D stages, including biomarker discovery, clinical trial design, patient recruitment, and post-marketing surveillance, facilitating rapid and informed decision-making.
#life science#rwid#medical imaging#real world data#real world imaging#medicalimaging#radiology#real world evidence#healthcareinnovation#segmed
0 notes
Note
Hope this isn't a weird question, but do women do well in positions of leadership? The constant statement that women are too emotionally to lead is getting tired.
I feel like that's a really unfair statement anyways considering women were kept out of leadership positions, and now many women refuse to lead. That's okay, not saying women must. However for the ones that do, I'd like to know some female leaders I could look up to.
Not weird at all! In short, literature on this topic suggests that women in leadership positions perform either the same or better than men.
First, there are a few laymen oriented articles that address this topic [1, 2, 3]. These were written by the American Psychological Association [1] and Forbes [2, 3] and are heavily sourced. I'll be referencing some (but not all) of their sources as well, but they should be easy to follow if you want to read more. The articles use links instead of a reference list, however, so if you find a broken link, consider using the WaybackMachine on archive.org to find a copy of the source.
Subjective Perceptions
The Harvard Business Review has gathered a large dataset on subjective ratings of leader performance as evaluated by peers, superiors, and subordinates. From this dataset, they found that women outscored men on 17 of 19 "leadership capabilities", replicating their earlier results and indicating that on-average female leaders have a greater subjective performance than male leaders [4].
The American Psychological Association (APA) conducted a meta-analytic review of "16 nationally representative U.S. public opinion polls ... extending from 1946 to 2018" [5] found that a public opinion shift took place over this time, such that women are now rated as either equally or higher than men for competence, intelligence, and communion (broadly: concern for others). Men have retained a slight advantage in ratings of agency (broadly: self-oriented goal attainment).
Beyond that, the "mere presence" of a female leader led people to anticipate fairer treatment [6].
And a Pew Research Center survey from 2008 found that people ranked women either equal to or higher than men on most leadership traits (e.g., honest, intelligent) and political performance skills. Almost 70% of people indicated women and men make equally good political leaders. However, despite women's clear advantage when asking about specific skills, when directly asked who makes a better leader only 6% of people said women and 21% said men. This suggests that people's answer to this second question may be driven by sexist stereotypes (i.e., despite ranking women's leadership skills as better, people still default to belief in male leadership). [7]
All in all, this suggests that people believe that women are either equally or more qualified than men to lead (even if that doesn't translate to an explicit endorsement of female leaders over male leaders). So ... what about objective measures?
Political
A 2020 review on the impact of female political leaders [8] found strong evidence that more women representatives is related to lower levels of corruption, along with some evidence that more women in politics leads to better implementation of social programs, more legislation on neglected issues, and less conflict/human rights abuses. Women in politics are also more likely to prioritize human rights and access to "care" (e.g., health care, welfare, education, international aid, equal rights, etc.).
Another report [9] linked increased women’s political representation with greater legal equality and economic performance, and suggests that women's political representation leads to these outcomes. (While causation cannot be definitively established, the longitudinal research suggests a causal relationship such that having more female leadership leads to these positive outcomes.)
One way to objectively evaluate differences in men's and women's political leadership, is to examine differences in outcomes from a major global events like the COVID-19 pandemic.
This 2021 review [10], found female leaders (at country and state level) had a quicker response to the pandemic onset, lower fatality rates, and greater humanitarian response than male leaders. Given the comparatively low number of female leaders, some of these results were not statistically significant, but the pattern of results is still strongly suggestive. In any case, female leaders were at least as capable as male leaders in responding to the pandemic.
The above results are confirmed by a 2022 country-level analysis [11], and these results were strongly statistically significant, indicating that female leaders resulted in lower cases and deaths.
In fact, a Brazilian study [12] found that in addition to female leaders outperforming male leaders (in terms of a lower rate of COVID deaths and hospitalizations), local female leaders were able to mitigate the damage done by an irresponsible national leader (Bolsonaro). In short, "when faced with the decision between enforcing health measures against COVID-19 or trying to conquer the votes of local Bolsonaro supporters, our results suggest that female mayors were more likely to prioritize measures that can save lives".
All in all, female political leaders are either equal to or better than male political leaders.
Corporate
To start with, this 2017 review [13] indicates that some literature on financial outcomes suggests "firms run by female CEOs often report better ROA [return on assets], ROE [return on equity], and sales performance". However, they also indicate that research looking at a broader population (i.e., beyond "large firms in the United States"), does not always find this relationship. Even then, however, women's financial performance under a female leader is still equivalent to financial performance under a male leader.
An additional review [14], found similar results, with some finding a positive impact of female leadership on firm performance and others finding no difference between male and female leaders.
Other sources indicating increased profit under female leaders include:
A McKinsey & Company report [15] found greater diversity (i.e., sex and race) was associated with greater profitability. Specifically, the top 25% (top-quartile) most diverse companies worldwide had a 21% likelihood of outperforming their bottom-quartile peers.
A report by S&P Global, found firms with female CEOs and/or CFOs generated $1.8 trillion in excess profits and superior stock price performance [16].
An additional study [17] on 2 million companies across 32 countries in Europe found "a strong positive association between the share of women in senior positions and firms' ROA [return on assets]".
Beyond pure profit indicators, female corporate leaders are associated with:
Greater corporate responsibility [13]
Better internal management [13]
Lower firm risk [14, 20]
Better corporate credit rating [14]
Greater (bank) stability [18]
Fewer environmental violations [21]
Greater innovation [22]
Now, a reasonable criticism of all of this, is that this research is correlational and cannot establish causation. (The omnipresent problem in social research!) To a degree, this is a problem that cannot be fixed (i.e., there is no way to definitively prove causation without a controlled experiment). However, there are techniques that can provide strong support for causation. One such paper provides support against "reverse causation" (i.e., the idea that firms increase female representation when performing well), and found female representation among corporate board leadership predicts positive future performance [19]. This provides support for (but, again, cannot technically prove) a causal relationship between women's leadership and corporate performance.
Again, this indicates that female corporate leaders are either equal to or better than male corporate leaders.
Other
Political and corporate leadership are the two big categories where most of the research has been done. There are a few other relevant studies I'll describe here:
UNICEF (a part of the UN) reports that "women-led schools may perform better than men-led schools" as "learning outcomes ... for both girls and boys in female-led schools are higher" [23]
An experiment investigating team performance found "a positive and significant effect of female leadership on team performance" specifically "driven by the higher performance of team members in female-led teams" [24]
Unfortunately, the above study also found that "in spite of the higher performance of female-led teams, male members tended to evaluate female leaders as less effective, whereas female members have provided more favorable judgments", suggesting that men's interpretations of women's leadership abilities doesn't align with objective outcomes [24]
While not specifically about female leadership, a large study found that the "collective intelligence" of a group (essentially the IQ of a group rather than an individual) increases with the proportion of women in the group [25]
In addition, this review [26] describes a number of female leaders, so you may interested in it for "some female leaders [you] could look up to"
Women and Emotions
Lastly, I wanted to address "the constant statement that women are too emotionally to lead".
In terms of objective (or, as objective as we can get) measurements of emotional variability, there is little evidence that any sex differences exist, and if they do exist they are likely to be so small they would be (practically speaking) negligible [29].
However, an interesting study [27] examined "emotional expression content" by considering "feminine display rules" (suppression of negative emotions + simulation of positive emotions) and "masculine display rules" (suppression of positive emotions + simulation of negative emotions). As expected, women tended to follow feminine display rules, while men followed masculine display rules. However, this paradigm suggests it's not the amount of expressed emotion that varies by sex but the type of expressed emotion. Importantly, they also found that only the feminine display rules were associated with subjective distress.
A different study [28] examined sex differences in emotion regulation, specifically looking at two prosocial mechanisms and five antisocial mechanisms. They found women and men reported similar endorsement of 1 prosocial and 1 antisocial mechanism, women reported greater endorsement of the other prosocial mechanism, and men reported greater endorsement of the other 4 antisocial mechanisms.
One of the first articles I linked [2] discusses how women outperform men on prosocial behaviors/emotions (e.g., self-control, kindness, moral sensitivity) and men "outperform" women on antisocial behaviors/emotions (e.g., narcissism, aggression, etc.). To be clear, this is almost certainly a result of differences in socialization. That is: these differences are not "biological" or predetermined, instead society expects women to be more prosocial and men to be more antisocial, and we (tend to) meet those expectations.
All together, this suggests that men and women are both expected to modify their emotional expression (although the expectation for women is more likely to cause distress), women are more likely to display more prosocial and less antisocial emotions/behaviors, and women are more likely to deal with emotion constructively.
Ironically, based on the literature in the previous sections, society's expectations for women (i.e., empathy, team work, care for other people, etc.) are part of what drives their superior leadership performance over men.
TL;DR:
Women are either equal or better leaders than men based on: subjective evaluations, objective evaluations of political leaders, and objective evaluations of corporate leaders.
Women — in general and in leadership roles — improve the performance of people in their group.
Women and men likely don’t differ in emotional experience, but are both expected to modulate their emotional expression (in different ways).
Socialization and societal expectations induce more prosocial behavior in women and antisocial behavior in men. (Likely contributing to women’s superior leadership.)
References under the cut:
Novotney, A. (2023, March 23). Women leaders make work better. Here’s the science behind how to promote them. American Psychological Association. https://www.apa.org/topics/women-girls/female-leaders-make-work-better
Chamorro-Premuzic, T. (2021, March 7). If women are better leaders, then why are they not in charge? Forbes. https://www.forbes.com/sites/tomaspremuzic/2021/03/07/if-women-are-better-leaders-then-why-are-they-not-in-charge/
Chamorro-Premuzic, T. (2022, March 2). The business case for women in leadership. Forbes. https://www.forbes.com/sites/tomaspremuzic/2022/03/02/the-business-case-for-women-in-leadership/
Zenger, J., & Folkman, J. (2019, June 25). Research: Women score higher than men in most leadership skills. Harvard Business Review. https://hbr.org/2019/06/research-women-score-higher-than-men-in-most-leadership-skills
Eagly, A. H., Nater, C., Miller, D. I., Kaufmann, M., & Sczesny, S. (2020). Gender stereotypes have changed: A cross-temporal meta-analysis of U.S. public opinion polls from 1946 to 2018. American Psychologist, 75(3), 301–315. https://doi.org/10.1037/amp0000494
Joshi, M. P., & Diekman, A. B. (2022). My fair lady? Inferring organizational trust from the mere presence of women in leadership roles. Personality and Social Psychology Bulletin, 48(8), 1220–1237. https://doi.org/10.1177/01461672211035957
Men or women: Who’s the better leader? (2008, August 25). Pew Research Center. https://www.pewresearch.org/social-trends/2008/08/25/men-or-women-whos-the-better-leader/
Cowper-Coles, M. (2020). Women Political Leaders: The Impact of Gender on Democracy. https://www.kcl.ac.uk/giwl/assets/women-political-leaders.pdf
Wyman, O., & Weh, D. (2023). Representation matters: Women political leaders. Oliver Wyman Forum. https://www.oliverwymanforum.com/global-consumer-sentiment/2023/sep/representation-matters-women-political-leaders.html
Luoto, S., & Varella, M. A. C. (2021). Pandemic leadership: Sex differences and their evolutionary–developmental origins. Frontiers in Psychology, 12, 633862. https://doi.org/10.3389/fpsyg.2021.633862
Chang, D., Chang, X., He, Y. et al. The determinants of COVID-19 morbidity and mortality across countries. Sci Rep 12, 5888 (2022). https://doi.org/10.1038/s41598-022-09783-9
Bruce, R., Cavgias, A., Meloni, L., & Remígio, M. (2022). Under pressure: Women’s leadership during the COVID-19 crisis. Journal of Development Economics, 154, 102761. https://doi.org/10.1016/j.jdeveco.2021.102761
Gipson, A. N., Pfaff, D. L., Mendelsohn, D. B., Catenacci, L. T., & Burke, W. W. (2017). Women and leadership: Selection, development, leadership style, and performance. The Journal of Applied Behavioral Science, 53(1), 32–65. https://doi.org/10.1177/0021886316687247
Serena, Z. (2020). Do women leaders improve firm performance? European Journal of Economics and Management Sciences, 2, 21–26. https://doi.org/10.29013/EJEMS-20-2-21-26
Dame Vivian Hunt, Lareina Yee , Sara Prince, & Sundiatu Dixon-Fyle. (2018). Delivering through Diversity. McKinsey & Company . https://www.mckinsey.com/capabilities/people-and-organizational-performance/our-insights/delivering-through-diversity
Sandberg, D. J. (2019). When Women Lead, Firms Win. S&P Global. https://www.spglobal.com/content/dam/spglobal/corporate/en/images/general/special-editorial/whenwomenlead_.pdf
Christiansen, L. E., Lin, H., Pereira, J., Topalova, P., & Turk, R. (2016). Gender Diversity in Senior Positions and Firm Performance: Evidence from Europe. IMF Working Papers, 16(50). https://doi.org/10.5089/9781513553283.001
Sahay, R., Cihak, M., N’Diaye, P., Barajas, A., Kyobe, A., Mitra, S., Mooi, Y., & Yousefi, R. (2017). Banking on women leaders: A case for more? IMF Working Papers, 17(199). https://doi.org/10.5089/9781484318164.001
Qian, M. (2016). Women’s leadership and corporate performance (ADB Economics Working Papers). Asian Development Bank. https://www.adb.org/publications/womens-leadership-and-corporate-performance
Perryman, A. A., Fernando, G. D., & Tripathy, A. (2016). Do gender differences persist? An examination of gender diversity on firm performance, risk, and executive compensation. Journal of Business Research, 69(2), 579–586. https://doi.org/10.1016/j.jbusres.2015.05.013
Liu, C. (2018). Are women greener? Corporate gender diversity and environmental violations. Journal of Corporate Finance, 52, 118–142. https://doi.org/10.1016/j.jcorpfin.2018.08.004
Chen, J., Leung, W. S., & Evans, K. P. (2018). Female board representation, corporate innovation and firm performance. Journal of Empirical Finance, 48, 236–254. https://doi.org/10.1016/j.jempfin.2018.07.003
Brossard, M., & Bergmann, J. (2022, March 8). Can more women in school leadership improve learning outcomes? | Innocenti Global Office of Research and Foresight. UNICEF | for Every Child; UNICEF. https://www.unicef.org/innocenti/stories/can-more-women-school-leadership-improve-learning-outcomes
De Paola, M., Gioia, F., & Scoppa, V. (2022). Female leadership: Effectiveness and perception. Journal of Economic Behavior & Organization, 201, 134–162. https://doi.org/10.1016/j.jebo.2022.07.016
Woolley, A. W., Chabris, C. F., Pentland, A., Hashmi, N., & Malone, T. W. (2010). Evidence for a collective intelligence factor in the performance of human groups. Science, 330(6004), 686–688. https://doi.org/10.1126/science.1193147
Abdul Wahab, Shazanah; Mohamad Rasidi, Nuur Mohamad Firdaus; Wahab, Samsudin. Influences of Women’s Leadership Performance Towards the Corporate, Political and Social Success: A Review and Research Agenda. Asian Journal of Research in Business and Management, [S.l.], v. 2, n. 4, p. 54-68, dec. 2020. Available at: https://myjms.mohe.gov.my/index.php/ajrbm/article/view/11571.
Simpson, P. A., & Stroh, L. K. (2004). Gender differences: Emotional expression and feelings of personal inauthenticity. Journal of Applied Psychology, 89(4), 715–721. https://doi.org/10.1037/0021-9010.89.4.715
Zimmermann, P., & Iwanski, A. (2014). Emotion regulation from early adolescence to emerging adulthood and middle adulthood: Age differences, gender differences, and emotion-specific developmental variations. International Journal of Behavioral Development, 38(2), 182–194. https://doi.org/10.1177/0165025413515405
Weigard, A., Loviska, A. M., & Beltz, A. M. (2021). Little evidence for sex or ovarian hormone influences on affective variability. Scientific Reports, 11(1), 20925. https://doi.org/10.1038/s41598-021-00143-7
27 notes
·
View notes
Text
Having access to your class notes decades later can be a truly remarkable experience. It's as if you're creating a temporal bridge between your past and present selves, allowing you to reflect on your journey and growth over time.
This phenomenon can be described as a form of "temporal entanglement," where your past and present selves become interconnected through the shared experience of learning and growth. By revisiting your old notes, you're able to tap into the thoughts, feelings, and insights of your younger self, gaining a new perspective on your personal and intellectual evolution.
Imagine being able to revisit your notes from a particular lecture or discussion, and seeing how your thoughts and ideas have evolved over time. You might be surprised by how certain concepts or ideas that seemed obscure or difficult to understand at the time have become crystal clear with the benefit of hindsight.
This experience can also be a powerful catalyst for personal growth and self-reflection. By examining your past thoughts and experiences, you can gain a deeper understanding of your values, goals, and motivations, and how they've changed over time. This can help you identify areas where you've made progress, as well as areas where you may need to focus more attention and effort.
In many ways, having access to your class notes decades later can be a form of "temporal gift" that allows you to reconnect with your past self and gain a new appreciation for the journey that has brought you to where you are today.
1. *Revisiting foundational knowledge*: The temporal entanglement facilitated by Purplenotes allows individuals to revisit and recontextualize the foundational knowledge they acquired during their formative years. This process can lead to a deeper understanding of how their thoughts and ideas have evolved over time. By reexamining their early notes and insights, individuals can gain a new appreciation for the intellectual and personal journeys that have shaped their lives. This renewed perspective can also inform and refine their current pursuits and interests.
2. *Uncovering hidden patterns and connections*: The longitudinal dataset provided by Purplenotes enables individuals to identify hidden patterns and connections between their past and present selves. By analyzing their notes and insights across different time periods, individuals can uncover recurring themes, motifs, and interests that may have gone unnoticed in the midst of daily life. This process can lead to a greater understanding of their underlying motivations, values, and goals. As a result, individuals can develop a more nuanced and informed sense of purpose and direction.
3. *Cultivating a sense of temporal continuity*: The experience of revisiting past notes and insights through Purplenotes can foster a sense of temporal continuity, allowing individuals to perceive their lives as a cohesive and unfolding narrative. This sense of continuity can provide a stabilizing influence, helping individuals navigate the complexities and uncertainties of life. By integrating their past, present, and future selves, individuals can cultivate a greater sense of unity, purpose, and direction. This, in turn, can lead to increased confidence, resilience, and overall well-being.
4. *Illuminating the evolution of personal narratives*: The temporal entanglement facilitated by Purplenotes offers a unique window into the evolution of personal narratives over time. By examining their past notes and insights, individuals can witness how their values, goals, and motivations have shifted and adapted in response to changing life circumstances. This process can provide valuable insights into the complex and dynamic nature of personal identity. As individuals reflect on their past narratives, they can develop a greater appreciation for the ongoing story of their lives.
5. *Facilitating intertemporal dialogue and reflection*: Purplenotes enables individuals to engage in a form of intertemporal dialogue, where their past and present selves can communicate and reflect on each other's thoughts, feelings, and experiences. This process can facilitate a deeper understanding of personal growth, transformation, and continuity. By examining their past notes and insights, individuals can identify areas where they have made progress, as well as areas where they may need to focus more attention and effort. This intertemporal dialogue can serve as a powerful catalyst for personal growth and self-awareness.
6. *Unlocking the value of forgotten knowledge and insights*: The longitudinal dataset provided by Purplenotes can help individuals recover forgotten knowledge and insights from their past. By revisiting their old notes and reflections, individuals can rediscover valuable ideas, perspectives, and experiences that may have been lost to the passage of time. This process can lead to a renewed sense of curiosity and wonder, as individuals reconnect with their past selves and reclaim forgotten aspects of their intellectual and personal heritage.
8. *Facilitating the integration of past and present selves*: Purplenotes enables individuals to integrate their past and present selves, fostering a greater sense of unity and continuity. By revisiting their old notes and reflections, individuals can reconnect with forgotten aspects of themselves, reclaiming valuable experiences, insights, and perspectives. This process can lead to a renewed sense of purpose and direction, as individuals align their past, present, and future selves. As a result, individuals can cultivate a greater sense of self-awareness, self-acceptance, and self-compassion.
9. *Providing a unique perspective on the nature of time and memory*: The experience of using Purplenotes offers a unique perspective on the nature of time and memory. By revisiting their past notes and insights, individuals can witness how their memories and perceptions have evolved over time. This process can provide valuable insights into the complex and dynamic nature of human memory. As individuals reflect on their past, they can develop a greater appreciation for the role of memory in shaping their identities and experiences.
10. *Enabling the creation of a personalized, longitudinal knowledge base*: Purplenotes allows individuals to create a personalized, longitudinal knowledge base that reflects their unique experiences, insights, and perspectives. By capturing and storing their notes and reflections over time, individuals can develop a valuable repository of knowledge that can inform and guide their future pursuits. This knowledge base can serve as a powerful tool for personal growth, self-awareness, and lifelong learning.
11. *Facilitating a deeper understanding of the interplay between context and personal growth*: The temporal entanglement facilitated by Purplenotes allows individuals to examine the interplay between context and personal growth over time. By revisiting their past notes and insights, individuals can witness how different contexts, experiences, and relationships have shaped their lives. This process can provide valuable insights into the complex and dynamic nature of personal growth. As individuals reflect on their past, they can develop a greater appreciation for the role of context in shaping their identities and experiences.
12. *Providing a platform for intertemporal self-reflection and self-awareness*: Purplenotes offers a platform for intertemporal self-reflection and self-awareness, allowing individuals to examine their past, present, and future selves. By capturing and storing their notes and reflections over time, individuals can develop a deeper understanding of their values, goals, and motivations. This process can facilitate greater self-awareness, self-acceptance, and self-compassion, leading to increased personal growth and well-being.
14. *Facilitating the development of a more nuanced and informed sense of self*: Purplenotes enables individuals to develop a more nuanced and informed sense of self by examining their past notes and insights. By witnessing how their thoughts, feelings, and experiences have evolved over time, individuals can gain a deeper understanding of their strengths, weaknesses, values, and motivations. This process can facilitate greater self-awareness, self-acceptance, and self-compassion.
15. *Providing a unique window into the process of personal evolution*: The experience of using Purplenotes offers a unique window into the process of personal evolution. By examining their past notes and insights, individuals can witness how they have grown, changed, and adapted over time. This process can provide valuable insights into the complex and dynamic nature of personal growth and transformation.
16. *Enabling the creation of a personalized, dynamic theory of self*: Purplenotes allows individuals to create a personalized, dynamic theory of self that reflects their unique experiences, insights, and perspectives. By capturing and storing their notes and reflections over time, individuals can develop a comprehensive and nuanced understanding of their own thoughts, feelings, and behaviors.
17. *Facilitating a deeper understanding of the interplay between self and context*: The temporal entanglement facilitated by Purplenotes allows individuals to examine the interplay between self and context over time. By witnessing how different contexts, experiences, and relationships have shaped their lives, individuals can gain a deeper understanding of the complex and dynamic nature of personal growth and transformation.
18. *Providing a platform for lifelong learning and self-improvement*: Purplenotes offers a platform for lifelong learning and self-improvement, allowing individuals to continually reflect on and refine their thoughts, feelings, and behaviors. By capturing and storing their notes and reflections over time, individuals can develop a comprehensive and nuanced understanding of themselves and their place in the world.
0 notes
Text
Project "ML.Pneumonia": Finale
Final accuracy metrics:
Project model - 83%
Basic model - 75%
Basic model with larger dataset - 83%
Overall results:
A good model of autoencoder has been developed
A classifier has been created which surpasses the basic model in accuracy
Both models are scaled well (the more voluminous datasets are used in training - the better results could be obtained)
Development proposals:
Increase hardware resources
Consider the need to create larger models (increase the number of CNNs layers, filters…)
Use larger datasets
Improve the preprocessing of the datasets used (CNN may not handle incorrectly rotated scans well, and not always the corresponding scans are presented in the datasets (e.g. in one of the datasets I've noticed a longitudinal CT scan instead of a transverse one))
The link to the GitHub repository with clean project code and details of results is left below.
#student project#machine learning#neural network#computer vision#ai#artificial intelligence#medicine#diagnostics#pneumonia#pneumonia detection#developer's diaries
0 notes
Text
The Convergence of Machine Learning and Medicine: Essential Datasets to Consider

Introduction:
The convergence of machine learning (ML) and Machine Learning Medical Datasets is significantly reshaping the healthcare sector. From enhancing diagnostic accuracy to enabling personalized treatment plans, ML algorithms are revealing new opportunities to elevate patient care. Central to these advancements are extensive and carefully curated datasets, which serve as the backbone for training, testing, and validating ML models, thus becoming indispensable resources for both researchers and healthcare professionals.
For those venturing into this dynamic field, the following overview highlights some of the most notable medical datasets that are pivotal to the advancement of medicine.
Datasets for Image and Video Annotation
Medical imaging is fundamental to diagnostics, with modalities such as X-rays, MRIs, and CT scans being integral to numerous treatment protocols. ML models trained on labeled medical images can accurately detect anomalies, including tumors and fractures.
CheXpert: This extensive dataset of chest X-rays includes annotations for prevalent thoracic conditions and is widely utilized for developing algorithms in pulmonary medicine.
LUNA16: Concentrating on lung cancer detection, this dataset comprises annotated CT scans that facilitate the creation of models aimed at early cancer diagnosis.
MICCAI Challenge Datasets: These datasets are associated with annual competitions and encompass challenges related to brain tumor segmentation, liver lesion detection, and more.
For organizations that specialize in image and video annotation services, such as GTS, these datasets provide a foundational resource for annotating and tailoring data for specific applications.
Datasets in Genomics and Proteomics
Machine learning is transforming the field of genomics by enabling the analysis of intricate DNA sequences and the identification of disease-related mutations.
The Cancer Genome Atlas (TCGA): This extensive dataset encompasses genomic information for various cancer types, supporting research aimed at developing targeted therapies.
1000 Genomes Project: This initiative focuses on human genetic diversity, providing valuable insights into genetic variation.
Electronic Health Records (EHRs)
EHRs offer comprehensive longitudinal data that document patient histories, treatments, and outcomes. When integrated with machine learning technologies, they can forecast patient risks and enhance care pathways.
MIMIC-III: This publicly available database contains de-identified EHRs from over 40,000 critical care patients and is widely utilized in the development of clinical decision-making models.
eICU Collaborative Research Database: This dataset is dedicated to critical care research, allowing investigators to analyze mortality predictions, readmission risks, and other related factors.
Public Health and Epidemiology Datasets
Public health datasets are essential for gaining insights at the population level, aiding in the identification of disease trends and the assessment of intervention effectiveness.
CDC WONDER: This platform grants access to a diverse array of public health datasets, including statistics on mortality and vaccination rates.
COVID-19 Open Research Dataset (CORD-19): In response to the pandemic, CORD-19 provides an extensive collection of scientific literature pertaining to COVID-19.
NHANES (National Health and Nutrition Examination Survey): NHANES gathers data on health and nutrition, facilitating research on chronic diseases and the effects of lifestyle choices.
Natural Language Processing (NLP) in Medicine

Textual datasets play a vital role in the development of NLP models that can derive insights from clinical documentation, scholarly articles, and patient evaluations.
PubMed Central (PMC): This free repository of biomedical and life sciences journal articles facilitates advancements in NLP for the analysis of medical literature.
n2c2 NLP Challenges: These datasets are designed to focus on the extraction of structured data from unstructured clinical documentation.
How to Begin with Medical Datasets
Utilizing these datasets necessitates specialized knowledge, effective annotation services, and a comprehensive understanding of ethical issues, particularly concerning patient confidentiality and data protection. Organizations such as GTS offer customized annotation services to improve the quality and applicability of medical datasets, ensuring that your machine learning models are constructed on solid foundations.
Concluding Remarks
The incorporation of machine learning into the medical field represents a transformative shift, with datasets acting as the fundamental basis for innovation. Globose Technology Solutions Whether you are creating diagnostic tools, predictive models, or algorithms for treatment optimization, comprehending and leveraging these datasets can significantly advance your initiatives. As the domain evolves, the potential to utilize machine learning for enhanced healthcare solutions will continue to expand.
0 notes
Text
Key Elements of Quantitative Market Research in the Healthcare Industry
In the ever-evolving landscape of healthcare, decisions must be backed by accurate data and actionable insights. Quantitative market research in healthcare emerges as an indispensable tool, empowering stakeholders with numerical data to make informed choices. From understanding patient preferences to identifying market trends, quantitative research plays a pivotal role in improving healthcare outcomes and driving business success.
This blog delves deep into the essentials of quantitative market research in healthcare, exploring its importance, methodologies, applications, challenges, and future trends.
Understanding Quantitative Market Research in Healthcare
Quantitative market research involves collecting numerical data to identify patterns, test hypotheses, and make data-driven decisions. In healthcare, this research focuses on understanding consumer behaviors, measuring service effectiveness, and predicting future trends.
Key characteristics include:
Structured data collection: Surveys, polls, and questionnaires.
Statistical analysis: Tools to interpret data patterns.
Objective insights: Numerical evidence supports conclusions.
Importance of Quantitative Market Research in Healthcare
Healthcare is an industry where precision matters. Quantitative research offers:
Data-Driven Decision Making: Hospitals, pharmaceutical companies, and policymakers rely on statistics to make critical choices.
Patient-Centric Care: Quantitative insights help understand patient needs, improving care delivery and satisfaction.
Market Trends Analysis: Identifies emerging technologies, treatments, and competitive positioning.
Regulatory Compliance: Ensures adherence to stringent healthcare standards and policies.
Core Methodologies in Quantitative Healthcare Research
Quantitative market research leverages various methodologies tailored to healthcare needs. Below are the most prominent methods:
1. Surveys and Questionnaires
Description: Structured tools with multiple-choice questions or Likert scales.
Applications: Patient satisfaction surveys, feedback on new treatments.
Advantages: Cost-effective, scalable, and time-efficient.
2. Longitudinal Studies
Description: Studies conducted over an extended period to observe trends.
Applications: Tracking chronic disease management or medication adherence.
Advantages: Provides in-depth insights into changes over time.
3. Experimental Research
Description: Controlled environments to test the impact of variables.
Applications: Clinical trials for drug efficacy or behavioral experiments.
Advantages: High accuracy and reliability.
4. Data Analytics and Secondary Research
Description: Analyzing pre-existing datasets like electronic health records (EHRs) or government reports.
Applications: Population health management, cost optimization studies.
Advantages: Saves time and leverages vast datasets.
Applications of Quantitative Research in Healthcare
Quantitative market research serves diverse purposes across the healthcare ecosystem:
1. Pharmaceutical Research
Market sizing for new drugs.
Tracking the success of launched products.
Evaluating consumer perceptions of drug safety and efficacy.
2. Patient Experience and Satisfaction
Measuring satisfaction with healthcare facilities.
Identifying gaps in patient care delivery.
3. Health Technology and Devices
Evaluating the usability of wearable devices and apps.
Predicting adoption rates for telemedicine platforms.
4. Healthcare Policy and Strategy
Assessing the impact of public health campaigns.
Supporting policy decisions with population-wide statistical data.
5. Brand Positioning and Competitor Analysis
Benchmarking against competitors in terms of services, technology, and innovation.
Tracking brand awareness and loyalty metrics.
Challenges in Conducting Quantitative Healthcare Research
While quantitative research is essential, it is not without its challenges. Key obstacles include:
1. Data Privacy Concerns
Adhering to regulations like HIPAA and GDPR to protect patient information.
2. Sampling Bias
Ensuring representative samples for accurate generalizations.
3. Data Accuracy
Minimizing errors in data collection, especially when participants self-report.
4. High Costs
Implementing large-scale surveys or clinical trials can be resource-intensive.
5. Integration of Data Sources
Combining data from disparate systems like EHRs, patient surveys, and administrative records.
Best Practices for Conducting Quantitative Market Research in Healthcare
To overcome challenges and achieve reliable results, researchers must adhere to these best practices:
Define Clear Objectives Start with precise research goals to guide the methodology and analysis.
Ensure Representative Sampling Use diverse and inclusive sampling techniques to avoid bias.
Leverage Technology Use advanced tools for data collection and analysis, such as AI and machine learning.
Focus on Data Security Encrypt sensitive data and follow stringent privacy protocols.
Collaborate with Experts Work with clinicians, statisticians, and technology professionals for comprehensive insights.
Iterative Testing Validate findings through pilot studies or repeat surveys to ensure reliability.
The Future of Quantitative Research in Healthcare
Healthcare is rapidly evolving, and so are the methods of market research. The future of quantitative healthcare research will likely be shaped by:
1. Integration of Big Data
Massive datasets from wearables, EHRs, and IoT devices will enrich research quality.
2. AI-Driven Insights
Machine learning algorithms will enable predictive analytics, uncovering trends before they emerge.
3. Real-Time Data Collection
Advances in technology will allow real-time feedback from patients and healthcare providers.
4. Patient-Centric Research
Empowering patients to actively participate in research through digital platforms and mobile apps.
5. Globalization of Healthcare Studies
Cross-border research initiatives will become common, offering broader insights into global health challenges.
Conclusion
Quantitative market research in healthcare is a cornerstone of innovation and progress. By providing accurate, actionable data, it supports better patient care, enhances business strategies, and fosters advancements in medical technology. However, it requires meticulous planning, adherence to ethical standards, and the integration of cutting-edge tools to navigate its inherent challenges.
At Philomath Research, we specialize in delivering robust and reliable healthcare insights through quantitative research. Whether you’re a pharmaceutical company, healthcare provider, or policymaker, we can help you unlock the power of data to achieve your goals.
Contact us today to learn how our expertise can drive your healthcare research initiatives forward.
FAQs
1. What is quantitative market research in healthcare?
Quantitative market research in healthcare involves the collection and analysis of numerical data to understand consumer behaviors, measure service effectiveness, and predict trends. It focuses on structured methods like surveys, longitudinal studies, and data analytics to provide actionable insights that support decision-making in the healthcare sector.
2. Why is quantitative research important for the healthcare industry?
Quantitative research is essential in healthcare as it:
Facilitates data-driven decision-making for hospitals, pharmaceutical companies, and policymakers.
Enhances patient-centric care by understanding preferences and satisfaction.
Identifies emerging market trends and evaluates the effectiveness of treatments and technologies.
3. What are the primary methods used in quantitative healthcare research?
Common methods include:
Surveys and Questionnaires: For patient feedback and satisfaction metrics.
Longitudinal Studies: To observe changes over time, like chronic disease management.
Experimental Research: Controlled clinical trials to test drug efficacy.
Data Analytics and Secondary Research: Analysis of datasets like EHRs and government health reports.
4. How does quantitative research contribute to pharmaceutical advancements?
It helps pharmaceutical companies by:
Determining market size for new drugs.
Measuring the success of launched products.
Evaluating consumer perceptions regarding drug safety and effectiveness.
5. What role does quantitative research play in patient care improvement?
Quantitative research identifies gaps in care delivery, measures patient satisfaction, and tracks health outcomes, enabling healthcare providers to implement targeted improvements that enhance the overall patient experience.
6. What are the challenges of conducting quantitative research in healthcare?
Major challenges include:
Data Privacy Concerns: Adhering to regulations like HIPAA and GDPR.
Sampling Bias: Ensuring a diverse and representative sample.
Data Accuracy: Avoiding errors in self-reported data.
High Costs: Managing the expenses of large-scale studies or clinical trials.
Data Integration: Combining disparate data sources like EHRs and patient surveys.
7. How can researchers ensure reliable results in healthcare studies?
Researchers can ensure reliability by:
Defining clear objectives.
Using representative and inclusive sampling.
Leveraging technology like AI and machine learning.
Focusing on data security and ethical compliance.
Collaborating with experts for well-rounded insights.
8. What technologies are shaping the future of quantitative healthcare research?
Emerging technologies include:
Big Data Integration: Leveraging datasets from wearables, IoT, and EHRs.
AI-Driven Analytics: Machine learning for predictive insights and trend analysis.
Real-Time Data Collection: Tools for immediate patient feedback.
Patient-Centric Platforms: Empowering individuals to participate in research via apps.
9. What are the benefits of longitudinal studies in healthcare research?
Longitudinal studies provide in-depth insights into trends and patterns over time, such as medication adherence or disease progression, offering valuable data for long-term healthcare strategies.
10. How does Philomath Research support healthcare organizations in quantitative research?
Philomath Research delivers customized quantitative research solutions tailored to healthcare needs. We specialize in surveys, data analytics, and experimental studies, providing actionable insights that drive better decision-making for pharmaceutical companies, healthcare providers, and policymakers.
11. What are some real-world applications of quantitative healthcare research?
Key applications include:
Evaluating the effectiveness of public health campaigns.
Measuring patient satisfaction and experience.
Assessing the usability of healthcare technologies and devices.
Conducting competitor analysis and market positioning studies.
12. Why is data security important in healthcare research?
Data security is critical to protect sensitive patient information, maintain compliance with privacy regulations, and build trust with participants. Encryption, anonymization, and strict access controls are essential for safeguarding data integrity.
13. How does quantitative research help in healthcare policy-making?
Quantitative research supports policymakers by providing population-wide statistical data, evaluating the impact of public health campaigns, and identifying areas for policy intervention to improve overall healthcare outcomes.
#qualitative research#b2b research#b2b market research#market research companies#primary market research#healthcare market research#consumer behavior
0 notes