#parabolic SAR
Text
10 Forex Strategies for Scalping
Scalping is a popular trading strategy in the forex market, characterized by short-term trades aimed at capturing small price movements. This strategy requires quick decision-making, discipline, and a keen understanding of the market. In this article, we’ll explore 10 effective forex strategies for scalping that can help traders maximize their profits while minimizing risk.
1. Moving Average…
#Bollinger Bands#Candlestick Patterns#CCI#Crossovers#Divergence#Entry and Exit Points#Fibonacci Retracement#Forex#Forex Market#Forex Strategies#MACD#MACD Line#Momentum Indicator#Moving Average#Moving Average Convergence Divergence#Overbought Conditions#Oversold Conditions#Parabolic SAR#Pivot Points#Price Action#Price Movements#Relative Strength#RSI#Scalping#Scalping Strategy#Security#Signal Line#Stochastic Oscillator#Stop-Loss#Support And Resistance
0 notes
Text
PARABOLIC SAR (STOP AND REVERSE) INDICATOR
The Parabolic SAR (Stop and Reverse) indicator is a technical analysis tool that is used to determine the potential direction of an asset’s price movement. It is a popular tool among traders and investors as it helps them identify entry and exit points for trades.
The Parabolic SAR indicator plots points on a chart above or below an asset’s price. When the price is moving in an upward direction,…

View On WordPress
1 note
·
View note
Text
Understanding Forex Trend Indicators
In the world of foreign exchange trading, identifying the direction of a trend is crucial for making informed trading decisions. Forex trend indicators are tools that help traders determine whether a currency pair is trending upward, downward, or moving sideways. These indicators are fundamental for devising strategies and executing trades effectively. Let’s explore some of the most commonly used Forex trend indicators and how they can enhance your trading performance.

Moving Averages
Moving averages are among the most popular trend indicators. They smooth out price data to help identify the direction of the trend. The Simple Moving Average (SMA) calculates the average price over a specific number of periods, while the Exponential Moving Average (EMA) gives more weight to recent prices. By comparing different moving averages, such as the 50-period and 200-period, traders can identify potential buy or sell signals. When a shorter-term moving average crosses above a longer-term one, it may indicate an uptrend, while the opposite crossover could signal a downtrend.
Average True Range (ATR)
The Average True Range (ATR) measures market volatility rather than direction. However, understanding volatility is crucial for trend analysis. A higher ATR indicates increased volatility, which often accompanies strong trends. Traders use ATR to set stop-loss orders and to gauge the potential range of price movements. A rising ATR suggests that a trend may be gaining strength, whereas a declining ATR could indicate a potential reversal or weakening trend.
Moving Average Convergence Divergence (MACD)
The Moving Average Convergence Divergence (MACD) is a versatile indicator that combines moving averages with momentum analysis. It consists of two lines: the MACD line and the signal line. When the MACD line crosses above the signal line, it generates a bullish signal, suggesting the potential for an upward trend. Conversely, when the MACD line crosses below the signal line, it could indicate a bearish trend. The MACD also includes a histogram that represents the difference between the MACD and signal lines, providing additional insight into trend strength.
Bollinger Bands
Bollinger Bands consist of a middle band (SMA) and two outer bands that represent standard deviations from the SMA. The bands expand and contract based on market volatility. When the bands widen, it indicates increased volatility and potential trend strength. Conversely, when the bands contract, it suggests lower volatility and a potential trend reversal or consolidation. Traders use Bollinger Bands to identify potential entry and exit points based on price touching or breaching the bands.
Ichimoku Cloud
The Ichimoku Cloud is a comprehensive indicator that provides information on support and resistance levels, Forex Trading Robot, and momentum. It consists of five lines: Tenkan-sen, Kijun-sen, Senkou Span A, Senkou Span B, and Chikou Span. The area between Senkou Span A and Senkou Span B forms the “cloud.” Price above the cloud indicates an uptrend, while price below the cloud suggests a downtrend. The cloud’s thickness can also provide insights into the strength of the trend.
Parabolic SAR
The Parabolic SAR (Stop and Reverse) is a trend-following indicator that provides potential entry and exit points. It appears as dots on the chart, with dots below the price indicating an uptrend and dots above the price signaling a downtrend. The indicator helps traders set trailing stop-loss orders and recognize potential trend reversals.
0 notes
Text
Mastering the Parabolic SAR Indicator: A Guide to Trend Following and Market Timing
The Parabolic SAR (Stop and Reverse) indicator is a trend-following tool that spots potential reversals by placing dots above or below the price chart. It helps traders identify the direction of the trend and potential exit points.
0 notes
Text
O SAR Forex Scalping é uma estratégia de negociação que tem ganhado popularidade entre os traders de Forex devido à sua simplicidade e eficácia. Composta por apenas dois indicadores, o THW Trix e o Digital Parabolic SAR, essa estratégia é ideal para scalping e day trading, especialmente em gráficos Renko, Range Bar e Candle. Neste artigo, vamos explorar em detalhes como configurar e utilizar essa estratégia para maximizar seus lucros no mercado Forex.
Introdução ao SAR Forex Scalping
A negociação no mercado Forex exige precisão, disciplina e uma estratégia bem definida. O SAR Forex Scalping oferece exatamente isso: uma abordagem simples, mas poderosa, para capturar pequenas oscilações no mercado e transformar essas oscilações em lucros consistentes. Esta estratégia é particularmente eficaz em gráficos Renko, onde os sinais são claros e precisos, apesar das oscilações de tamanho das caixas.
O SAR Forex Scalping utiliza dois indicadores principais: o THW Trix e o Digital Parabolic SAR. Ambos os indicadores são conhecidos por sua capacidade de identificar tendências e momentos de entrada e saída no mercado com alta precisão. O THW Trix é um indicador de momentum que ajuda a identificar divergências e confirma a direção da tendência, enquanto o Digital Parabolic SAR é um indicador de seguimento de tendência que fornece sinais visuais claros para compra e venda.
A simplicidade dessa estratégia não deve ser subestimada. Apesar de utilizar apenas dois indicadores, o SAR Forex Scalping é altamente eficaz, especialmente quando usado em gráficos de curto prazo, como 3 minutos, 5 minutos, 15 minutos e 30 minutos. Os gráficos Renko, em particular, são altamente recomendados para essa estratégia devido à clareza dos sinais, mas é importante se acostumar com as oscilações de tamanho das caixas, que podem variar entre 2 a 4 pips.
Configurando o SAR Forex Scalping no MetaTrader 4
Indicadores Principais
Para configurar o SAR Forex Scalping no MetaTrader 4, você precisará dos seguintes indicadores:
SAR Forex: Configuração padrão.
THV Trix: Configuração padrão.
Esses indicadores serão aplicados ao gráfico de preços, e sua configuração correta é crucial para o sucesso da estratégia. A configuração padrão desses indicadores já está otimizada para scalping, então não há necessidade de ajustes adicionais. No entanto, é sempre bom revisar as configurações e ajustá-las conforme necessário para se adequar ao seu estilo de negociação e às condições do mercado.
Gráficos e Time Frames
O SAR Forex Scalping é adequado para três tipos de gráficos:
Gráficos Renko: Tamanho das caixas variando entre 2-4 pips.
Gráficos Range Bar: Tamanho das caixas variando entre 4-6 pips.
Gráficos Candle: Time frames de 3 min, 5 min, 15 min, e 30 min.
Escolha o gráfico que melhor se adapta ao seu estilo de negociação. Os gráficos Renko são altamente recomendados para essa estratégia devido à clareza dos sinais, mas é importante se acostumar com as oscilações de tamanho das caixas.
Sessões de Negociação
Essa estratégia pode ser usada em qualquer sessão de negociação, mas é especialmente eficaz durante as sessões de Londres e Nova York, onde há maior volatilidade e volume de negociação.
Regras de Negociação do SAR Forex Scalping
[fusion_gallery order_by="desc" limit="" pagination_type="" load_more_btn_text="" layout="" picture_size="" aspect_ratio="" custom_aspect_ratio="100" aspect_ratio_position="" gallery_masonry_grid_ratio="" gallery_masonry_width_double="" lightbox="yes" lightbox_content="" margin_top="" margin_right="" margin_bottom="" margin_left="" hide_on_mobile="small-visibility,medium-visibility,large-visibility" class="" id="" columns_medium="0" columns_small="0" columns="2" column_spacing="" hover_type="zoomin" bordersize="" bordercolor="" hue="" saturation="" lightness="" alpha="" border_radius="" load_more_btn_span="no" button_alignment="center" load_more_btn_hover_color="" load_more_btn_color="" load_more_btn_hover_bg_color="" load_more_btn_bg_color=""
caption_style="off" caption_title_tag="2" fusion_font_family_caption_title_font="" fusion_font_variant_caption_title_font="" caption_title_size="" caption_title_line_height="" caption_title_letter_spacing="" caption_title_transform="" caption_title_color="" caption_background_color="" fusion_font_family_caption_text_font="" fusion_font_variant_caption_text_font="" caption_text_size="" caption_text_line_height="" caption_text_letter_spacing="" caption_text_transform="" caption_text_color="" caption_border_color="" caption_overlay_color="" caption_align_medium="none" caption_align_small="none" caption_align="none" caption_margin_top="" caption_margin_right="" caption_margin_bottom="" caption_margin_left="" parent_dynamic_content=""][fusion_gallery_image image="https://tradeemais.com/wp-content/uploads/2024/08/1-15.png" image_id="207320" aspect_ratio_position="" masonry_image_position="" image_title="" image_caption="" link="" linktarget="_self" /][fusion_gallery_image image="https://tradeemais.com/wp-content/uploads/2024/08/2-14.png" image_id="207321" aspect_ratio_position="" masonry_image_position="" image_title="" image_caption="" link="" linktarget="_self" /][/fusion_gallery]
[fusion_separator style_type="default" hide_on_mobile="small-visibility,medium-visibility,large-visibility" sticky_display="normal,sticky" class="" id="" flex_grow="0" top_margin="" bottom_margin="" width="" height="20" alignment="center" border_size="" weight="" amount="" sep_color="" hue="" saturation="" lightness="" alpha="" icon="" icon_size="" icon_color="" icon_circle="" icon_circle_color=""][/fusion_separator]
Existem duas maneiras principais de usar o template SAR Forex Scalping:
1. Entrada Baseada em Divergência do THV Trix
Nesta abordagem, você entra no mercado apenas quando há uma divergência clara indicada pelas setas do THV Trix. Esta é uma abordagem mais conservadora, mas também pode ser mais precisa, especialmente em mercados voláteis. Ao focar apenas nas divergências, você abrirá menos gráficos, mas aumentará a probabilidade de sucesso em cada negociação.
2. Entrada Baseada em Divergência e Cor das Linhas do THV Trix
Nesta abordagem, você combina a divergência indicada pelo THV Trix com a cor das linhas do THV Trix. Isso significa que você só entra no mercado quando a divergência e a cor das linhas estão alinhadas na direção da tendência. Esta abordagem pode gerar mais sinais de entrada, mas também requer uma maior atenção ao gerenciamento de risco.
Sinais de Compra
Sar Forex: Linha verde.
THV Trix: Seta de compra ou linhas verdes do THV Trix.
Sinais de Venda
Sar Forex: Linha vermelha.
THV Trix: Seta de venda ou linhas vermelhas do THV Trix.
Saída da Posição
Coloque o stop loss inicial abaixo do swing high/low anterior.
O take profit depende do par de moedas e do time frame, mas geralmente varia entre 5-20 pips.
Tabela Explicativa dos Indicadores
Indicador
Função Principal
Configuração
Sinais de Entrada
Sinais de Saída
Sar Forex
Seguir a tendência, identificar pontos de reversão
Padrão
Linha verde para compra, linha vermelha para venda
Swing high/low anterior, take profit de 5-20 pips
THV Trix
Medir momentum, identificar divergências
Padrão
Seta de compra/venda, linhas de cor correspondente
Take profit com base na volatilidade do par de moedas
Análise Detalhada dos Indicadores
THV Trix
O THV Trix é um indicador de momentum que mede a taxa de variação de um ativo financeiro. Ele é especialmente útil para identificar divergências, que ocorrem quando o preço do ativo está se movendo em uma direção, mas o momentum está se movendo na direção oposta. Essas divergências podem ser um sinal de que a tendência atual está perdendo força e que uma reversão pode estar prestes a ocorrer.
O THV Trix também ajuda a confirmar a direção da tendência. Quando as linhas do THV Trix estão na mesma cor, isso indica que o momentum está alinhado com a tendência, o que aumenta a probabilidade de sucesso na negociação.
Sar Forex
O Sar
Forex, ou Parabolic SAR (Stop and Reverse), é um indicador de seguimento de tendência que ajuda a identificar possíveis pontos de reversão no mercado. Ele é visualizado como uma série de pontos que aparecem acima ou abaixo do preço no gráfico. Quando os pontos estão abaixo do preço, isso indica uma tendência de alta, e quando estão acima, indica uma tendência de baixa.
O Sar Forex é particularmente útil em mercados de tendência, pois ajuda a capturar grandes movimentos e a evitar reverter posições prematuramente.
Vantagens e Desvantagens do SAR Forex Scalping
Vantagens
Simplicidade: Utiliza apenas dois indicadores, o que facilita a configuração e a utilização.
Eficiência: É eficaz em capturar pequenas oscilações no mercado, o que é ideal para scalping.
Versatilidade: Pode ser usado em diferentes tipos de gráficos e time frames.
Desvantagens
Dependência de Volatilidade: A estratégia pode ser menos eficaz em mercados de baixa volatilidade.
Necessidade de Disciplina: Requer disciplina para seguir as regras de entrada e saída, especialmente em períodos de alta volatilidade.
Perguntas Frequentes
1. O que é o SAR Forex Scalping?
O SAR Forex Scalping é uma estratégia de negociação simples e eficaz, ideal para scalping e day trading, utilizando os indicadores THV Trix e Digital Parabolic SAR para identificar pontos de entrada e saída no mercado.
2. Como configurar o SAR Forex Scalping no MetaTrader 4?
Para configurar o SAR Forex Scalping no MetaTrader 4, você deve adicionar os indicadores THV Trix e Digital Parabolic SAR ao gráfico e ajustar as configurações conforme necessário.
3. Quais são os melhores gráficos para usar com o SAR Forex Scalping?
Os melhores gráficos para usar com essa estratégia são os gráficos Renko, Range Bar e Candle, com time frames de 3, 5, 15 e 30 minutos.
4. Qual é o melhor time frame para o SAR Forex Scalping?
O time frame mais eficaz para o SAR Forex Scalping é de 3 a 30 minutos, dependendo da volatilidade do mercado e do par de moedas.
5. Como gerenciar o risco com o SAR Forex Scalping?
O gerenciamento de risco é fundamental nesta estratégia. Utilize stop loss para limitar as perdas e ajuste as posições conforme os níveis de suporte e resistência.
6. O SAR Forex Scalping funciona em todos os pares de moedas?
Sim, funciona bem em pares de moedas principais, secundários e voláteis, mas a eficácia pode variar com a volatilidade do par.
7. É necessário usar todos os indicadores para a estratégia funcionar?
Sim, ambos os indicadores THV Trix e Digital Parabolic SAR são essenciais para o sucesso desta estratégia, pois trabalham juntos para identificar pontos de entrada e saída precisos.
Conclusão
O SAR Forex Scalping é uma estratégia de negociação simples, mas poderosa, ideal para traders que buscam capturar pequenos movimentos no mercado Forex. Com uma configuração fácil e uma abordagem clara para identificar pontos de entrada e saída, essa estratégia pode ser uma adição valiosa ao arsenal de qualquer trader. Lembre-se de seguir as regras de negociação com disciplina e ajustar a estratégia conforme necessário para se adequar às condições do mercado.
Em um mercado tão dinâmico como o Forex, ter uma estratégia como o SAR Forex Scalping pode ser a chave para transformar pequenas oscilações em lucros consistentes. Experimente essa estratégia e veja como ela pode melhorar seus resultados de negociação.
[sociallocker id="8062"][fusion_button link="https://tradeemais.com/wp-content/uploads/2024/08/Sar-Forex-Scalping.zip" title="" target="_blank" link_attributes="" alignment_medium="" alignment_small="" alignment="center" modal="" hide_on_mobile="small-visibility,medium-visibility,large-visibility" sticky_display="normal,sticky" class="" id="" color="material-green" button_gradient_top_color_hover="" hue="" saturation="" lightness="" alpha="" button_gradient_top_color="" button_gradient_bottom_color_hover="" button_gradient_bottom_color="" gradient_start_position="" gradient_end_position="" gradient_type=""
radial_direction="" linear_angle="180" accent_hover_color="" accent_color="" type="3d" bevel_color="" bevel_color_hover="" border_top="" border_right="" border_bottom="" border_left="" border_radius_top_left="" border_radius_top_right="" border_radius_bottom_right="" border_radius_bottom_left="" border_hover_color="" border_color="" size="large" padding_top="" padding_right="" padding_bottom="" padding_left="" fusion_font_family_button_font="" fusion_font_variant_button_font="" font_size="" line_height="" letter_spacing="" text_transform="" stretch="default" margin_top="20px" margin_right="" margin_bottom="20px" margin_left="" icon="fa-download fas" icon_position="left" icon_divider="no" hover_transition="none" animation_type="" animation_direction="left" animation_color="" animation_speed="0.3" animation_delay="0" animation_offset=""]Download[/fusion_button][/sociallocker]
0 notes
Text
What is SAR – Parabolic Stop and Reverse?
Parabolic SAR, or Parabolic Stop and Reverse, is a technical analysis indicator that indicates whether the market is in a bull or bear phase rather than predicting price movements.
0 notes
Text
Unveiling Parabolic SAR: A Comprehensive Guide
In the ever-evolving landscape of technical analysis, traders and investors seek tools that offer clarity amidst market volatility and uncertainty. Enter the Parabolic SAR (Stop and Reverse) indicator, a powerful tool designed to identify potential trend reversals and provide valuable insights into market dynamics. Whether you're a novice trader or a seasoned investor, understanding the mechanics and applications of the Parabolic SAR can be instrumental in making informed trading decisions and navigating the complexities of financial markets.
Introduction to Parabolic SAR:
Developed by Welles Wilder, the Parabolic SAR is a trend-following indicator that highlights potential trend reversals in financial markets. It accomplishes this by plotting points on a chart that represent potential stop-loss levels, adjusting these points dynamically as the price of an asset changes over time.
How Does Parabolic SAR Work?
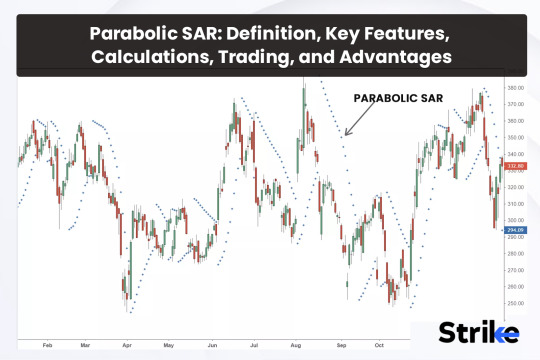
The Parabolic SAR indicator places dots either above or below the price of an asset, depending on the direction of the trend. During an uptrend, the dots are below the price, while during a downtrend, the dots are above the price. The spacing between the dots increases as the trend accelerates, hence the "parabolic" nature of the indicator.
Interpreting Parabolic SAR Readings:
The primary use of Parabolic SAR is to identify potential trend reversals and establish trailing stop-loss levels. Traders typically interpret Parabolic SAR signals as follows:
Uptrend:
When the Parabolic SAR dots are below the price, it indicates an uptrend.
Traders may consider entering long positions or maintaining existing long positions as long as the dots remain below the price.
The dots serve as dynamic trailing stop-loss levels, gradually rising as the trend progresses.
Downtrend:
Conversely, when the Parabolic SAR dots are above the price, it signals a downtrend.
Traders may consider entering short positions or holding existing short positions as long as the dots remain above the price.
Similar to uptrends, the dots act as dynamic trailing stop-loss levels, descending as the downtrend continues.
Strategies for Using Parabolic SAR:
Trend Reversals:
When the price crosses over the Parabolic SAR dots, it may signal a potential trend reversal.
For example, when the price crosses above the dots during a downtrend, it could indicate a bullish reversal, prompting traders to consider exiting short positions or even entering long positions.
Trailing Stop-Loss:
Traders can use the Parabolic SAR dots as dynamic trailing stop-loss levels to protect profits and manage risk.
As the trend progresses, the stop-loss levels adjust accordingly, allowing traders to lock in gains while giving the trade room to breathe.
Confirmation with Other Indicators:
Combine Parabolic SAR with other technical indicators or chart patterns to confirm signals and enhance trading decisions.
For example, use Parabolic SAR in conjunction with moving averages or oscillators to validate trend direction and momentum.
Limitations and Considerations:
While Parabolic SAR offers valuable insights into trend reversals and trailing stop-loss levels, traders should be aware of its limitations and exercise caution:
Whipsaws: In choppy or ranging markets, Parabolic SAR may generate false signals, resulting in whipsaws and potential losses.
Adaptability: Adjust the parameters of Parabolic SAR (e.g., acceleration factor) to suit the specific characteristics of the asset and trading timeframe.
Confirmation: Always confirm Parabolic SAR signals with other technical indicators or fundamental analysis to reduce the likelihood of false positives.
Conclusion:
In the dynamic world of financial markets, the Parabolic SAR stands as a beacon of clarity, offering traders valuable insights into trend dynamics and potential reversal points. Whether you're a day trader, swing trader, or long-term investor, incorporating Parabolic SAR into your trading toolkit can enhance your ability to identify profitable opportunities, manage risk, and optimize returns. By mastering the interpretation and application of Parabolic SAR signals, traders can navigate the complexities of financial markets with confidence and precision, striving towards greater profitability and success.
0 notes
Text
Exness Pakistan
6 top ADX indicator strategies to use in online trading
Traders use different types of strategies on a platform because they enable them to get more ideas about various things. The Average Directional Index (ADX) is one of the indicators that allows a trader to measure the strength of a trend with high accuracy. A high ADX indicates a strong trend, and a low ADX suggests a weak market. ADX is useful for both day trading and swing trading purposes that let traders make the most informed decisions. Whether it is a new or experienced trader, they should know the top ADX strategies in online trading.
What are the best ADX strategies to follow in trading?
Combining ADX with Parabolic SAR
A trader should consider combining ADX with parametric SAR because they provide ways to know current trends and potential reversal points. For instance, one can identify a bullish trend when the ADX line is above 25 and the parabolic SAR is below the price bars. This combination works well for identifying a strong trend with potential for further upside.
Using ADX in the Directional Movement (DM) system
One should consider using ADX in the Directional Movement (DM) system that has three lines. It provides methods to measure bullish movements, apart from evaluating the strength of a trend. However, it is wise to combine the same with other tools to get more insights.

Evaluating a strong trend
Traders should evaluate a strong trend when the reading goes above 25. A reading above 25 indicates a strong trend and the likelihood of a trend developing. This, in turn, gives ways to proceed further that will help achieve the best results.
Determining the direction of a trend
A trader should determine the direction of a trend by using the last 50 candlesticks. Using a sample size of 50 candlesticks gives ways to determine a trend. The Exness Pakistan trading platform allows traders to trade different types of assets with the best indicators. It allows a trader to focus more on various things with high accuracy.
ADX price divergence
ADX price divergence issues a warning against a trend during the trading process. On the other hand, a trader should learn more about the strategy with more attention.
The Holy Grail
The Holy Grail strategy involves combining ADX with a moving average that helps find pullbacks using price action. Traders should learn strategies from different sources to maximize efficiency in trading.
1 note
·
View note
Text
Mastering Trading with the Parabolic SAR: A Comprehensive Guide
Introduction
In the dynamic world of financial markets, traders are constantly seeking tools and indicators to assist them in making informed decisions. One such tool that has gained popularity among traders is the Parabolic Stop and Reverse (SAR) indicator.
Developed by Welles Wilder, the Parabolic SAR is a versatile indicator that can help traders identify potential trend reversals, set…
View On WordPress
#Financial market trading indicators#Financial Markets#learn technical analysis#moving average#Moving average and Parabolic SAR#Parabolic SAR#Parabolic SAR reversal strategy#Parabolic SAR trading strategies#Risk Management#SAR calculation#SAR interpretation#Stop-Loss#Stop-loss with Parabolic SAR#technical analysis#technical analysis tools#Trading Indicators#Trading Strategies#Trading with SAR indicator#Trend Following#Trend following with Parabolic SAR#Trend Reversal
0 notes
Video
youtube
⚡ Pocket Option Parabolic Sar 1 Minute Options 🔥
0 notes
Video
youtube
Parabolic SAR no MetaTrader 5: Seguindo a Tendência no Forex
Assista esse vídeo sobre Parabolic SAR no MetaTrader 5 - Seguindo a Tendência no Forex. Acesse aqui mais informações: https://www.ganhardinheiro.com/2023/10/parabolic-sar-no-metatrader-5-seguindo.html
0 notes
Text
A Complete Guide to Trend-Following Indicators
There are many distinct trading indicators available on the financial markets, each with a specific function. These indicators are useful for assessing, trading, and making money from the constantly shifting state of price movement.
It is crucial to group these indicators according to their application and the market conditions in which they are most effective for analyzing price movement and providing trading tips.
But before proceeding further, let’s proceed to know what is a trend following a trading strategy.
What Is a Trend Following Indicators?
Technical tools called trend-following indicators assess the strength and direction of trends throughout the selected time frame. Some trend-following indicators are plotted right on the price panel, sending out negative signals when they are above the price and bullish signals when they are below the price. Others are drawn below the panel, producing up- and down-ticks from 0 to 100 or over a central ‘zero’ line, producing bullish or bearish divergences when opposing prices.
The majority of trend-following indicators are ‘lagging’, which means that they produce a buy or sell signal after a trend or reversal has already begun. The most common trailing trend-following indicator is the moving average. These indicators can also be ‘leading’, which means they anticipate price action before it occurs by comparing momentum across many time frames and doing multiple calculations. A well-liked leading trend-following indicator is the parabolic stop and reverse (Parabolic SAR).
There are three main purposes for these indicators. They first make an effort to inform the technician of a changing trend or impending reversal. Second, they make an effort to forecast both short- and long-term price movements. Thirdly, they validate findings and indications in the price pattern and other technical indicators. The parameters used to create the trend-following indication have the most influence on signal dependability. Examples include the generation of distinct buy and sell signals by a 50-day moving average and a 200-day moving average, which may be effective in one-time frame but not the other.
Top Trend-following Indicators
Here, in this section, we will explain the best trend following indicators. Let’s take a quick look:
Moving Averages
One of the most often used trend-following indicators is the moving average. The average price of an asset over a given period of time is shown by a moving average, which is a line. Before making a transaction while you trade forex online, you should frequently use moving averages to confirm the direction and intensity of a trend.
Moving Average Convergence Divergence (MACD)
The difference between two moving averages is measured by the trend-following indicator known as the Moving Average Convergence Divergence (MACD). In order to enter or exit transactions at the ideal time traders frequently use the MACD to spot changes in momentum or trend direction.
Bollinger Bands
A common trend-following indicator called Bollinger Bands uses a series of lines to depict the top and bottom of a trading range. Bollinger Bands are frequently used by traders to assist spot overbought and oversold market circumstances as well as probable trend reversals.
Relative Strength Index (RSI)
The Relative Strength Index (RSI) is another popular trend-following indicator. By contrasting the average gains and losses over a given time period, the RSI gauges the force of a trend.
The RSI is often used by traders to spot overbought and oversold market conditions, which can aid them in making better trading decisions.
Trend Following advantages
Numerous benefits of trend following method include:
Big victories are possible, unlike with previous strategies.
Minimal transaction costs.
Your entrances and exits don’t have to be timed perfectly.
As the trend gets stronger, you could increase your position to increase your chances of making money.
Trend Following Disadvantages
Additionally, there are several drawbacks to trend following, the most prevalent of which are as follows:
It can be difficult mentally to ride the trend.
The win rate (number of winning trades divided by the number of lost trades) is lower.
Because trend following demands that the trend be already in motion, you’ll miss the trend’s beginning.
Final Thoughts
On a leading Forex trading platform, the trader can predict the stock price and choose the optimum time to purchase or sell the stock by using a trend-following technique, which is straightforward. To develop the technique, one needs just employ one trading indicator or one or more indicators in combination.
You can use the different methods for your trades now that you are aware of what trend trading is and what it entails. Before using your strategies, you must, however, perfect them. Use all the tools you have at your disposal, including charts, candlestick patterns, research data, and other tools, to examine the trends.
Originally Published on Theomnibuzz
Source: https://theomnibuzz.com/a-complete-guide-to-trend-following-indicators/
0 notes
Video
youtube
Trading Mastery: MACD, ADX, Parabolic SAR Strategies Revealed,Market Success Blueprint with MACD, ADX, Parabolic SAR Techniques,Trading Mastery: MACD, ADX, Parabolic SAR Strategies Revealed,Market Success Blueprint with MACD, ADX, Parabolic SAR Techniques,Optimize Your Trades: MACD, ADX, Parabolic SAR Strategy Unveiled,Profitable Trading Secrets: MACD, ADX, Parabolic SAR Strategies,Strategic Trading Signals: MACD, ADX, Parabolic SAR Mastery,Maximize Profits with MACD, ADX, Parabolic SAR Trading Tactics,Proven Strategies: MACD ADX Parabolic SAR for Trading Success,Elevate Your Trading Game: MACD, ADX, Parabolic SAR Techniques,Mastering Market Trends: MACD, ADX, Parabolic SAR Strategies,Trade Like a Pro: MACD, ADX, Parabolic SAR Success Guide,MACD Trading Strategies,ADX Indicator Strategies,Parabolic SAR Trading Techniques,MACD ADX Trading Signals,How to Use Parabolic SAR Effectively,MACD Trading Tips and Tricks,ADX Indicator Explained for Traders,Parabolic SAR Trend Analysis,MACD ADX Strategy for Beginners,Mastering Parabolic SAR in Trading,
0 notes
Text
Desvendando o Parabolic SAR no MetaTrader 5: Sua Estratégia de Tendência Inabalável
Desvendando o Parabolic SAR no MetaTrader 5: Sua Estratégia de Tendência Inabalável – Você, trader em busca de consistência, sabe que entender e dominar indicadores é a chave para o sucesso no mercado financeiro… SAIBA MAIS!

View On WordPress
0 notes
Text
Polygon co-founder submitted a proposal to the ApeCoin DAO governance forum for the creation of its own zero-knowledge Layer-2 blockchain.
APE has seen a significant decline in demand since the month began.
In a new proposal dated 10 October, Polygon’s co-founder Sandeep Nailwal suggested that ApeCoin DAO develop its own zero-knowledge Layer-2 (zk-L2) blockchain using the Polygon Chain Development Kit (CDK).
Read ApeCoin’s [APE] Price Prediction 2023-2024
The proposal comes nearly 18 months after Yuga Labs, the creators of the Bored Ape Yacht Club NFT collection, tweeted that ApeCoin “will need to migrate to its own chain in order to properly scale” following its “Otherside” NFT minting event in April 2022, which resulted in the highest gas fees in the history of the Ethereum [ETH] network.
We're sorry for turning off the lights on Ethereum for a while. It seems abundantly clear that ApeCoin will need to migrate to its own chain in order to properly scale. We'd like to encourage the DAO to start thinking in this direction.
— Yuga Labs (@yugalabs) May 1, 2022
The ApeCoin DAO voted in a later proposal to keep ApeCoin within the Ethereum ecosystem. However, the question of an ApeCoin-specific chain remains open.
In his proposal, the co-founder argued in favor of Polygon’s CDK for the proposed zk-L2 network by highlighting its security, low fees, shared liquidity, customizability, and interoperability, making it suitable for achieving ApeCoin DAO’s goals.
According to Nailwal:
“ApeChain will provide the ApeCoin DAO with an efficient, secure, and decentralized execution environment upon which ApeCoin DAO projects can be built to help realize this mission.”
APE holders have it rough
At press time, the project’s native token APE traded at $1.04. In the last month, its price has declined by 10%, according to data from CoinMarketCap.
The month so far has been marked by a drop in demand for the metaverse-based token. On 2 October, the token attained a price peak of $1.29 and has since declined by 19%.
Source: CoinMarketCap
An assessment of the movements of key momentum indicators on a daily chart lent credence to the above position.
After the bears initiated a downtrend on 3 October, the token’s Relative Strength Index (RSI) and Money Flow Index (MFI), initially positioned above their respective center lines, began trending downwards.
As of this writing, the token’s MFI approached the oversold zones at 28.34, while its RSI was spotted at 35.37. This suggested that token sell-offs have significantly exceeded accumulation in the last two weeks.
Moreover, APE’s Parabolic Stop and Reverse (SAR) indicator – which identifies potential reversal points in an asset’s price direction- confirmed the market’s downtrend.
How much are 1,10,100 APEs worth today?
When the dots that make up the indicator are positioned above the price, it indicates a downtrend. Also, when these dots are closely packed together, it suggests that the trend is strong. All of these were true in APE’s case at the time of writing.
Lastly, its Aroon Down Line (blue) at 78.57% indicated that the downtrend was strong, and APE’s most recent price low was reached relatively recently.
Source: APE/USDT on TradingView
0 notes
Last Seen Blogs

melduvio
Jose Melduvio

pnwdreaming
PNWdreams

pick-me-choose-me-love-me
And Obviously Taylor Swift.

scarecrussy
Jonah

fa-br
CowBoy