#Trading with SAR indicator
Text
Mastering Trading with the Parabolic SAR: A Comprehensive Guide
Introduction
In the dynamic world of financial markets, traders are constantly seeking tools and indicators to assist them in making informed decisions. One such tool that has gained popularity among traders is the Parabolic Stop and Reverse (SAR) indicator.
Developed by Welles Wilder, the Parabolic SAR is a versatile indicator that can help traders identify potential trend reversals, set…

View On WordPress
#Financial market trading indicators#Financial Markets#learn technical analysis#moving average#Moving average and Parabolic SAR#Parabolic SAR#Parabolic SAR reversal strategy#Parabolic SAR trading strategies#Risk Management#SAR calculation#SAR interpretation#Stop-Loss#Stop-loss with Parabolic SAR#technical analysis#technical analysis tools#Trading Indicators#Trading Strategies#Trading with SAR indicator#Trend Following#Trend following with Parabolic SAR#Trend Reversal
0 notes
Text
006. Arulaq

The day of the Naadam has come, and during her time there, Nomin's attention is brought to a tribe she had never seen nor heard of before thanks to Yul's excited observations. Though not much is learned from the Oroqi individuals who have traded with the Arulaq in the past, there is hope that Nomin might one day travel to see the valley they come from.
Word Count: 3,088
Steppe by Steppe Chapter List
The day of the Naadam had come all too quickly for Nomin. That was how it felt to her at any rate when she woke up to the excited chatter and commotion of both Sagahl and Oroq. Rubbing the sleep from her eyes and removing herself from the cover of her blankets, Nomin squinted about the ger, catching sight of Bayarmaa organizing a good portion of belongings into a crate, meanwhile, Esenaij was nowhere to be seen in the abode.
No matter… What really made Nomin pause to consider the day was the fact that on this morning, she would have undergone her naming ceremony with the other previously unnamed Tumet children. Part of her wondered amongst those fleeting thoughts of what she would have been named had she gone back. Yet she had her name, she chose it, and she was more than fine with that.
She was…no…she is Nomin.
Still, as Nomin sleepily removed herself from her bed and stretched, she thought back to previous Naadams that she could remember. She remembered going to higher ground to witness the Tumeti warriors partake in combat with the other warriors of the Steppe. When she thought of the Sagahl, on the other hand…
“... Are the warriors preparing for today?” Nomin asked, yawning at the tail end of her question.
Bayarmaa gave a slight start, looking up at Nomin from where she was cleaning up part of the ger. Placing a hand over her chest as a means to collect herself, Bayarmaa offered a small, embarrassed smile in response. “I didn't realize you were awake, Nomin. As for our…warriors, no. We don't partake in the Naadam on the last day of the Tsagaan Sar. It doesn't benefit the Sagahl to fight for leadership over the Steppe.”
“Mm…” Nomin hummed, processing Bayarmaa’s words as she stretched her arms over her head and then trodden over to where her clothes were normally kept. Nomin’s gaze fell to her old gutal for a moment before she opened a dresser drawer and rummaged around. She lifted some neatly folded garments till she found the copper shard that had been used in her trial.
Picking it up, Nomin turned it over in her hands, candlelight glinting off of it as it caught onto the metal. She then looked over at Bayarmaa, who kept her own gaze mostly pointed in Nomin’s direction.
“What do you have there?” Bayarmaa asked, leaning to the side slightly as if that would give her a better look at the copper shard.
Holding the shard up, Nomin showed it off to Bayarmaa.
“I was wondering if you could do something with this?” Nomin inquired, closing the drawer halfway and then walking in Bayarmaa’s direction. Her movements were a little lagged, indicative of the tiredness still present within. “Since…well, since you made the baras. I bet you could make it into a necklace or something!”
Bayarmaa held out her hand, and Nomin placed the shard on her palm. A soft sigh fell from Bayarmaa’s nose as she looked the shard over a couple times. Its shine was dull -- as if a discarded piece used for throwaway clothing. However, the edges were sharp, an interesting detail when metal fittings and decorations upon their clothes were often filed or dulled so they caused no harm. “I can see what I can do. This is that piece of copper from the story you told Esenaij, isn’t it?”
“Mhm.” Nomin had already been walking back toward the dresser so that she could get herself dressed more appropriately.
Bayarmaa hummed softly in thought and then reached down to a pouch on her belt. Tucking the copper shard away safely, she continued getting the area cleaned up and packed away. Occasionally, she stole curious glances in Nomin’s direction, watching her and studying her.
“Are you…disappointed? That the Sagahl have no warriors who fight in the Naadam, I mean…” Bayarmaa asked, turning her gaze back to the chores she took on. She was in the process of closing the crate as Nomin pulled on some thick robes to combat the chill of the Steppe.
“... Not really…” Nomin replied after a moment's thought. She tightened her belt and got her dagger secured to herself. “I know I haven't been here long, but I guess it makes sense. I like that about the Sagahl. I like that you don't really want to fight in the Naadam. I don't think I'd want to fight in it, either. Even when I'm an adult like you or Esenaij.”
A small smile grew on Bayarmaa’s lips as she went about the ger. Pulling down a tapestry that hung on the eastern wall, she folded it. “That is well. We like not conflict with other tribes if we can avoid it… But…it does stand to reason that life on the Steppe necessitates such measures. After we get to our next location, I'd like to teach you what I know if Esenaij can't show you how to shoot a bow.”
Nomin paused. She was already sitting at the edge of her bed, getting socks on her feet. A look of contemplation grew on her face as she slowly pulled the thin fabric over her feet. With a few more moments of thought, she finally gave her response: “okay. Esenaij won’t be able to just travel to Reunion every day, will he? He can definitely teach me how to use a bow!”
Bringing a hand to her mouth, Bayarmaa chuckled softly. “Indeed. I’ll make sure that he actually sees to it.”
------------------------------------------------------------------------------
The gathering of other tribes to watch the Naadam was astounding. As it ever was. It was also awe inspiring to see many different standards to indicate the tribes stood up on long, wooden poles proudly billowing in the breeze over many different groups of people. This was the first year that Nomin really took more involved notice of these standards, noting the different colors, symbols, and even different standard shapes that some of the tribes adopted as their own to represent their people.
By virtue of the Naadam itself, Nomin and many of the more passive tribes that attended the Naadam as an audience had little to worry about. Those that were more wanting of the thrill of battle found themselves already upon their hard-earned yol companions from the trials of Bardam's Mettle. Restless warriors rode their yol all across the presumed site of the Naadam, as everyone was still waiting for the Gharl soilbearers to make their appearance and spread the earth. To mark the start of the Naadam.
The Gharl Iloh was visible from where Nomin stood, their many ger erected and devoid of color -- pure white, waiting to have been stained by the new year's travel over the land. Nomin recalled how the Tumet sometimes traveled early enough to watch the Gharl arrive and set their ger up. She had overheard at the time that their ger only looked clean and spotless, but it was because they set fire to their old clothes and ger canvas to meet the new year in wholly new garments that will show their stories as the year progresses.
Looking around as the Sagahl traveled alongside the Oroq to a high enough outcrop, she looked for colors and tribal standards that she could pick out. The Oronir had been easy enough, with their bright colors that represented the bright sun of Azim. She saw the Dotharl as well -- ever the warriors that would charge into battle. In addition, there were the Adarkim, Qestir, Dataq, Goro, Olkund, Buduga, and many more of which she could not yet identify.
“Do you need some water, Nomin?” Bayarmaa’s voice broke Nomin’s concentration. Looking up at her, Nomin nodded and accepted the waterskin. She went back to looking out at all the standards, only occasionally looking up at the warriors that excitedly flew overhead on their yol.
“Whoa! The Arulaq are here, too!” Yul exclaimed, jabbing a finger out toward the standard that flew alongside the Khatayin's. When the Sagahl and Oroq traveled to their location together, he followed along after Chotan, who had not been that far away from Nomin, Esenaij, and Bayarmaa herself. He had since worn the wreath of flowers Chotan made for him around his neck.
“Arulaq?” Nomin walked over closer to Chotan and Yul, tilting her head in confusion. She had never heard of the tribe before. When she looked at their standard, she kept the symbol upon it in mind.
“Y-yea!” Yul started in response, glancing over at Nomin. He grinned, an opportunity to show off knowledge he had pleasing him. “We Oroq met them once when we were traveling down close to the base of the Tail Mountains one year! When they come down from the mountains, they're always with the Khatayin! They don't speak a lot of the same Steppe dialect we do, so the Khatayin often translate for us and them so they can trade and attend any tribal meetings!”
“They don't speak the same dialect as us? Why not?” Chotan lifted her hand to her chin, cupping it in thought.
“Dunno, truth be told…” Yul's expression fell to contemplation. “I think when I overheard some conversations with the Khatayin and Oroq elders, it was because the Arulaq had been sequestered away in a hidden valley! Apparently they never really needed anything from the rest of the Steppe and just stayed there until the Khatayin stumbled across them one winter! So they've been seen with one another more oft than not. For the best, probably. The Arulaq don't really have warriors than they do hunters since they've lived away from all the Steppe conflict for so long.”
“Yul has the right of most of it,” a gentle voice spoke. Nomin recognized it, and the three children looked in the direction of the voice. Yul’s mother was approaching them, a soft smile upon her lips as she looked out toward the Arulaq standard. “We’ve traded with them at some point with some minor difficulty. They have valuable ore and herbs found in their little valley that can be found nowhere else.”
Nomin’s eyes shimmered at the idea of a valley that had things she had never seen before. Biting her tongue momentarily, she pointed a determined gaze up in Esenaij’s direction. He looked back, and his brow quirked with immediate suspicion and annoyance. He was not necessarily listening in on the conversation, though Nomin’s expression only filled him with some level of dread.
“No.” Esenaij folded his arms over his chest, staring down Nomin, his gaze unwavering.
“I didn't ask you anything yet!” Nomin’s mouth fell open as she now started gawking at Esenaij in disbelief.
“You’re thinking of asking something, and the answer is no.”
“What was it that you were going to ask, Nomin?” Bayarmaa asked, peeking around Esenaij with a pleasant look on her face that spoke more to mischief than genuine curiosity. In response, Esenaij’s expression fell and an irritated sigh was soon expelled. His hand came up to pinch the bridge of his nose in slight frustration.
“Since Esenaij travels out from the site of Sagahl often, I wanted to see if we could go to where the Arulaq live! I want to see the valley where all that rare stuff comes from!” Nomin eagerly said in response to Bayarmaa, her hands balling into excited fists that came up to emphasize her desire. The shimmer in Nomin’s eyes returned as her little tail flicked skyward with Bayarmaa entertaining her clearly curious nature.
“Did you really have to ask her about what was on her mind?” Esenaij grumbled, pointing his annoyed look of slight exasperation down at Bayarmaa.
“Whatever are you talking about, my one and only dearest brother?” Bayarmaa asked sweetly, happily hopping away with a slight twirl to her step as she stuck her tongue out at Esenaij before looking back out at the expanse of land. Raising a hand, she shielded her eyes from the sunlight and looked around. A low ‘ooh’ left her lips as she waved her hand to beckon Nomin and the other children over.
Sweeping her free hand forward, Bayarmaa eagerly pointed a finger in the direction of the four distant Xaela, robed in pure white, and riding atop horses just as pristine. They were majestic, in a sense, as their horses strode calmly and elegantly across the grasslands. The one that led the van held a clay urn that had no lid to it. When more of the audience and warriors caught sight of them, cheers erupted, starting low before rising into a raucous series of whoops, whistles, and elated cheering.
“The Gharl soil bearers come!” Yul exclaimed once he saw them, his eyes lit up as he gazed upon the Gharl. His tail wiggled to and fro with his delight as he stuck close to both Nomin and Chotan
One of the Gharl soil bearers dismounted, followed by the three others soon thereafter. Nomin watched as they walked out onto the land, the leader holding her urn with practiced care. Tilting the pot, the soil bearer spread the soil of their last location onto the land. Once the last of the dirt was poured upon the land, battle cries from the warriors erupted as they charged for their prize -- the ovoo.
“My next harvest is on the Oronir again. With Sadu of Dotharl still a child in their current incarnation, the Dotharli warriors have hardly the support needed to claim the ovoo from the Oronir. Especially with the Buduga having recently allied themselves with them,” Esenaij said, folding his arms over his chest. “The Dotharli people may be known as the ‘undying ones’ with their reincarnation, though that will do little to avail them this Naadam.”
“Sadu? Who is that?” Nomin asked, looking up at Esenaij.
Bringing a hand to his chin, Esenaij squinted before looking around where the Dotharl standard was raised. He pointed toward them and said, “the young girl with the white hair.”
When Nomin finally saw who Esenaij was talking about, there was a moment's consideration. This Sadu looked to have been the same age as Nomin herself.
“That is the future khatun of the Dotharl. Some would even argue that she was khatun the moment she had been born and determined the fallen soul of their previous khagan,” Esenaij explained. “But look how she carries herself. Tall, proud…and already in possession of the staff of the previous khagan. The Steppe is lucky she is too young to fight.”
“... Is she powerful?” Nomin questioned.
“We are yet to know fully. If she is indeed the true reincarnation of their previous khagan, then she will be a mighty force to contend with in several years’ time…. It is only fortunate that we Sagahl have no desire to reign over the Steppe. We know our strengths in knowing the land and its creatures. Fighting the Oronir, Dotharl, and the Three Giants would do little for us…” Esenaij said, frowning. “Though I cannot deny the Dotharli girl already emits such a powerful aura. Even at this distance…”
In that moment, the events of the Naadam became just background noise, slowly muffling as Nomin’s attention kept itself on Sadu of Dotharl. She was not quite sure why she was drawn to the other girl, but something about Sadu drew Nomin’s attention far more than any combat or competitive show on the grasslands below for the ovoo.
------------------------------------------------------------------------------
When the clamor and dust settled, there was one who had captured the ovoo and was now dubbed ‘khagan’ for the year. A Dotharl man stood the victor for he and his tribe. There were cheers and whoops to celebrate the victory, though there were also groans and murmurs of concern from those that thought the Dotharl too battle hungry and bloodlust driven.
However, Bayarmaa was beside herself with laughter.
“So your next harvest shall be going to the Dotharl instead?” Bayarmaa asked, her hands on her hips and a wide smile upon her lips. “And you were so positive that the Oronir were guaranteed to win this Naadam!”
A frown was set heavily upon Esenaij’s face as he made no attempt to retort or respond to Bayarmaa. Nomin, however, only giggled alongside Bayarmaa at the turn of events. Though another thought entered her head when she realized what that also meant. With a small gasp, Nomin’s tail flicked up and she looked up at Esenaij.
“Esenaij! Can I go with you to visit the Dotharl Iloh?” Nomin asked, her eyes sparkling with the thought of being able to travel the Steppe and see other tribes and peoples. Not only that, but learn more of what other edible or beneficial plants there were that the Steppe offered. Granted, as not a true daughter of the Sagahl, she was missing meat, but perhaps she could hunt if Esenaij allowed it.
“So that I might suffer more of your questions and inquiries? No,” Esenaij replied, folding his arms over his chest.
“Bring Nomin with you, Esenaij…” Bayarmaa said, chuckling softly still. She then echoed Nomin’s thoughts: “it will be good for her to travel the Steppe! She needs to learn more about what we can find, how we prepare it while traveling, and if you’re headed out toward the Dotharl Khaa, you might as well also show her what grows on the fringes of Nhaama’s Retreat. Teach her as you taught me of the Steppe.”
A small growl of indignation came from Esenaij, though Nomin had been happy that Bayarmaa was at least on her side when it came to doing more fun stuff. Plus, Nomin was unable to learn much about what was in season at this time and would have to wait till spring had arrived properly. Skipping up to Esenaij, Nomin raised her hands to him with a grin.
“I’m not picking you up,” Esenaij sighed. He had declined such silent requests since Bayarmaa told Nomin how he carried her from his wain to their ger. A pain, now that he had to deal with Nomin’s random ‘requests’ for being carried. Though he was met with a pout from Nomin, Esenaij started making his way back with the other Sagahl and Oroq to their site.
Bayarmaa, on the other hand, was finally coming down from her amusement. She shook her head at Nomin and gave her a mischievous look. “Don’t you worry about Esenaij and him leaving you behind. I’ll see to it that you’re ready to travel with him in the coming days.”
#ffxiv#ffxiv writing#my writing#ffxiv oc#xaela headcanons#xaela arulaq#ffxiv au ra#au ra xaela#xaela#oc: nomin tal kheeriin#oc: bayarmaa sagahl#oc: yul oroq#oc: chotan sagahl#oc: esenaij sagahl#sadu dotharl#NTK:Chronicles
5 notes
·
View notes
Text
Unveiling Parabolic SAR: A Comprehensive Guide
In the ever-evolving landscape of technical analysis, traders and investors seek tools that offer clarity amidst market volatility and uncertainty. Enter the Parabolic SAR (Stop and Reverse) indicator, a powerful tool designed to identify potential trend reversals and provide valuable insights into market dynamics. Whether you're a novice trader or a seasoned investor, understanding the mechanics and applications of the Parabolic SAR can be instrumental in making informed trading decisions and navigating the complexities of financial markets.
Introduction to Parabolic SAR:
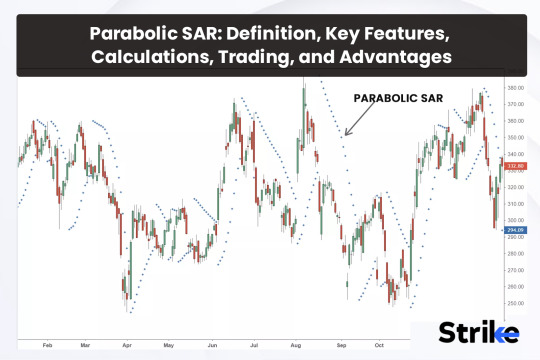
Developed by Welles Wilder, the Parabolic SAR is a trend-following indicator that highlights potential trend reversals in financial markets. It accomplishes this by plotting points on a chart that represent potential stop-loss levels, adjusting these points dynamically as the price of an asset changes over time.
How Does Parabolic SAR Work?
The Parabolic SAR indicator places dots either above or below the price of an asset, depending on the direction of the trend. During an uptrend, the dots are below the price, while during a downtrend, the dots are above the price. The spacing between the dots increases as the trend accelerates, hence the "parabolic" nature of the indicator.
Interpreting Parabolic SAR Readings:
The primary use of Parabolic SAR is to identify potential trend reversals and establish trailing stop-loss levels. Traders typically interpret Parabolic SAR signals as follows:
Uptrend:
When the Parabolic SAR dots are below the price, it indicates an uptrend.
Traders may consider entering long positions or maintaining existing long positions as long as the dots remain below the price.
The dots serve as dynamic trailing stop-loss levels, gradually rising as the trend progresses.
Downtrend:
Conversely, when the Parabolic SAR dots are above the price, it signals a downtrend.
Traders may consider entering short positions or holding existing short positions as long as the dots remain above the price.
Similar to uptrends, the dots act as dynamic trailing stop-loss levels, descending as the downtrend continues.
Strategies for Using Parabolic SAR:
Trend Reversals:
When the price crosses over the Parabolic SAR dots, it may signal a potential trend reversal.
For example, when the price crosses above the dots during a downtrend, it could indicate a bullish reversal, prompting traders to consider exiting short positions or even entering long positions.
Trailing Stop-Loss:
Traders can use the Parabolic SAR dots as dynamic trailing stop-loss levels to protect profits and manage risk.
As the trend progresses, the stop-loss levels adjust accordingly, allowing traders to lock in gains while giving the trade room to breathe.
Confirmation with Other Indicators:
Combine Parabolic SAR with other technical indicators or chart patterns to confirm signals and enhance trading decisions.
For example, use Parabolic SAR in conjunction with moving averages or oscillators to validate trend direction and momentum.
Limitations and Considerations:
While Parabolic SAR offers valuable insights into trend reversals and trailing stop-loss levels, traders should be aware of its limitations and exercise caution:
Whipsaws: In choppy or ranging markets, Parabolic SAR may generate false signals, resulting in whipsaws and potential losses.
Adaptability: Adjust the parameters of Parabolic SAR (e.g., acceleration factor) to suit the specific characteristics of the asset and trading timeframe.
Confirmation: Always confirm Parabolic SAR signals with other technical indicators or fundamental analysis to reduce the likelihood of false positives.
Conclusion:
In the dynamic world of financial markets, the Parabolic SAR stands as a beacon of clarity, offering traders valuable insights into trend dynamics and potential reversal points. Whether you're a day trader, swing trader, or long-term investor, incorporating Parabolic SAR into your trading toolkit can enhance your ability to identify profitable opportunities, manage risk, and optimize returns. By mastering the interpretation and application of Parabolic SAR signals, traders can navigate the complexities of financial markets with confidence and precision, striving towards greater profitability and success.
0 notes
Text
Konstantin Tserazov: Fintech and Banking Sector Development in Gulf Countries: New Frontiers
The environment of higher inflation and higher key rates in the U.S. and eurozone casts a shadow over the banking sector of Gulf countries. Dollar liquidity is tight for an unknown period of time, and the financial sphere of the region must cope with this reality.
Increased Liquidity

Recent data show that Gulf banks have increased their assets. The Central Bank of the UAE has taken a decisive step, injecting local currency into the financial system. This initiative has led to a remarkable increase of 32.5% in the regulator's assets, elevating them to AED 747.6 billion by the conclusion of winter 2024.
As a direct consequence of this liquidity injection, local banks have seized the opportunity to expand their lending activities. This expansion has driven a substantial 12% year-on-year increase in the sector's total gross assets, culminating in a staggering AED 4.2 trillion as of February 2024. Lending growth among banks is outpacing deposits, indicating that the banking sphere relies more on additional liquidity in local currency.
A similar situation can be observed in other regional countries. Saudi banks extended their credit loans up to SAR 2.67 trillion in March 2024, demonstrating an 11% year-on-year growth. This uptrend goes in hand with a rise in the assets of the Saudi Arabian Monetary Authority, nearing SAR 1.85 trillion during the same period.
Within Saudi Arabia, real estate financing experienced a notable surge of 27% in March 2024, marking the most fascinating performance since the summer of 2023, with figures reaching SAR 275.2 billion. Almost every fourth Saudi Riyal in all loans provided by local banks went into the real estate sector.
The balance of Qatari banks also showed significant growth, by 5.6% to QR 1.99 trillion in March 2024, primarily due to new projects in the real estate sphere.
In Oman, local banks’ loan operations expanded by 2.7%, up to OMR 30.6 billion at the end of winter 2024. The expanding real estate sector, coupled with the active monetary policy of the local central bank, enabled this outcome, with credit extended to construction firms exceeding the overall growth rate of loans.
A significant increase in the assets of central banks in the region indicates a proactive monetary strategy designed to supply liquidity, even amidst the quantitative tightening in the U.S. and eurozone. Nonetheless, these measures must be judiciously controlled to avoid problems such as inflation or asset bubbles.
The Banks' Risk of Focusing on the Real Estate Sector
Local regulators need to monitor the growth of Gulf bank assets to ensure that lending and investment practices are sustainable, and that banks maintain sufficient capital and liquidity buffers to withstand potential economic shocks. As we can see, the main area of lending operations in Gulf countries is mortgages, as banks heavily invest in the real estate sector. However, problems in the commercial real estate market in the leading world economy, the U.S., can create depressive pressure on this market in Gulf countries.
U.S. commercial real estate prices fell 7.5% year-on-year. Commercial real estate values by category since the 2022 peak: Multifamily: almost -27%; Office: about -19%. Commercial real estate loans account for about 30% of total assets for U.S. regional banks.
Exchange-traded funds (ETFs) oriented toward the stock of U.S. regional banks showed a negative return, on average -4% year-to-date for the first four months of 2024. In May 2024, the stocks of small regional banks in the U.S. experienced a significant decline in comparison to the stocks of larger banks, marking their lowest point since November 2009.
Concerns among investors in the U.S. are growing, as they begin to lose confidence in the performance of local small banks. This is a bad omen since such small institutions play a crucial role in driving fintech innovations at the regional level and in moving toward raising financial inclusion.
The downward trend in commercial real estate prices in the U.S. shows a dramatic shift not only in the leading world economy but everywhere. People are working more remotely, transacting more online, and this is putting the demand for offline stores and office premises on a track of resilient decline.
Gulf banks have been accustomed to investing in the real estate sector, but they have to swiftly refocus their investments to avoid falling into the same problematic situation as U.S. regional banks.
The Diversification of Investments: Fintech, AI and Data-Centers
Fintech, artificial intelligence, and data centers are currently in the spotlight for investments. Gulf countries are pursuing strategies to create special investment funds aimed at actively participating in the aforementioned spheres.
In 2023, Saudi Arabian startups attracted $2.6 billion, with the majority of this financing (about 55%) coming mostly through domestic investment programs. In 2024, Saudi Arabia's Public Investment Fund is striving to extend their investment facilities aimed at investing in AI-related projects, including those in the finance sphere, with up to $40 billion. The specific interest in AI is connected with the trend toward the development of banking-as-a-service.
The Startup Qatar Investment Program, managed by Qatar Development Bank, operates a $100 million investment structure. The program is primed to release up to $500,000 for new startups in the country, and up to $5 million for seasoned entrepreneurs.
These investment vehicles aimed at the development of fintech startups underscore the need for special structures to promote digitization. In this case, the Gulf region has chosen its specific path. European fintech startups tend to rely on risk-averse bank loans for funding, while U.S. fintech small businesses leverage financing opportunities provided by risk-seeking venture funds and rely heavily on financing provided via the stock market, with bank loans as only a third option. In contrast, Gulf startups tend to rely on financing provided via local incentive programs and state-sponsored investment vehicles.
Indeed, we witness how the state industrial policy in Gulf countries focuses on driving innovations through fintech startups with significant support from central banks, state investment programs, and state-backed funding. Government policies in the region also focus on onboarding foreign talents and capital by creating an attractive business climate through relevant amendments to immigration laws and other regulatory statutes. In this direction, Gulf countries are poised to create more competition for European and U.S. labor and capital markets.
Central Banks' Partnership with Fintech
In their pursuit to feed the market with liquidity, central banks of the region came to the conclusion of the need for the development of digital financial channels in their economies. In this case, collaboration with fintech has become an important step forward.
For example, in April 2024, the National Bank of Oman struck a direct deal with one of the local fintech startups to play a role as a custodian bank for this enterprise. This contract underscores the trend when central banks start playing a more important role in the digitization of financial processes, including the movement into the design and development of central bank digital currencies (CBDCs).
This case only shows that in the movement into a more diversified and decentralized world of finance, the role of centralized institutions is important. The central banks are enhancing their potential in driving financial innovations by extending cooperation between themselves. Thus, in May 2024, the central banks of Qatar and Saudi Arabia penned a partnership agreement aimed at deepening the exchange of practical experience in driving digital innovations in the financial sphere.
The Fintech Transformation: Disrupting Traditional Banking
In the past, brick-and-mortar banks ruled financial lives. From saving to getting loans, they called the shots. Now, fintech is cracking this monopoly. The 2008 world financial crisis, COVID-19, and the 2023 U.S. regional banking drama all fueled a fintech firestorm. These tech-savvy finance companies are on a tear, wielding serious power and changing how we handle our money.
These transformative moments have reshaped consumer financial needs, driving individuals to seek alternative solutions beyond the conventional banking realm. The trust in traditional banks also decreased significantly during these key points in recent global financial history. This shift enabled new generations of financial companies to emerge, resulting in increased competition for the legacy banks.
The Most Promising Fintech Trends in Years to Come
In the coming years, the competition and collaboration between legacy financial institutions and fintech startups in the Middle East will be fostered and guided by regulators in the Gulf countries. The key sphere to watch is the digital payments sector, which will preserve its role as the most prominent part of fintech. Concepts such as embedded finance and open banking, which allow more people and businesses to access this sector, will be in demand.
Financial robo-advising is going to strengthen its power despite the ongoing discussion that AI-driven financial advice can be more effective than investment recommendations provided by humans.
Automated financial advisors, more often AI-based, differ somewhat from human investment advisors. They offer a personalized and low-cost service. In comparison to human investment advisors, they vary in terms of skills and cannot be influenced by emotions, biases, and specific interests.
Meanwhile, human investment specialists can build higher trust with consumers by reducing perceived uncertainty and anxiety and showing empathy for clients. In the years to come, the paramount concern for banks and fintech companies will be the ever-looming danger of data breaches. They will dedicate their efforts towards devising effective strategies to tackle these risks head-on.
Although financial technology has made remarkable strides, the undeniable importance of human connection persists. The all-new fintech can bring more comfort in doing business in the investment sphere, but even the high-end advanced AI advisor won't make up for human emotions and interaction. However, it can help make the investment journey more exciting.
0 notes
Text
Exness Pakistan
6 top ADX indicator strategies to use in online trading
Traders use different types of strategies on a platform because they enable them to get more ideas about various things. The Average Directional Index (ADX) is one of the indicators that allows a trader to measure the strength of a trend with high accuracy. A high ADX indicates a strong trend, and a low ADX suggests a weak market. ADX is useful for both day trading and swing trading purposes that let traders make the most informed decisions. Whether it is a new or experienced trader, they should know the top ADX strategies in online trading.
What are the best ADX strategies to follow in trading?
Combining ADX with Parabolic SAR
A trader should consider combining ADX with parametric SAR because they provide ways to know current trends and potential reversal points. For instance, one can identify a bullish trend when the ADX line is above 25 and the parabolic SAR is below the price bars. This combination works well for identifying a strong trend with potential for further upside.
Using ADX in the Directional Movement (DM) system
One should consider using ADX in the Directional Movement (DM) system that has three lines. It provides methods to measure bullish movements, apart from evaluating the strength of a trend. However, it is wise to combine the same with other tools to get more insights.

Evaluating a strong trend
Traders should evaluate a strong trend when the reading goes above 25. A reading above 25 indicates a strong trend and the likelihood of a trend developing. This, in turn, gives ways to proceed further that will help achieve the best results.
Determining the direction of a trend
A trader should determine the direction of a trend by using the last 50 candlesticks. Using a sample size of 50 candlesticks gives ways to determine a trend. The Exness Pakistan trading platform allows traders to trade different types of assets with the best indicators. It allows a trader to focus more on various things with high accuracy.
ADX price divergence
ADX price divergence issues a warning against a trend during the trading process. On the other hand, a trader should learn more about the strategy with more attention.
The Holy Grail
The Holy Grail strategy involves combining ADX with a moving average that helps find pullbacks using price action. Traders should learn strategies from different sources to maximize efficiency in trading.
1 note
·
View note
Text
Best Forex Robot - Best Free Forex Trading Robot
Best Forex Robot - Best Free Forex Trading Robot

The main thing about these helpful apps is that traders can configure them themselves to help make their trading strategy even more unique or set it up according to a particular signal that other experts have discovered. Nevertheless, expert advisors are great tools that can be used for a variety of different situations. Still, they typically work best in trending markets, and they also need to have effective money management strategies in place as well.
The name "robot" comes from the fact that this software does not need constant interaction like humans usually do while doing trades manually since they can be set to execute certain orders whenever certain conditions become true, sending buy and sell signals.
The best forex robots come in all shapes and sizes may or may not have great success rates. However, you should not follow anyone's advice to use a particular free forex robot without first knowing the facts. Hence, it is recommended that you try and test as many free expert advisors as possible before settling on one or none at all.
The best Forex robots can be classified into various categories: scalping systems, trend following systems, grid trading systems, and martingale systems. So, you may go for the scalping robot mt4 free. However, these best free forex EA programs vary depending on indicators used, such as Parabolic SAR (Stop And Reverse) or RSI (Relative Strength Index), or price action based like Fibonacci retracement levels. All these strategies usually work together with other strategies, which make them even more efficient.
The most common method for creating the best forex robot experts advisor is by using MetaQuotes Language 4 (MQL4), which is the built-in programming language of the most popular forex trading platform, MetaTrader 4. Expert advisors written in MQL4 are able to trade on all currency pairs listed on MT4.
#crypto#forexmoney#forexnews#forexprofit#forexsignals#forexstrategy#forexsuccess#forextips#forextrading#day trading
#best forex brokers#forex account types#forex bonus & forex signals. we offer#forex brokers by country#forex brokers comparison#forex reviews#forex trading platforms#free forex education#scam brokers list#trading resources
0 notes
Text
A Complete Guide to Trend-Following Indicators
There are many distinct trading indicators available on the financial markets, each with a specific function. These indicators are useful for assessing, trading, and making money from the constantly shifting state of price movement.
It is crucial to group these indicators according to their application and the market conditions in which they are most effective for analyzing price movement and providing trading tips.
But before proceeding further, let’s proceed to know what is a trend following a trading strategy.
What Is a Trend Following Indicators?
Technical tools called trend-following indicators assess the strength and direction of trends throughout the selected time frame. Some trend-following indicators are plotted right on the price panel, sending out negative signals when they are above the price and bullish signals when they are below the price. Others are drawn below the panel, producing up- and down-ticks from 0 to 100 or over a central ‘zero’ line, producing bullish or bearish divergences when opposing prices.
The majority of trend-following indicators are ‘lagging’, which means that they produce a buy or sell signal after a trend or reversal has already begun. The most common trailing trend-following indicator is the moving average. These indicators can also be ‘leading’, which means they anticipate price action before it occurs by comparing momentum across many time frames and doing multiple calculations. A well-liked leading trend-following indicator is the parabolic stop and reverse (Parabolic SAR).
There are three main purposes for these indicators. They first make an effort to inform the technician of a changing trend or impending reversal. Second, they make an effort to forecast both short- and long-term price movements. Thirdly, they validate findings and indications in the price pattern and other technical indicators. The parameters used to create the trend-following indication have the most influence on signal dependability. Examples include the generation of distinct buy and sell signals by a 50-day moving average and a 200-day moving average, which may be effective in one-time frame but not the other.
Top Trend-following Indicators
Here, in this section, we will explain the best trend following indicators. Let’s take a quick look:
Moving Averages
One of the most often used trend-following indicators is the moving average. The average price of an asset over a given period of time is shown by a moving average, which is a line. Before making a transaction while you trade forex online, you should frequently use moving averages to confirm the direction and intensity of a trend.
Moving Average Convergence Divergence (MACD)
The difference between two moving averages is measured by the trend-following indicator known as the Moving Average Convergence Divergence (MACD). In order to enter or exit transactions at the ideal time traders frequently use the MACD to spot changes in momentum or trend direction.
Bollinger Bands
A common trend-following indicator called Bollinger Bands uses a series of lines to depict the top and bottom of a trading range. Bollinger Bands are frequently used by traders to assist spot overbought and oversold market circumstances as well as probable trend reversals.
Relative Strength Index (RSI)
The Relative Strength Index (RSI) is another popular trend-following indicator. By contrasting the average gains and losses over a given time period, the RSI gauges the force of a trend.
The RSI is often used by traders to spot overbought and oversold market conditions, which can aid them in making better trading decisions.
Trend Following advantages
Numerous benefits of trend following method include:
Big victories are possible, unlike with previous strategies.
Minimal transaction costs.
Your entrances and exits don’t have to be timed perfectly.
As the trend gets stronger, you could increase your position to increase your chances of making money.
Trend Following Disadvantages
Additionally, there are several drawbacks to trend following, the most prevalent of which are as follows:
It can be difficult mentally to ride the trend.
The win rate (number of winning trades divided by the number of lost trades) is lower.
Because trend following demands that the trend be already in motion, you’ll miss the trend’s beginning.
Final Thoughts
On a leading Forex trading platform, the trader can predict the stock price and choose the optimum time to purchase or sell the stock by using a trend-following technique, which is straightforward. To develop the technique, one needs just employ one trading indicator or one or more indicators in combination.
You can use the different methods for your trades now that you are aware of what trend trading is and what it entails. Before using your strategies, you must, however, perfect them. Use all the tools you have at your disposal, including charts, candlestick patterns, research data, and other tools, to examine the trends.
Originally Published on Theomnibuzz
Source: https://theomnibuzz.com/a-complete-guide-to-trend-following-indicators/
0 notes
Video
youtube
Trading Mastery: MACD, ADX, Parabolic SAR Strategies Revealed,Market Success Blueprint with MACD, ADX, Parabolic SAR Techniques,Trading Mastery: MACD, ADX, Parabolic SAR Strategies Revealed,Market Success Blueprint with MACD, ADX, Parabolic SAR Techniques,Optimize Your Trades: MACD, ADX, Parabolic SAR Strategy Unveiled,Profitable Trading Secrets: MACD, ADX, Parabolic SAR Strategies,Strategic Trading Signals: MACD, ADX, Parabolic SAR Mastery,Maximize Profits with MACD, ADX, Parabolic SAR Trading Tactics,Proven Strategies: MACD ADX Parabolic SAR for Trading Success,Elevate Your Trading Game: MACD, ADX, Parabolic SAR Techniques,Mastering Market Trends: MACD, ADX, Parabolic SAR Strategies,Trade Like a Pro: MACD, ADX, Parabolic SAR Success Guide,MACD Trading Strategies,ADX Indicator Strategies,Parabolic SAR Trading Techniques,MACD ADX Trading Signals,How to Use Parabolic SAR Effectively,MACD Trading Tips and Tricks,ADX Indicator Explained for Traders,Parabolic SAR Trend Analysis,MACD ADX Strategy for Beginners,Mastering Parabolic SAR in Trading,
0 notes
Text
Most Effective Forex Trading Indicators for Every Trader
Indicators for forex trading are tools that traders can use to assess market data and make wise trading decisions. A number of variables, including as your trading strategy, trading style, and personal preferences, affect an indicator's performance. Here are a few of the most popular and successful Online Forex trading indicators that traders frequently include in their tactics:
MAs, or moving averages:
Simple Moving Average (SMA): Aids in trend identification and smoothing out price data.
The exponential moving average (EMA) is more responsive to price fluctuations because it gives greater weight to recent price data.
Using two moving averages (MAs) and a histogram, the Moving Average Convergence Divergence (MACD) indicator can spot trends and potential buy/sell signals.
RSI: Relative Strength Index
calculates the rate and variety of price changes. Indicating overbought and oversold levels allows traders to foresee reversals.
Oscillator Stochastic:
Similar to the RSI but uses a different calculation approach to indicate overbought and oversold circumstances. There are two lines in it: %K and %D.
Using Bollinger Bands
consist of an upper and lower band reflecting standard deviations from the SMA, and a middle band (SMA). Bollinger Bands aid traders in spotting market reversals and volatile periods.
The Fibonacci retracement
Identifies probable levels of support and resistance using Fibonacci ratios (e.g., 38.2%, 50%, and 61.8%).
Cloud Ichimoku:
Provides a thorough analysis of possible support and resistance levels, trend direction, and momentum. The Tenkan-sen, Kijun-sen, Senkou Span A and B, and Chikou Span are only a few of the lines that make up this span.
SAR (Stop and Reverse) using a parabola
provides trailing stop levels, which may be used by traders to protect gains and control risk.
ATR, or average true range
Establishes stop-loss and take-profit levels by measuring market volatility.
Quantity Indicators:
Understanding the strength of a price shift can be gleaned from trading volume. On-Balance Volume (OBV) and Volume Profile are two useful volume indicators.
Williams%R:
It aids in the detection of overbought and oversold conditions and is similar to the stochastic oscillator.
Average Directional Index, or ADX
determines the force of a trend. It can be used by traders to identify a market's trend or range.
Key Points:
These levels of support and resistance were determined using the price information from the previous day. They can aid traders in locating potential breakout or reversal moments.
Indicators frequently perform best when used in conjunction with other indicators or as part of a larger trading strategy, but it's vital to remember that no indication is infallible. When choosing and using indicators, traders should also take into account their risk tolerance, timeframes, and market conditions. Furthermore, any technique must be fully back tested before being used in a real-time trading environment.
#trading online#best online trading#best trading online platform#online trade marketing#best trading platforms#online trading company#best forex trading website#forex trading techniques#best trading website#trading techniques
0 notes
Text
Polygon co-founder submitted a proposal to the ApeCoin DAO governance forum for the creation of its own zero-knowledge Layer-2 blockchain.
APE has seen a significant decline in demand since the month began.
In a new proposal dated 10 October, Polygon’s co-founder Sandeep Nailwal suggested that ApeCoin DAO develop its own zero-knowledge Layer-2 (zk-L2) blockchain using the Polygon Chain Development Kit (CDK).
Read ApeCoin’s [APE] Price Prediction 2023-2024
The proposal comes nearly 18 months after Yuga Labs, the creators of the Bored Ape Yacht Club NFT collection, tweeted that ApeCoin “will need to migrate to its own chain in order to properly scale” following its “Otherside” NFT minting event in April 2022, which resulted in the highest gas fees in the history of the Ethereum [ETH] network.
We're sorry for turning off the lights on Ethereum for a while. It seems abundantly clear that ApeCoin will need to migrate to its own chain in order to properly scale. We'd like to encourage the DAO to start thinking in this direction.
— Yuga Labs (@yugalabs) May 1, 2022
The ApeCoin DAO voted in a later proposal to keep ApeCoin within the Ethereum ecosystem. However, the question of an ApeCoin-specific chain remains open.
In his proposal, the co-founder argued in favor of Polygon’s CDK for the proposed zk-L2 network by highlighting its security, low fees, shared liquidity, customizability, and interoperability, making it suitable for achieving ApeCoin DAO’s goals.
According to Nailwal:
“ApeChain will provide the ApeCoin DAO with an efficient, secure, and decentralized execution environment upon which ApeCoin DAO projects can be built to help realize this mission.”
APE holders have it rough
At press time, the project’s native token APE traded at $1.04. In the last month, its price has declined by 10%, according to data from CoinMarketCap.
The month so far has been marked by a drop in demand for the metaverse-based token. On 2 October, the token attained a price peak of $1.29 and has since declined by 19%.
Source: CoinMarketCap
An assessment of the movements of key momentum indicators on a daily chart lent credence to the above position.
After the bears initiated a downtrend on 3 October, the token’s Relative Strength Index (RSI) and Money Flow Index (MFI), initially positioned above their respective center lines, began trending downwards.
As of this writing, the token’s MFI approached the oversold zones at 28.34, while its RSI was spotted at 35.37. This suggested that token sell-offs have significantly exceeded accumulation in the last two weeks.
Moreover, APE’s Parabolic Stop and Reverse (SAR) indicator – which identifies potential reversal points in an asset’s price direction- confirmed the market’s downtrend.
How much are 1,10,100 APEs worth today?
When the dots that make up the indicator are positioned above the price, it indicates a downtrend. Also, when these dots are closely packed together, it suggests that the trend is strong. All of these were true in APE’s case at the time of writing.
Lastly, its Aroon Down Line (blue) at 78.57% indicated that the downtrend was strong, and APE’s most recent price low was reached relatively recently.
Source: APE/USDT on TradingView
0 notes
Text
Unveiling Mastery: The 12 Best Technical Analysis Tools for Traders
Technical analysis is a fundamental aspect of trading in the financial markets. It involves studying historical price and volume data to forecast future price movements. Traders employ various tools to analyze charts and identify potential trading opportunities. From simple trendlines to complex indicators, the arsenal of technical analysis tools is vast and diverse. In this article, we'll explore 12 of the best technical analysis tools that traders use to make informed decisions and enhance their trading strategies.
Moving Averages: Moving averages are among the most popular technical analysis tools. They smooth out price data by calculating the average closing price over a specified period. Traders use moving averages to identify trends, determine support and resistance levels, and generate buy or sell signals.
Relative Strength Index (RSI): The RSI is a momentum oscillator that measures the speed and change of price movements. It oscillates between 0 and 100 and is used to identify overbought or oversold conditions in the market. Traders look for divergences between price and the RSI to anticipate potential reversals.
MACD (Moving Average Convergence Divergence): MACD is a trend-following momentum indicator that consists of two lines – the MACD line and the signal line. Traders use MACD to identify changes in trend direction, confirm trend strength, and generate buy or sell signals.
Bollinger Bands: Bollinger Bands consist of a simple moving average and two standard deviations plotted above and below the moving average. They help traders identify volatility and potential reversal points. When the price touches or crosses the upper or lower band, it may indicate overbought or oversold conditions.
Fibonacci Retracement: Fibonacci retracement levels are based on the mathematical relationships identified by the Fibonacci sequence. Traders use Fibonacci retracement levels to identify potential support and resistance levels and predict the extent of price corrections during trends.
Volume Profile: Volume profile displays the volume traded at each price level over a specified period. It helps traders identify significant support and resistance zones based on the volume of trades. Traders use volume profile to confirm price movements and anticipate potential reversals.
Ichimoku Cloud: The Ichimoku Cloud is a comprehensive indicator that provides insights into trend direction, momentum, and support and resistance levels. It consists of several components, including the Kumo (cloud), Tenkan-sen (conversion line), and Kijun-sen (baseline). Traders use the Ichimoku Cloud to identify trend changes and trading opportunities.
Stochastic Oscillator: The Stochastic Oscillator is a momentum indicator that compares the closing price of a security to its price range over a specified period. It oscillates between 0 and 100 and is used to identify overbought or oversold conditions. Traders look for bullish or bearish divergences to anticipate reversals.
Average True Range (ATR): ATR measures market volatility by calculating the average range between high and low prices over a specified period. Traders use ATR to set stop-loss and take-profit levels based on the volatility of the market.
Pivot Points: Pivot points are mathematical calculations based on the previous day's high, low, and close prices. They help traders identify potential support and resistance levels for the current trading day. Pivot points are widely used by day traders to plan entry and exit points for their trades.
Parabolic SAR (Stop and Reverse): Parabolic SAR is a trend-following indicator that provides entry and exit signals based on price momentum. It places dots above or below the price chart, indicating potential trend reversals. Traders use Parabolic SAR to trail stop-loss orders and identify potential trend changes.
Volume Oscillator: Volume oscillator compares the volume of trades over two different periods and displays the difference as an oscillator. It helps traders identify changes in volume momentum and confirm the strength of price movements. Traders use volume oscillator to identify bullish or bearish signals based on volume divergence.
In conclusion, mastering technical analysis tools is essential for traders looking to navigate the dynamic world of financial markets. While the tools mentioned above are among the most popular and widely used, it's important for traders to experiment and find the combination of tools that best suits their trading style and objectives. By incorporating these technical analysis tools into their trading strategies, traders can make more informed decisions and increase their chances of success in the markets.
0 notes
Text
ADX and Parabolic SAR EAs: Trend Confirmation
Trend confirmation is a vital aspect of successful trading, allowing traders to validate the strength and direction of market trends before making trading decisions. Two popular technical indicators used for trend confirmation are the Average Directional Index (ADX) and the Parabolic Stop and Reverse (SAR). forex Expert Advisors (EAs) are frequently employed to automate trading strategies based on these indicators. In this article, we will explore the ADX and Parabolic SAR indicators, how EAs implement strategies using them, and the advantages of trend confirmation in trading.
1. Understanding the ADX and Parabolic SAR Indicators
What Is the ADX Indicator?
The Average Directional Index (ADX) is a technical indicator that measures the strength and direction of a trend. It is part of the Directional Movement System and is composed of three lines:
ADX Line: The ADX line quantifies the strength of the trend, with values ranging from 0 to 100. Higher values indicate a stronger trend, while lower values suggest a weaker or sideways market.
+DI Line: The Positive Directional Indicator (+DI) measures the strength of the uptrend. It is calculated by comparing the current high to the previous high.
-DI Line: The Negative Directional Indicator (-DI) measures the strength of the downtrend. It is calculated by comparing the current low to the previous low.

What Is the Parabolic SAR Indicator?
The Parabolic Stop and Reverse (SAR) is a trend-following indicator designed to identify potential reversal points in price trends. It places dots either above or below price candles, indicating the direction of the trend. When dots switch from being above to below the price, it suggests a potential trend reversal from bullish to bearish, and vice versa.
2. Implementing ADX and Parabolic SAR Strategies with EAs
EAs are used to automate trading strategies based on the ADX and Parabolic SAR indicators. Here's how EAs implement these strategies:
a. Strategy Definition
Traders define the ADX and Parabolic SAR strategy, specifying parameters such as the timeframes for these indicators, the conditions for trend confirmation, and the entry and exit criteria.
b. Market Analysis
The EA continuously analyzes market conditions by calculating the ADX and Parabolic SAR values based on historical and real-time price data.
c. Signal Generation
Based on the predefined strategy and the interaction of price with the ADX and Parabolic SAR, the EA generates trading signals. These signals indicate potential entry and exit points and the direction of the trade (long or short).
d. Order Execution
The EA automatically executes trades based on the generated signals. It can place market orders, limit orders, or stop orders, depending on the strategy's conditions.
e. Risk Management
Effective risk management is crucial when using ADX and Parabolic SAR-based strategies. EAs often incorporate stop-loss and take-profit levels based on these indicators or other risk management techniques.
f. Position Monitoring
The EA continuously monitors open positions, tracks changes in ADX and Parabolic SAR values, and makes adjustments as necessary. This may involve trailing stops, modifying take-profit levels, or closing positions.
3. Advantages of Trend Confirmation with ADX and Parabolic SAR EAs
a. Objective Trend Assessment: ADX and Parabolic SAR EAs provide objective signals for confirming trends, reducing emotional biases in trading decisions.
b. Versatility: These indicators can be applied to various asset classes and timeframes, making them adaptable to different trading preferences.
c. Improved Timing: Trend confirmation helps traders enter and exit trades at more opportune moments, potentially increasing profitability.
4. Considerations for Using ADX and Parabolic SAR EAs
a. Strategy Development: Traders should thoroughly understand the ADX and Parabolic SAR strategy they are using and consider backtesting it with historical data.
b. Risk Management: Implement proper risk management, including stop-loss and take-profit levels, to protect capital when trading with ADX and Parabolic SAR EAs.
c. Real-Time Monitoring: Continuously monitor the performance of trend confirmation strategies and be prepared to make adjustments if market conditions change.
In conclusion, ADX and Parabolic SAR EAs offer traders a valuable tool for confirming trends and making more informed trading decisions. The ability to objectively assess trend strength and potential reversals can enhance trading strategies and potentially lead to more profitable outcomes. However, traders should approach trend confirmation with a well-defined strategy, effective risk management, and continuous monitoring to maximize their effectiveness in navigating dynamic market conditions.
0 notes
Text
Does an indicator work in Forex?
Indicators can be useful tools in Forex trading, but they are not foolproof and do not guarantee success. An indicator in Forex is a mathematical calculation based on historical price data, volume, or open interest that aims to provide insights into market trends, momentum, volatility, and potential entry or exit points for trades.
Super Arrow mt4 indicator
Different types of indicators exist, including:
1. **Trend-following indicators**: These indicators help traders identify the direction of the prevailing trend in the market. Examples include Moving Averages (MA), Ichimoku Cloud, and Parabolic SAR.
2. **Oscillators**: Oscillators help traders identify overbought or oversold conditions in the market, which can suggest potential reversal points. Examples include the Relative Strength Index (RSI), Stochastic Oscillator, and the Moving Average Convergence Divergence (MACD).
3. **Volatility indicators**: These indicators measure the degree of price variability in the market. Examples include the Average True Range (ATR) and Bollinger Bands.
While indicators can provide valuable insights and support decision-making, they are not perfect and have limitations. Here are some points to consider:
1. **Lagging nature**: Many indicators are based on past price data, so they can lag behind real-time market movements. This lag can lead to delayed signals and potentially missed opportunities.
2. **False signals**: Indicators can produce false or misleading signals, especially during choppy or ranging market conditions. Relying solely on indicators without considering other factors can be risky.
3. **Subjectivity**: Traders may interpret indicators differently, leading to varying trading decisions. The effectiveness of an indicator can depend on the trader's experience and skill in using it.
4. **Changing market conditions**: Market dynamics can change over time, affecting the reliability of certain indicators. An indicator that worked well in the past may not perform as effectively in the future.

Indicators can be useful tools in Forex trading, but it's essential to understand their limitations and use them in conjunction with other analysis methods. Indicators are mathematical calculations based on historical price data or other market-related information, and they are used to provide insights into potential market trends, momentum, volatility, and other aspects of the price action.
Some commonly used indicators in Forex trading include Moving Averages (MA), Relative Strength Index (RSI), Moving Average Convergence Divergence (MACD), Bollinger Bands, and many others.
The effectiveness of indicators depends on various factors, including the trader's strategy, timeframe, and the market conditions. Here are some points to consider regarding the use of indicators:
1. Lagging Nature: Most indicators are lagging in nature, meaning they use past price data to generate signals. As a result, they may not provide real-time insights into market movements and can sometimes give delayed signals.
2. Subjectivity: Different traders may interpret indicators differently, leading to varying trading decisions. This subjectivity can sometimes lead to conflicting signals or confusion.
3. Complementary Analysis: Indicators are best used as part of a comprehensive trading strategy, along with other forms of analysis like fundamental analysis, price action analysis, and market sentiment analysis.
4. False Signals: Indicators can generate false signals, especially in choppy or sideways markets. Relying solely on indicators without considering other factors may lead to poor trading decisions.
5. Historical Performance: Past performance of an indicator does not guarantee future results. Market conditions can change, and indicators may lose their effectiveness during certain periods.
6. Over-optimization: Traders should avoid over-optimizing indicators to fit historical data perfectly, as it may lead to curve-fitting and unreliable results in live trading.
In conclusion, indicators can be valuable tools when used judiciously and in conjunction with other analysis methods. Traders should avoid relying solely on indicators and focus on building a robust trading strategy that considers multiple factors influencing the market. Continuous learning, practice, and risk management are essential components of successful Forex trading.
0 notes
Text
Bitcoin Bull Run In Jeopardy As Parabolic SAR Flips Bearish On Daily Chart
Bitcoin (BTC), the world’s largest cryptocurrency, is facing a potential correction as it loses support at a critical level and trades at $27,300. Technical analysis shows that the Parabolic SAR has flipped bearish on the daily chart, indicating a possible downturn shortly. Bitcoin’s price has also dropped below the 50 exponential moving average (EMA), a critical support level.
The Parabolic SAR…
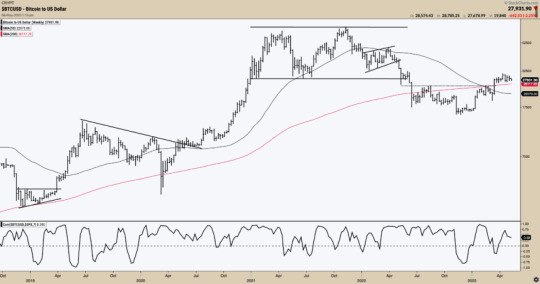
View On WordPress
0 notes
Text
What are Trading Indicators?
If you're new to trading or looking to enhance your trading strategies, understanding trading indicators is a crucial step. Trading indicators are powerful tools that help traders analyze market conditions, identify trends, and make informed trading decisions. They are mathematical calculations applied to historical price and volume data, providing insights into potential entry and exit points, market strength, and trend reversals. By incorporating these indicators into your trading approach, you can gain a competitive edge and increase your chances of success in the financial markets.
From trend-following indicators that highlight the direction of the market to oscillators that help identify overbought or oversold conditions, there is a wide range of trading indicators to choose from. Each indicator has its unique calculation methodology and interpretation. Some popular examples include Moving Averages, Relative Strength Index (RSI), Bollinger Bands, and MACD (Moving Average Convergence Divergence). These indicators can be applied to various financial markets, such as stocks, forex, commodities, and cryptocurrencies, enabling traders to make informed decisions across different asset classes.
Are you ready to take your trading to the next level? By mastering the art of trading indicators, you can gain valuable insights into market trends, price movements, and potential reversals. Join me in my upcoming blog posts, where we'll explore different types of trading indicators in detail, learn how to use them effectively in your trading strategies, and uncover advanced techniques to maximize their effectiveness. Get ready to enhance your trading skills, make smarter trading decisions, and embark on a successful trading journey. Stay tuned and get ready to dive into the fascinating world of trading indicators!
What is a Trading Indicator?
Trading indicators are mathematical calculations or visual representations of market data that provide insights into the current and future direction of price movements in financial markets. These indicators are derived from various types of data, such as price, volume, or open interest, and are used by traders to identify potential trading opportunities, determine market trends, and make informed trading decisions.
Types of Trading Indicators
There is a wide range of trading indicators available, each designed to serve a specific purpose and provide unique insights into market dynamics. Let's explore some of the most commonly used types of trading indicators:
Trend Following Indicators
Trend following indicators are used to identify and confirm the direction of market trends. These indicators are particularly useful for traders who prefer to ride the momentum of an established trend. Some popular trend following indicators include Moving Averages, Average Directional Index (ADX), and Parabolic SAR.
- Moving Averages: Moving averages calculate the average price over a specific period and help smooth out price fluctuations, making it easier to identify trends.
- Average Directional Index (ADX): The ADX indicator measures the strength of a trend and helps traders determine whether a market is trending or ranging.
- Parabolic SAR: The Parabolic SAR indicator is used to identify potential trend reversals and provides stop-loss levels for traders.
Best Trend Following Indicators
Oscillators
Oscillators are indicators that fluctuate within a specific range, indicating overbought or oversold conditions in the market. These indicators are valuable for identifying potential turning points in the price and generating buy or sell signals. Commonly used oscillators include Relative Strength Index (RSI), Stochastic Oscillator, and Moving Average Convergence Divergence (MACD).
- Relative Strength Index (RSI): The RSI measures the speed and change of price movements and is used to identify overbought or oversold conditions in the market.
- Stochastic Oscillator: The Stochastic Oscillator compares the closing price of an asset to its price range over a specific period, helping traders identify potential reversals.
- Moving Average Convergence Divergence (MACD): The MACD indicator is a versatile tool that combines trend-following and momentum elements. It provides signals based on the interaction between two moving averages.
Oscillators Indicators
Volume Indicators
Volume indicators analyze the trading volume of a security and provide insights into the strength or weakness of a price movement. These indicators help traders confirm trends, identify potential reversals, and gauge market participation. Popular volume indicators include On-Balance Volume (OBV), Chaikin Money Flow, and Volume Weighted Average Price (VWAP).
- On-Balance Volume (OBV): The OBV indicator measures buying and selling pressure based on the cumulative volume of a security. It helps traders confirm trends and anticipate trend reversals.
- Chaikin Money Flow: The Chaikin Money Flow indicator combines price and volume data to measure the flow of money into or out of a security. It helps traders assess the strength of a price trend.
- Volume Weighted Average Price (VWAP): The VWAP indicator calculates the average price weighted by trading volume. It is commonly used by day traders to identify potential support or resistance levels.
Volume Indicators
Volatility Indicators
Volatility indicators measure the rate at which prices of a security fluctuate. These indicators help traders identify periods of high or
low volatility, which can be useful for determining entry and exit points. Volatility indicators can also assist in setting appropriate stop-loss and take-profit levels. Some widely used volatility indicators include Bollinger Bands, Average True Range (ATR), and Donchian Channels.
- Bollinger Bands: Bollinger Bands consist of a moving average (typically the 20-day simple moving average) and two standard deviation lines above and below the moving average. They expand and contract based on market volatility, providing insights into potential price breakouts or reversals.
- Average True Range (ATR): The ATR indicator measures the average range between high and low prices over a specified period. It helps traders gauge the volatility of an asset and determine suitable stop-loss levels.
- Donchian Channels: Donchian Channels plot the highest high and lowest low prices over a specified period. Traders can use these channels to identify breakouts and set stop-loss or take-profit levels.
Volatility Indicators
Sentiment Indicators
Sentiment indicators gauge the overall sentiment or market psychology of traders and investors. These indicators help assess whether the market is bullish, bearish, or neutral, and can be valuable for contrarian trading strategies. Examples of sentiment indicators include the Put/Call Ratio, the Volatility Index (VIX), and the Commitment of Traders (COT) report.
- Put/Call Ratio: The Put/Call Ratio compares the trading volume of put options to call options. A high ratio suggests bearish sentiment, while a low ratio indicates bullish sentiment.
- Volatility Index (VIX): The VIX, also known as the "fear index," measures market volatility and investor expectations of future price fluctuations. It can be used as a contrarian indicator, with high levels indicating fear and potential buying opportunities.
- Commitment of Traders (COT) report: The COT report provides insights into the positions of large traders, such as commercial hedgers and institutional investors. It helps traders assess the sentiment and positioning of market participants.
Sentiment Indicators
How to Use Trading Indicators
Now that we have explored the different types of trading indicators, let's discuss how to effectively use them in your trading strategies. Keep in mind that trading indicators should not be used in isolation but rather in conjunction with other analysis techniques and risk management principles. Here are some key considerations when using trading indicators:
Define Your Trading Goals and Strategy
Before incorporating trading indicators into your approach, it's essential to define your trading goals and strategy. Determine your preferred trading style (e.g., day trading, swing trading, or long-term investing) and the financial markets you want to trade (e.g., stocks, forex, or commodities). This clarity will help you select the most relevant indicators for your trading objectives.
Understand the Indicator's Calculation and Interpretation
Each trading indicator has a specific calculation methodology and interpretation. Take the time to understand how the indicator is calculated and what signals or insights it provides. Read the indicator's documentation, consult reputable educational resources, or seek guidance from experienced traders to grasp its nuances fully.
Avoid Indicator Overload
While it may be tempting to use multiple indicators simultaneously, it's crucial to avoid indicator overload. Having too many indicators can lead to conflicting signals and confusion. Instead, focus on a few well-chosen indicators that complement each other and align with your trading strategy. Remember, quality over quantity.
Combine Indicators for Confirmation
One effective way to use trading indicators is to combine different types of indicators to confirm signals. For example, you can use a trend-following indicator to identify the overall trend and an oscillator to pinpoint potential entry or exit points within that trend. When multiple indicators align and generate signals in the same direction, it increases the probability of a successful trade.
Implement Proper Risk Management
While trading indicators can provide valuable insights, it's crucial to implement proper risk management strategies alongside their use. Here are some risk management principles to keep in mind:
- Set Stop-Loss and Take-Profit Levels: Determine your risk tolerance and set appropriate stop-loss and take-profit levels for each trade. Stop-loss orders help limit potential losses if the market moves against your position, while take-profit orders allow you to secure profits when the price reaches your target.
- Use Position Sizing: Calculate the appropriate position size for each trade based on your risk tolerance and the distance between your entry and stop-loss levels. Position sizing ensures that you don't risk an excessive amount of your capital on a single trade.
- Diversify Your Portfolio: Avoid overexposure to a single asset or market. Diversify your portfolio by trading multiple assets or using different trading strategies. This helps spread your risk and reduce the impact of adverse price movements.
- Practice Proper Capital Management: Only allocate a portion of your trading capital to any single trade. Avoid risking a significant portion of your funds on a single trade, as it can lead to substantial losses. Instead, divide your capital among multiple trades to diversify risk.
- Regularly Review and Adjust: Continuously monitor your trades and assess their performance. If certain indicators or strategies are consistently underperforming, consider making adjustments or exploring alternative approaches. Regularly reviewing and adapting your trading plan is essential for long-term success.
Advanced Strategies for Trading with Indicators
Now that we have covered the basics of trading indicators and their usage, let's delve into some advanced strategies that can help you maximize their effectiveness.
Multiple Time Frame Analysis
One powerful technique is to perform multiple time frame analysis. Instead of relying solely on a single time frame, such as the daily chart, consider analyzing higher and lower time frames as well. For example, if you are trading based on a daily chart, also examine the weekly and hourly charts. This approach provides a broader perspective of the market and helps you identify trends and patterns that may not be evident on a single time frame. By aligning signals across multiple time frames, you can increase the probability of successful trades.
For instance, if the daily chart indicates an uptrend, but the weekly chart shows a strong resistance level approaching, it may be wise to exercise caution and consider taking profits or adjusting your position size.
Indicator Divergence
Divergence occurs when the price of an asset moves in the opposite direction of the indicator. It often signifies a potential trend reversal or a weakening of the current trend. Divergence can be bullish or bearish.
Bullish Divergence: Bullish divergence occurs when the price forms lower lows, but the indicator forms higher lows. It suggests that selling pressure is weakening, and a bullish reversal may be imminent. Traders can look for bullish divergence as a potential buying opportunity.
Bearish Divergence: Bearish divergence occurs when the price forms higher highs, but the indicator forms lower highs. It indicates that buying pressure is diminishing, and a bearish reversal may be on the horizon. Traders can watch for bearish divergence as a signal to consider short positions or tighten stop-loss levels.
Confirmation with Candlestick Patterns
Candlestick patterns provide valuable insights into market sentiment and can be used to confirm signals generated by trading indicators. By combining the analysis of candlestick patterns with indicator signals, you can strengthen your trading decisions.
For example, if a trend-following indicator generates a buy signal, look for bullish candlestick patterns, such as a bullish engulfing pattern or a hammer, to confirm the signal. Similarly, if an oscillator indicates overbought conditions, watch for bearish candlestick patterns, like a shooting star or a bearish engulfing pattern, to validate the potential reversal.
Customizing Indicator Settings
Most trading indicators come with default settings, but they can be adjusted to suit your trading style and preferences. Experimenting with different parameter settings can help fine-tune the indicators for improved accuracy.
For instance, moving averages have different periods (e.g., 20-day, 50-day, or 200-day). Shorter periods are more sensitive to price movements, while longer periods provide a smoother average. Find the balance that aligns with your trading strategy and the time frame you are analyzing.
Backtesting and Optimization
Before implementing any indicator-based strategy in live trading, it is essential to backtest and optimize the strategy using historical data. Backtesting involves applying your trading rules to past market data to assess their performance. This process helps you evaluate the profitability and reliability of your strategy before risking real capital.
Additionally, optimization allows you to test different indicator settings and parameters to find the optimal configuration for your strategy. Remember to use out-of-sample data to validate your optimized strategy to ensure it is not overfitting to past data.
Combine Indicators from Different Categories
Another approach is to combine indicators from different categories to gain a more comprehensive view of the market. For example, you can combine a trend-following indicator, such as the Moving Average, with an oscillator, such as the Relative Strength Index (RSI), to identify potential entry points within an established trend. By using indicators from different categories, you can leverage the strengths of each indicator and increase the robustness of your trading strategy.
For instance, you could wait for a trend-following indicator to confirm the direction of the market trend. Once the trend is established, you can then look for oversold or overbought conditions using an oscillator to pinpoint favorable entry or exit points within that trend. This combination helps you align your trades with the prevailing trend while also considering market momentum.
Remember, it's important to strike a balance and avoid overcrowding your charts with too many indicators. Focus on a few well-chosen indicators that complement each other and provide meaningful insights into the market conditions you are trading.
Practice Discipline and Patience
Trading with indicators requires discipline and patience. Avoid the temptation to enter trades solely based on a single indicator signal. Wait for additional confirmation from other indicators or analysis techniques before executing a trade. By exercising patience and waiting for high-probability setups, you can increase your chances of success.
Additionally, stick to your trading plan and avoid impulsive decisions based on short-term market fluctuations. Trust the signals generated by your indicators and follow your predefined risk management rules consistently.
Continual Learning and Adaptation
The financial markets are dynamic and ever-changing, requiring traders to continually learn and adapt. Stay updated with the latest developments in trading indicators and techniques. Explore new indicators, study different trading strategies, and analyze market conditions to refine your approach.
Engage with trading communities, participate in forums or webinars, and read educational materials to gain insights from experienced traders. Continual learning and adaptation will help you stay ahead of the curve and enhance your trading skills over time.
Conclusion
Trading indicators are powerful tools that can provide valuable insights into market trends, momentum, and potential reversals. By understanding the different types of indicators, employing advanced strategies, and combining indicators effectively, you can enhance your trading decisions and improve the overall profitability of your trades.
However, it's important to remember that indicators are not infallible and should always be used in conjunction with other analysis techniques and risk management principles. Developing a robust trading strategy that incorporates indicators while considering market conditions and individual preferences is key to successful trading.
Remember, trading requires practice, discipline, and continual learning. Regularly assess and evaluate your trading performance, adapt your strategies as needed, and always prioritize risk management. With time, experience, and a deep understanding of trading indicators, you can navigate the financial markets with confidence and increase your chances of achieving consistent profitability.
FAQs
What are trading indicators? Trading indicators are mathematical calculations applied to historical price and volume data in the financial markets. They help traders analyze market conditions, identify trends, and make informed trading decisions. These indicators provide insights into potential entry and exit points, market strength, and trend reversals. They come in various types, such as trend-following indicators, oscillators, volume-based indicators, and volatility indicators. How do trading indicators work? Trading indicators work by processing historical market data to generate signals or graphical representations that traders can interpret. They use mathematical formulas and statistical calculations to identify patterns, trends, and potential market conditions. Traders can use these indicators to confirm or validate their trading strategies, identify buying or selling opportunities, and manage risk. What are some commonly used trading indicators? There is a wide range of trading indicators available, and the choice of which to use depends on the trader's trading style and preferences. Some commonly used trading indicators include Moving Averages, Relative Strength Index (RSI), Bollinger Bands, MACD (Moving Average Convergence Divergence), Stochastic Oscillator, and Fibonacci retracement levels. Each indicator has its specific calculation method and interpretation, providing different insights into the market. Can trading indicators guarantee profitable trades?
Read the full article
0 notes
Text
Technical Analysis Indicators for Stock Market
Technical indicators are key tools used in stock market technical analysis. Indicators refer to signals that are derived from historical price, volume, or open interest data with the aim of predicting future price movements. These signals are used to determine entry and exit levels in a trade. Technical indicators are a crucial component of technical analysis and are typically plotted on or alongside Technical Analysis charts. Today we will explore the different types of Technical Indicators that exist.
Trend indicators – Trend indicators are overlay indicators that assist in identifying the direction of the market or an asset's price movement over an extended period. While trend indicators are considered lagging indicators, they are useful in determining entry and exit points. Examples of trend indicators include moving average (MA), Parabolic Stop and Reverse (Parabolic SAR), and Ichimoku Cloud.
Momentum indicators – Momentum indicators are used to measure the rate of price change and determine the strength and weakness of a stock price. These indicators predict the strength of the stock move before the move happens and are shown in a separate window known as oscillators. Examples of momentum indicators include Relative Strength Index (RSI), Stochastic Oscillator, and Moving Average Convergence and Divergence (MACD).
Volatility indicators – Volatility indicators are used to measure the rate of price movement regardless of direction, based on the change in the highest and lowest historical price. These indicators provide information about the ranges of buying and selling that occur in a given market and assist in determining potential market reversals. Volatility indicators are usually lagging in nature and are shown in a separate window. Examples of volatility indicators include Bollinger Bands, Average True Range (ATR), and Standard Deviation (SD).
Volume indicators – Volume indicators measure the strength of a trend or provide confirmation of the trading direction based on some form of averaging or smoothening of raw volume data. These indicators are shown in a separate window and help to identify the strongest trend, which often occurs when there is an increase in volume. Examples of volume indicators include On-balance Volume (OBV) and Volume Rate of Change.
In conclusion, technical analysis is an important tool for traders to make informed decisions about buying and selling assets in the market. Technical indicators are the most important tool for stock market technical analysis. By using technical analysis and understanding the different indicators available, traders can make better decisions about when to enter and exit trades, ultimately improving their chances of success in the market. To learn more about Technical Analysis and use a high-end charting software visit www.stockknocks.com.
Source: https://www.stockknocks.com/blogs/technical-analysis-indicators-for-stock-market
0 notes
Last Seen Blogs


sheabutterrosesandeucalyptuspls
Minimalist and classic feminine style inspo

axelkredosblog
Axel Kredo


modglobug
Mod Glo