#retest in technical analysis
Explore tagged Tumblr posts
Visit Tumblr Blog
Explore Tumblr blogs with no restrictions, modern design and the best experience.
Last Seen Tumblr Blogs


Fun Fact
The Tumblr office adopted Tommy, an 11-year-old Pomeranian.
Text
How to Trade the Breakout & Retest Pattern: Strategies That Work
Breakout and retest trading is one of the most reliable techniques in technical analysis. It allows traders to enter trades with confidence after confirming the breakout of a key support or resistance level. If executed correctly, it offers high probability entries, clear invalidation points, and strong risk-to-reward ratios. In this blog, we’ll break down everything you need to know about the…
#breakout and pullback strategy#breakout and retest confirmation#breakout and retest pattern#breakout and retest trading strategy#breakout continuation pattern#breakout entry strategy#breakout retest candlestick pattern#breakout reversal signals#breakout trading risk management#breakout trading strategy for beginners#breakout vs breakdown#chart patterns with breakout#Confluence Trading#failed breakout recovery#fake breakout vs real breakout#Fibonacci breakout confluence#high probability breakout setup#how to identify breakout levels#how to trade breakout and retest#intraday breakout and retest setup#key support and resistance zones#learn technical analysis#Price Action Trading#retest after breakout#retest in technical analysis#stock markets#stock trading#successful trading#support and resistance breakout#swing trading breakout strategy
0 notes
Text
Gold Price Forecast: XAU/USD Breakdown Levels Identified
Gold (XAU/USD) Technical Analysis
Gold breakdown analysis and levels to note
Retest of recent level of support (now resistance) adds to the bearish outlook
Momentum via the MACD supports lower prices while the RSI suggests more room to the downside is possible.
Gold Breakdown Analysis and Levels to Note
Gold has continued its decline that began after reaching an all-time high of 2081.82 in early May after a resurgence of regional banking woes in the US culminated in JP Morgan absorbing the troubled First Republic Bank. The move lower ran out of steam and entered into a period of consolidation near the lower bound of the ascending channel (refer to daily chart) before renewed bearish momentum resulted in a break and hold below the ascending channel on the weekly chart.
From current levels, 1875 appears as the most relevant level of support as it had acted as a pivot point on multiple occasions despite that coming in the form of resistance, capping higher prices at the time. Nevertheless, it is a crucial level for both bulls and bears. Now that prices have closed below the upward-sloping channel, the next level of resistance appears all the way at 1956 — a prior level that had kept bulls at bay.
Gold XAU/USD Weekly Chart
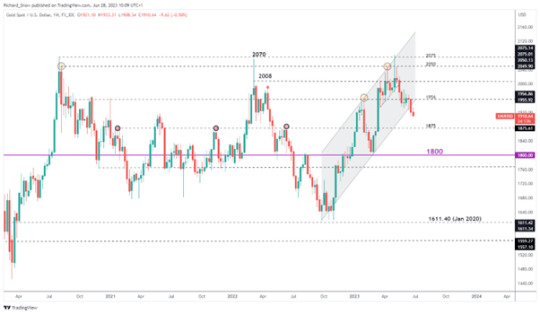
Source: TradingView, prepared by Richard Snow
Textbook-like Retest Suggests Further Downside for Gold
Typically, breakouts and breakdowns have a tendency to retest the level that had just been broken, meaning pullbacks after breaks are often observed. Over the weekend geopolitical tensions picked up a notch in eastern Europe, seeing gold prices retest 1937 and the underside of the ascending channel before heading lower in subsequent trading sessions.
Prices now trade below 1915 which acted as support for the months of March and April last year. A close beneath this level on the daily chart adds to the bearish outlook, with ample room to run before the 1875 level and the 200 simple moving average comes into play. Resistance at 1937 on the daily chart.

#marketing#financialservices#forextrading#gambit#forexbot#accounting#forex online trading#wealthmanagement#forex#youtube#forex trading#trading bot
3 notes
·
View notes
Text
11 Strategic Forex Trade Setups Amid Market Volatility

Market Analysis
GOLD
GOLD remains below recent highs as traders reassess after the surprising decline that followed bullish geopolitical developments. Despite expectations for a rally—given Middle East tensions and a weakening U.S. Dollar—larger profit-taking likely drove prices down temporarily. For strategic forex trade planning, this presents a key area for reassessing long positions. While the MACD indicates bearish growth and RSI shows overbought signals, a normalization may provide a better re-entry point.
SILVER
SILVER is holding firm near support at 36.7308 following its retreat from recent highs. Metals seem to be consolidating, partly due to shifting safe-haven demand into Oil. However, we anticipate further bullish follow-through. These levels remain important for traders applying multi-pair forex strategies or looking at commodity-currency correlations.
DXY
The Dollar surged following the Fed’s rate hold and Powell’s comments on tariff-driven inflation. With traders recalibrating rate cut expectations, the MACD and RSI both confirm bullish momentum. The DXY’s move above the EMA200 supports near-term strength. However, forex analysis and predictions suggest this may be temporary. Price action traders should monitor whether this move continues or corrects after the FOMC fallout.
GBPUSD
The Pound broke key structure levels, continuing its bearish trend. The MACD and RSI both show heavy selling volume and momentum. As part of a broader EUR/USD trend analysis, GBPUSD shows how political divergence and inflation fears impact currency flows. We are now actively looking for sell opportunities.
AUDUSD
The Australian Dollar is consolidating, showing relative resilience compared to the Pound. In light of global risk-off sentiment, this move is surprising. We wait for a break of structure before applying strategic forex trade planning to AUD setups.
NZDUSD
The Kiwi is pressing against the lower edge of its range. A sustained move below this level could lead to new selling opportunities. Traders using multi-pair forex strategies should closely track NZD correlation with commodity trends and overall market sentiment.
EURUSD
EUR/USD is under pressure but still structurally bullish. Currently, the pair is retesting the upper band of its previous consolidation zone. RSI and MACD show bearish volume and momentum, while EMA200 acts as resistance. We’re on watch for a bullish breakout or further confirmation of a trend shift. Price action trading for EUR/USD remains central to current forex positioning strategies.
USDJPY
USDJPY shows signs of bullish continuation but remains in consolidation. Despite risk-off flows, JPY isn’t gaining as expected, possibly due to domestic policy hesitations. We'll stay on hold until structure gives way in either direction—essential for high-confidence forex analysis and predictions.
USDCHF
USDCHF has re-entered consolidation and broken the EMA200. Although MACD and RSI show bullish signals, we remain cautious. Strategic forex trade planning suggests waiting for structure confirmation before shifting our bias from bearish to bullish.
USDCAD
USDCAD shows strong bullish momentum after bouncing off the EMA200. RSI and MACD confirm follow-through to the 1.37261 level. With no immediate rejection, we maintain a bullish bias. However, as with all multi-pair forex strategies, we remain alert for rapid shifts tied to oil and Fed sentiment.
Final Thoughts
This week's volatility underscores the importance of strategic forex trade planning. With inflation outlooks, geopolitical escalation, and central bank divergence shaping currency flows, a methodical approach to multi-pair forex strategies and EUR/USD trend analysis is essential. Stick to the technicals, follow the price action trading for EUR/USD, and remain responsive to macro news for optimal trade execution.
0 notes
Text
XRP Shows Buy Signal Amidst 6% Recovery Rally 🚀
Gather 'round, crypto lovers and investors! 🤑✨ It seems our friend $XRP has decided to don its party hat and join the market rally with a nifty 6% price increase. Seriously, analysts are buzzing like bees in a flower garden, spotting those technical indicators that scream “BUY ME!” aloud! [Read original article on theccpress.com]
Key Points:
XRP's price increase highlighted by technical indicators.
Analysts observe buy signals forecasting future growth.
Market reactions remain cautiously optimistic.

XRP Shows Buy Signals After 6% Price Increase
What’s the scoop? Well, as of June 3, 2025, the XRP price recovery is showing a cozy footing at the $2.08–$2.12 level (who doesn't love a strong support?) with analysts eyeing a path toward $2.50 and beyond! Just throw in some technical indicators like a green MACD histogram and an RSI soaring past 50, and you’ve got yourself a bullish buffet! 🍽️
But don’t pop the champagne just yet! 🥂 While we’re getting the party vibes, the market remains cautiously optimistic. Analysts like Joy from TradingView quipped, “The indicators are showing early signs of a reversal...” but fair warning, there's a risk of retesting lower levels if the momentum falters. Still, a poker face can do wonders in this game! 😏
As the hype continues, are you ready to ride the $XRP wave? 🌊 Let’s chat in the comments! And don’t forget to bookmark the deep dives for when you wanna ogle the charts in bed (we won’t judge). 🌙💤 [Full analysis here]
Disclaimer: The content on The CCPress is provided for informational purposes only and should not be considered financial or investment advice. Cryptocurrency investments carry inherent risks. Please consult a qualified financial advisor before making any investment decisions.
#CryptoNews #XRP #Investing #CryptoCommunity #BullMarket #XRPBuySignal #CryptoInvestment 💰📈
0 notes
Text
XRP Path to $27 Revealed, But it Will Touch These Targets First
XRP could be headed for a significant surge, according to seasoned crypto market analyst EGRAG Crypto. His analysis points to a familiar bullish pattern emerging after the digital asset recently retested the 21-week Exponential Moving Average (EMA), a key technical indicator that has historically preceded major rallies. Despite broader market sluggishness, XRP has held steady around the $2.19…
0 notes
Text
Get ISO 17025 certified in Oman and improve your laboratory’s testing and calibration accuracy

In a world driven by precision and reliability, laboratories play a critical role in ensuring the quality and safety of products and services across industries. For laboratories in Oman—whether involved in environmental testing, food safety, pharmaceuticals, construction, or oil and gas—achieving ISO/IEC 17025 certification is a strategic step toward enhancing technical competence and global recognition. This internationally accepted standard for testing and calibration laboratories helps ensure the accuracy, consistency, and credibility of results, ultimately boosting trust and operational efficiency.
What is ISO 17025?
ISO 17025 Certification in Oman is the global standard that outlines the general requirements for the competence of testing and calibration laboratories. It covers both the technical and management aspects of laboratory operations, including personnel qualifications, testing methodologies, equipment calibration, data accuracy, and quality assurance systems.
For laboratories in Oman, obtaining ISO 17025 certification demonstrates their ability to produce valid and reliable results, essential for regulatory compliance, customer confidence, and international trade.
Enhancing Accuracy and Reliability in Testing
One of the key benefits of ISO 17025 certification is improved accuracy in testing and calibration. The standard ensures that laboratories apply scientifically sound methods, maintain proper calibration of instruments, and use validated testing procedures. These practices lead to consistent and reproducible outcomes—crucial for sectors like environmental monitoring, construction material testing, and chemical analysis.
Whether it’s a food testing lab in Muscat or an oilfield service lab in Sohar, ISO 17025 helps eliminate errors, reduce retesting, and improve the credibility of the lab’s output.
Boosting International Recognition and Business Opportunities
ISO 17025 is recognized worldwide and often a prerequisite for participating in international supply chains or securing government contracts. Laboratories in Oman that are certified to this standard enjoy increased credibility and can easily collaborate with clients, regulators, and partners across borders.
Accredited labs can issue test reports and calibration certificates that are accepted globally, thanks to the mutual recognition agreements (MRAs) under ILAC (International Laboratory Accreditation Cooperation). This opens up new business avenues for labs looking to serve international customers or support exporters.
Supporting Regulatory Compliance and National Standards
In Oman, regulatory bodies and industry clients often require lab testing to be performed by ISO 17025-accredited facilities. This ensures that testing and calibration results are accurate and compliant with national or international regulations.
For example, food safety agencies, construction authorities, and oil and gas companies may require certified labs to perform material testing, water analysis, or calibration of measuring instruments. ISO 17025 Consultants in Oman positions a laboratory as a trusted and approved provider, capable of meeting these demands with confidence.
Improving Laboratory Efficiency and Risk Management
ISO 17025 encourages structured workflows, effective documentation, and continual improvement through internal audits and corrective actions. Laboratories benefit from streamlined processes, reduced waste, and quicker turnaround times—without compromising accuracy.
The risk-based thinking approach in ISO 17025 also helps labs in Oman identify potential issues before they impact test results or client satisfaction. This leads to fewer complaints, better customer service, and stronger operational resilience.
Building Trust with Clients and Stakeholders
For laboratories, trust is built on precision and transparency. ISO 17025 Consultants Services in Oman assures clients that the lab adheres to international best practices, employs qualified personnel, and maintains properly calibrated equipment.
This credibility can significantly enhance client relationships, lead to repeat business, and elevate the lab’s reputation in both the private and public sectors. It also gives stakeholders confidence that the results generated are not only technically sound but also legally defensible.
Conclusion
Achieving ISO/IEC 17025 certification is a game-changer for laboratories in Oman. It signifies a commitment to quality, accuracy, and continuous improvement—values that are essential in today’s precision-driven industries. Whether your lab supports environmental testing, product certification, or industrial calibration, ISO 17025 positions you for local excellence and global relevance. By investing in this certification, Omani laboratories can increase their credibility, expand their market reach, and play a vital role in advancing quality and safety across the nation.
0 notes
Text
How Kalkine and Kalkine Canada Analyze Affordable Equities Through Charts
In the dynamic landscape of financial markets, low-priced equities often emerge as focal points due to their accessibility and perceived potential for movement. A recent report by Kalkine Canada sheds light on such stocks trading under a specific threshold, using technical analysis as a primary lens. While headlines often spotlight large-cap giants, segments of the market comprising smaller and lower-priced equities reveal complex technical patterns and trading behavior worth evaluating.
Unpacking Technical Parameters in the Kalkine Canada Report
The comprehensive analysis curated by Kalkine Canada delves into multiple metrics commonly used in market behavior studies. Moving averages, Relative Strength Index (RSI), MACD, and volume oscillators are some of the tools leveraged to observe patterns in price fluctuations. These insights are not presented as predictions but serve to highlight market signals that could indicate trend shifts, consolidations, or volatility.
This report emphasizes the significance of technical cues in price discovery. The equities selected do not merely meet a price filter—they are subject to chart-based evaluations that capture their relative positioning, momentum, and market reaction in recent sessions. The use of consistent charting frameworks aligns with Kalkine's objective to deliver structured equity breakdowns.
Sectoral Diversity in Low-Priced Stocks
One of the key takeaways from the analysis is the wide sectoral distribution of these equities. From technology and energy to healthcare and mining, these companies span various domains, reflecting the breadth of opportunities within the Canadian capital market. Each stock highlighted has demonstrated technical movements that triggered thresholds such as trendline breaks, RSI reversals, or MACD crossovers—factors that form the core rationale behind their inclusion.
Kalkine Canada takes a neutral and analytical approach in identifying such stocks, focusing on how these technical traits evolve rather than projecting future outcomes. This neutrality ensures that the emphasis remains on current data trends and interpretations without directional assumptions.
The Appeal of Technical Analysis for Low-Priced Equities
Technical analysis holds particular importance when analyzing low-priced equities. In segments of the market where fundamentals might be evolving or less transparent, chart-based indicators often provide a visual summary of crowd psychology. The Kalkine Canada report showcases stocks with breakout patterns, trend momentum, and resistance-testing behavior—key themes that continue to gain attention in technical circles.
The report also highlights liquidity metrics and trading volume consistency. Stocks that maintain trading activity across multiple sessions, particularly in ranges considered low-volume, are given prominence. This focus ensures the assessment is grounded in actionable data rather than speculation.
Institutional and Retail Perspectives
The Kalkine platform underscores how both retail and institutional entities often look to technical charts when scanning under-the-radar equities. These entities may not necessarily engage directly, but the presence of technical signals such as consolidation zones or bullish divergences can influence sentiment and market positioning.
By contextualizing price actions within broader volume and trend dynamics, Kalkine Canada bridges a gap between raw chart data and synthesized insight. The findings cater to readers who rely on structure and discipline in their market reviews, rather than reacting to price alone.
Notable Technical Patterns Highlighted
Some of the equities mentioned in the report demonstrate chart setups such as ascending triangles, double bottoms, and support-retesting formations. These patterns often indicate consolidation phases or early signs of directional moves. The inclusion of these stocks is not driven by narratives but by quantifiable signals, ensuring alignment with objective criteria.
The use of Bollinger Bands and Fibonacci retracements in the analysis further enriches the depth of the report. These tools help to contextualize price movement within statistically meaningful boundaries, adding another layer to the comprehensive technical outlook that Kalkine Canada presents.
Key Takeaways From the Technical Assessment
The broader takeaway from the Kalkine Canada report is the growing role of structured technical reviews in identifying stock patterns—particularly in the lower price range segment. Rather than relying on speculation, the report adopts a multi-metric lens rooted in discipline and chart reading consistency.
Kalkine continues to emphasize a data-driven methodology that prioritizes clarity and neutrality. This structured, pattern-based approach appeals to readers who value insights derived from observable market behavior, ensuring relevance across diverse levels of market familiarity.
0 notes
Text
Top Strategies for Successfully Trading Breakouts and Pullbacks
Trading breakouts and pullbacks are two of the most powerful strategies in technical analysis. When executed correctly, they can offer high-probability setups and consistent returns. At AtlasFunded, we help traders sharpen their edge by understanding market structure, timing, and risk management. In this guide, we’ll break down the top strategies for successfully trading breakouts and pullbacks.

What Are Breakouts and Pullbacks?
A breakout occurs when the price moves beyond a defined support or resistance level with increased volume. This often signals the start of a new trend. A pullback, on the other hand, is a temporary reversal within an existing trend—a chance for traders to enter at a better price before the trend resumes.
Both strategies are used by day traders, swing traders, and even long-term investors.
Strategy 1: Identify Key Support and Resistance Levels
The foundation of breakout and pullback trading lies in accurately identifying support and resistance zones. These levels are where price has historically reversed or paused, making them critical decision points.
Tip: Use tools like horizontal lines, Fibonacci retracements, and pivot points to mark these areas. Volume analysis can also confirm the strength of a breakout.
Strategy 2: Use Volume to Confirm Breakouts
Volume plays a crucial role in confirming the validity of a breakout. A breakout with high volume indicates strong market interest and a higher chance of follow-through.
AtlasFunded Insight: Low-volume breakouts are more likely to fail or reverse, trapping traders in poor entries. Always wait for volume confirmation before jumping in.
Strategy 3: Wait for the Retest (Breakout-Pullback Combo)
One of the most effective breakout trading methods is to wait for the retest. After the initial breakout, price often returns to test the previous resistance (now support) or support (now resistance) before continuing.
This gives traders a chance to enter with a lower risk and higher reward setup.
Strategy 4: Trendline and Moving Average Pullbacks
When trading pullbacks, using a trendline or moving average (like the 20 EMA) helps identify dynamic support or resistance. These indicators can act as reliable zones for pullback entries during a trend.
Tip: Enter on a bullish or bearish candlestick pattern near the trendline or moving average for added confirmation.
Strategy 5: Set Clear Entry, Stop, and Target Levels
Whether trading a breakout or pullback, never skip proper risk management. Define:
Entry: Above the breakout point or at the pullback support/resistance
Stop-loss: Below the breakout level or under recent swing low/high
Take-profit: Based on risk/reward ratio (e.g., 1:2 or 1:3)
At AtlasFunded, we emphasize disciplined trade planning to help traders scale with confidence.
Conclusion
Trading breakouts and pullbacks can be incredibly rewarding, but success comes from preparation, not prediction. Focus on structure, confirmation, and discipline.
Join AtlasFunded and gain access to educational resources, funding opportunities, and a community that empowers you to trade smarter, not harder.
0 notes
Text
Bitcoin’s $100K Dream Hangs by a Thread — And Most Investors Are Getting It Wrong

Bitcoin is standing at the edge of a knife. This isn’t just another "healthy pullback." It’s a full-blown battle for Bitcoin’s next identity — and most traders are sleepwalking into it.
At $94,000, Bitcoin isn’t deciding whether to go up or down. It’s deciding whether it still has the power to lead global risk appetite into a new cycle — or whether it will spend the next six months trapped in a brutal sideways purgatory.
Right now, everything hangs on what happens between $94,000 and $99,000. Lose here, and we could see $83,000 faster than most are ready for. Win here, and Bitcoin will be knocking on $125,000’s door sooner than Wall Street expects.
But most retail investors are looking at the wrong signals.
The Great Supply Wall: 1.76 Million BTC Says "Prove It"
You can’t talk about Bitcoin’s future right now without confronting the 1.76 million BTC elephant in the room.
According to IntoTheBlock data, roughly 2.6 million wallets have accumulated Bitcoin in the $94,125–$99,150 range. That’s a gigantic cluster of potentially nervous holders who are near break-even — and itching to sell if price action weakens.
This isn’t a casual ceiling. This is one of the densest sell walls Bitcoin has faced in this entire cycle.
In plain English: The market must show overwhelming strength to bulldoze through $99K — or risk a bloody rejection.
If Bitcoin fails here, expect a sharp flush to $89,000, maybe even $84,000. That’s not doom-mongering — it’s basic liquidity math. There are 678,000 BTC waiting at $93,000 and another 759,150 BTC around $84,000, ready to catch the fall.
History is clear: When Bitcoin meets thick resistance and fails, it doesn’t just dip — it dives.
The Bull Case Isn't Dead — But It's on Life Support
Despite this looming threat, some technical structures still favor the bulls — if they act fast.
The big beacon of hope is the Inverse Head & Shoulders pattern spotted by Titan of Crypto. On the monthly timeframe, Bitcoin has already broken out above the neckline and successfully retested it.
In technical analysis terms, that’s a textbook setup for a massive rally. Measured moves from an H&S breakout put Bitcoin’s next fair target somewhere between $125,000 and $130,000 — a full 30% rally from current levels.
And here’s the thing: Monthly structures don’t fake out easily. Short-term volatility is noise; long-term patterns are destiny.
But — and it’s a big but — even the most beautiful pattern dies if momentum completely collapses at key resistance.
Bitcoin needs to close above $96,600 in the next 1–2 weeks to invalidate this local selling pressure. Fail that, and this dream starts slipping away.
The Dangerous Illusion of Leverage Pumps
One of the biggest risks to Bitcoin right now isn’t fundamentals. It’s overheated leverage.
Data from Maartunn highlights that Bitcoin’s latest rallies have been leverage-driven Easter pumps, adding over $2 billion in open interest within 24 hours.
Leverage-based gains are fake strength. They make charts look explosive, but underneath, the moves are hollow — easy prey for liquidation cascades.
We've seen this movie before:
March 2020 — leverage wiped out 50% of Bitcoin’s price in days.
May 2021 — over-leveraged longs got liquidated into a brutal summer bear market.
If Bitcoin cannot sustain organic spot buying to support these levels, the downside risk isn’t a 5% dip — it’s a violent 10–20% correction.
The illusion of strength is far more dangerous than obvious weakness.
The $83K Scenario: A Brutal, Necessary Cleansing
If Bitcoin fails to reclaim momentum here, I’m betting on a swift correction toward $83,000–$85,000.
Why that zone? Because that’s where real organic demand still exists — where conviction buyers, not speculators, are waiting.
Swissblock’s analysts agree:
$89,000–$90,000 is minor support (first landing pad)
$83,000–$85,000 is the real floor (where serious bids are stacked)
Think of it this way: A drop to $83K isn’t Bitcoin dying. It’s Bitcoin shedding dead weight before launching higher.
In fact, historically, Bitcoin’s strongest rallies often follow sharp, painful flushes. Clear out weak hands → reset leverage → real buyers step in → next leg higher.
It’s brutal, but it’s healthy.
The Macro Tailwind Few Are Talking About
While short-term technicals are messy, the macro backdrop quietly favors Bitcoin’s long-term strength.
Paul Atkins, the newly appointed SEC Chairman, is pro-crypto and already hinting at broader ETF approvals.
The U.S. dollar continues to show relative weakness, supporting Bitcoin’s narrative as a "digital safe haven."
Spot Bitcoin ETFs are raking in billions, cementing Bitcoin’s place in institutional portfolios.
When you zoom out, this is no longer the 2017 retail casino. This is Bitcoin’s first cycle as a mainstream macro asset.
Corrections are not only survivable — they’re investment opportunities for the brave.
Short-Term Pain, Long-Term Glory
Here’s where I’m planting my flag:
Bitcoin likely faces one more sharp correction toward $83,000–$85,000 in the next 30 days.
This will be painful, ugly, and drive fear headlines.
Smart money will be loading the dip, not panic selling.
By late 2025, Bitcoin will not only reclaim $100,000 — it will sprint past it toward $125,000 and beyond.
If you’re scared now, you’re looking too close. Zoom out. The future is already written — you just have to survive the turbulence.
Buckle Up
Bitcoin isn’t dying. It’s battling for its next chapter.
The $94,000–$99,000 zone is no joke. Fail here, and the next few weeks will be rough — but ultimately necessary.
If you can’t handle the volatility, Bitcoin has a simple message for you: This asset was never for the faint of heart.
And if you can? You’re about to witness history.
🔥 Like what you're reading? We don't lock our content behind paywalls — everything we publish is free for the community. If you find value in our work and want to support independent crypto journalism, consider buying us a coffee ☕ on Ko-Fi! Every donation, big or small, helps us keep creating bold, data-driven content. 👉https://ko-fi.com/thedailydecrypt
© 2025 InSequel Digital. ALL RIGHTS RESERVED. This article may not be reproduced, distributed, or transmitted in any form without prior written permission.
0 notes
Text
Markets on Edge: Gold, Crude, and Dollar Await Fed’s Inflation Signal
With the Fed’s preferred inflation gauge, the Core PCE Price Index, due this Friday, traders are eyeing the US Dollar, Gold, and Crude Oil for directional clues.
This week’s calendar is relatively light outside of Friday’s inflation data, meaning markets may remain sensitive to positioning, risk sentiment, and technical levels ahead of the main event. The report could reshape interest rate expectations for the rest of 2025. Stronger-than-expected data would likely reinforce the recent hawkish Fed narrative, while a downside surprise could revive hopes for rate cuts by summer.
In this week’s analysis, we focus on Gold (XAU/USD) and Crude Oil (WTI), which all showed signs of volatility last week. Each market presents its own narrative, from flight to safety and interest rate sensitivity to geopolitical risk and supply-side stories. All times mentioned in this report are in BST.
Gold (XAU/USD) Analysis
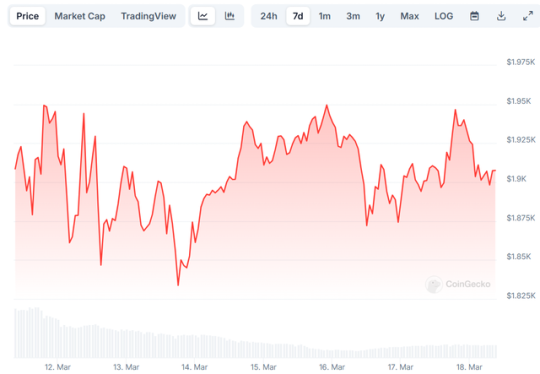
Gold (XAU/USD) has faced significant selling pressure in the past week, falling sharply from a high of around $3,491 down to lows near $3,241 by April 23rd.
This steep correction of about 7.7% highlights heightened volatility in precious metals markets, driven by shifting expectations around US monetary policy and broader risk sentiment. The sharp decline from $3,491 to $3,241 was followed by a brief technical rebound, with gold prices recovering up to $3,365.
However, buyers struggled to maintain momentum above the $3,380 level, and the market has since slipped back toward the $3,285–$3,300 zone, where some interim support is emerging.

XAUUSD H1
The hourly chart highlights a clean two-leg corrective structure:
· First, a steep selloff from the highs.
· Then a corrective bounce into resistance zones around $3,365–$3,387.
Currently, gold is trading between $3,285 and $3,315, suggesting a consolidation phase after the heavy moves earlier in the week. A break back above $3,337 could open the door for a retest of the $3,380 region, while a decisive break below $3,285 could lead to fresh selling pressure towards the $3,260–$3,241 area.
Technically, gold is still positioned below its short-term moving averages on the H1 timeframe, signalling a slight bearish bias for now. Volume activity also shows increased participation during downswings compared to upswings, which further underlines a cautious market tone.
The correction in gold coincides with rising US bond yields and a stronger dollar, as traders push back expectations for imminent Fed rate cuts. This makes non-yielding assets like gold less attractive in the short term. However, broader macro themes, including geopolitical tensions, persistent inflation worries, and robust central bank demand, continue to support gold's long-term outlook. Markets are awaiting this week's US Core PCE release, the Fed’s preferred inflation gauge, which could inject fresh volatility into gold markets.
A softer-than-expected reading could reignite bullish momentum, while a stronger print may weigh further on prices. Overall, after an impressive run from March into April, gold is currently undergoing a healthy correction phase. Whether this develops into a deeper retracement, or a renewed uptrend will likely depend on this week's macroeconomic data and the next moves in bond yields.
WTI Crude Oil (USOIL) Analysis
WTI Crude Oil faced strong volatility this past week, with prices plunging from highs around $64.32 down to $62.13, a sharp decline of over 3.5% in less than 24 hours. The sell-off was driven by a combination of factors, including rising US inventory data, fading Middle East geopolitical premiums, and broader risk-off sentiment across commodities.
Following the heavy selling, oil managed to stabilize, rebounding back toward the $63.24 zone. However, momentum remains somewhat subdued, with price action forming a broad consolidation range between $62.13 and $63.24 in recent sessions.
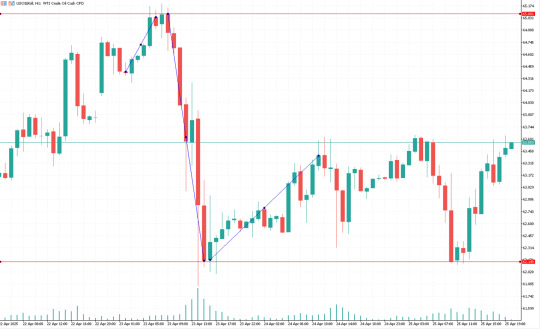
USOIL H1
On the hourly chart, oil's breakdown from $64.32 to $62.13 was abrupt, with very little support found during the move lower. The recovery since then has been gradual, marked by choppy, corrective price action rather than strong bullish continuation.
Current price action shows that sellers are defending the $63.20–$63.30 resistance zone, while buyers have been active near the $62.10–$62.20 support area. A break above $63.30 could trigger a short squeeze toward $63.80–$64.00, whereas a breakdown below $62.10 would expose the market to deeper losses toward the $61.50 level.
Fundamentally, oil markets remain in a tug of war between demand-side concerns and supply-side risks. On the one hand, signs of slowing economic growth in major economies (including China and the US) are weighing on demand forecasts.
On the other hand, OPEC+ supply management and potential disruptions in key regions provide an underlying floor for prices. This week’s key focus will be on US Crude Oil Inventories (Wednesday) and the broader risk appetite in markets. If inventories show another build, it could pressure oil lower, while a surprise drawdown could provide a catalyst for a short-term rally. While oil has shown resilience after the initial sell-off, it remains vulnerable to sharp moves based on data surprises or geopolitical developments.
Key Levels to Watch
Gold (XAU/USD):
· Resistance at $3,337–$3,380
· Support at $3,285, with deeper downside potential toward $3,260–$3,241 if broken
· Watch for a breakout from the current $3,285–$3,315 range to confirm next directional move
WTI Crude Oil (USOIL):
· Resistance near $63.20–$63.30, with upside extension toward $63.80–$64.00 if broken
· Support at $62.10–$62.20, a breakdown here risks a move toward $61.50
· Current range between $62.13–$63.24 remains key until broken
Forward Considerations
Looking ahead, the Core PCE Price Index release this Friday is set to dominate market sentiment, particularly for gold and the US dollar. As the Fed’s preferred inflation gauge, any deviation from expectations could significantly sway interest rate projections.
A softer-than-expected print may revive rate-cut bets, triggering renewed demand for gold and potentially pushing prices back toward the $3,365–$3,380 resistance zone. Conversely, a stronger print would likely reinforce the Fed’s hawkish stance, weighing further on non-yielding assets like gold and possibly opening the door to deeper retracements into the $3,260–$3,241 area.
Bond yields will remain key intraday drivers, particularly if Friday's data causes shifts in rate expectations. Traders should watch for increased volatility as positioning adjusts in real time to macro headlines. For oil markets, US Crude Inventory data on Wednesday will be an important short-term catalyst.
If we see another unexpected build, it could reignite downside pressure and push prices through key support levels. On the flip side, a sharp drawdown or a surprise drop in inventories might offer bulls a window to challenge the $63.80–$64.00 resistance.
Broader risk sentiment across commodities and equities will also shape intraday trends, especially as traders digest mixed global growth signals. Crude remains vulnerable unless buyers can regain control above $63.30 and sustain momentum. Still, any sudden geopolitical escalation, particularly in oil-sensitive regions, could quickly flip the narrative and lead to rapid upside price spikes.
0 notes
Text
7 Forex Market Setups: EUR/USD Trends & Trade Strategies

Market Analysis
GOLD
Gold prices remain consolidated, currently positioned near the EMA200 and the lower boundary of a key consolidation zone. Both MACD and RSI indicators support this consolidation phase. We're waiting for a decisive move to signal the next trend direction. Among the 7 Forex Market Setups this week, gold stands out as a prime example of how geopolitical risk—such as President Trump’s recent tariff threats—can create safe-haven demand. As the market reacts, this setup demands careful monitoring for breakout opportunities. For deeper insights into gold and forex strategies, visit RichSmart FX.
SILVER
Silver continues to show signs of consolidation. Until a definitive breakout or breakdown occurs, we maintain a neutral stance. As part of the 7 Forex Market Setups worth tracking, silver's technical structure reflects hesitation amid broader market uncertainty. This setup is important for traders waiting to catch a momentum shift. See additional silver trade resources from RichSmart.net.
DXY
The U.S. Dollar Index (DXY) is trading sideways, hinting at a potential bearish continuation. Momentum indicators like MACD and RSI suggest further selling pressure may emerge. Within the 7 Forex Market Setups featured this week, the DXY’s indecisiveness mirrors broader uncertainty in USD performance. Its movement is critical in shaping direction across multiple forex pairs. For DXY and USD correlation analysis, explore Axel Private Market.
GBPUSD
GBP/USD finds support at the EMA200, with RSI indicating bullish momentum nearing overbought territory. A minor pullback is possible near the 1.34998 resistance zone. However, MACD suggests sustained bullish momentum. As one of the 7 Forex Market Setups, GBP/USD presents an opportunity aligned with positive sentiment for the Pound. It’s a key chart to watch for continuation or potential reversal signs. Learn more from GFS Markets.
AUDUSD
AUD/USD is bouncing off the 0.64086 support level with growing bullish volume. Momentum indicators are aligned with further upward movement. Included in this week's 7 Forex Market Setups, the Australian Dollar offers a clear trend structure for strategic forex trade planning. Follow up with analysis at DBGMFX.
NZDUSD
NZD/USD shows a strong bullish rejection from recent support levels. MACD confirms increased buying pressure, although the RSI is nearing overbought levels. Among the 7 Forex Market Setups, NZD/USD stands out with its momentum-rich environment, presenting a solid candidate for tactical price action trading. Get NZD insights at TopMax Global.
EURUSD
EUR/USD remains trapped in a consolidation zone, retesting its upper boundary. While MACD hints at bullish momentum, the RSI’s approach toward overbought conditions urges caution. This pair is central to the 7 Forex Market Setups due to its high relevance and potential for breakout. EUR/USD trend analysis remains essential here. For expert perspectives, check WorldQuest FX.
USDJPY
USD/JPY has failed multiple attempts to break above the EMA200, suggesting bearish potential. Despite this, long-term trend structure still supports bullish continuation. As part of the 7 Forex Market Setups, USD/JPY highlights a dual narrative—short-term bearish signals versus longer-term bullish structure.
USDCHF
USD/CHF has weakened following a recent retreat from highs. Prices are consolidating under resistance, with bearish signals from MACD and RSI. Included in the 7 Forex Market Setups, USD/CHF shows potential for further decline, pending confirmation through key support levels.
USDCAD
USD/CAD continues to slide as CAD strengthens, driven by a strong Q1 2025 GDP report (2.2% annualized) and reduced likelihood of an immediate rate cut by the BoC. This pair rounds out the 7 Forex Market Setups, offering a bearish bias that aligns with current macroeconomic fundamentals favoring the Canadian dollar.
COT Market Analysis
AUD - WEAK (5/5)
GBP - STRONG (5/5)
CAD - WEAK (5/5)
EUR - STRONG (3/5)
JPY - STRONG (3/5)
CHF - WEAK (4/5)
USD - MIXED
NZD - WEAK (4/5)
GOLD - STRONG (3/5)
SILVER - STRONG (5/5)
Final Thoughts
This week’s 7 Forex Market Setups showcase a range of opportunities across metals and major currency pairs. Strategic forex trade planning and consistent application of price action trading remain critical, especially with EUR/USD and related setups in consolidation or reversal zones. As geopolitical and economic developments evolve, being selective and disciplined in execution will help traders capitalize on the most favorable market conditions.
0 notes
Text
Why Choosing High-Purity Acetonitrile Matters for Your Lab Work
In the world of analytical chemistry, every detail counts. Whether you’re running complex HPLC analyses or preparing samples for sensitive research, the quality of your chemicals can directly impact your results. One chemical that plays a crucial role across countless laboratories is acetonitrile — a simple yet powerful solvent.
But what happens if your acetonitrile isn’t pure enough? How does it affect your data, and what should you be looking for when sourcing the best acetonitrile chemical for your needs? Let’s dive into the real pain points many professionals face and how choosing the right acetonitrile HPLC grade can save you from costly mistakes.
Why Purity in Acetonitrile Is Non-Negotiable
Acetonitrile (C2H3N) is a colorless, volatile liquid often used as a solvent in high-performance liquid chromatography (HPLC). It’s preferred because of its low UV absorbance, high elution strength, and excellent miscibility with water. However, not all acetonitrile is created equal.
Using low-purity acetonitrile chemical can lead to:
Poor Peak Resolution: Impurities can cause baseline noise and ghost peaks, making it harder to interpret your chromatograms.
Equipment Damage: Contaminants can build up in your HPLC system, leading to expensive maintenance or even permanent damage.
Inconsistent Results: For pharmaceutical and clinical labs, inconsistency can mean failed batches, regulatory issues, and loss of trust.
Wasted Time and Resources: Retesting samples due to solvent interference wastes both time and materials, delaying important projects.
These problems aren’t just frustrating — they can severely impact your lab’s reputation and operational costs.
What Makes Acetonitrile HPLC Grade Different?
When you see "acetonitrile HPLC grade" on a label, it’s a sign that the chemical meets stringent purity standards specifically suited for chromatographic analysis. Here's what you typically get:
Extremely Low UV Absorbance: Reduces background noise and improves detection sensitivity.
Minimal Particulate Matter: Prevents clogging and wear in your HPLC columns and system.
Strict Quality Control: Each batch is tested to ensure it meets the specifications needed for high-precision work.
Choosing an HPLC-grade acetonitrile chemical is about more than just purity; it’s about ensuring reliability, consistency, and peace of mind in every run.
How C2H3N Fits Into the Bigger Picture
For those who like the chemistry side of things, C2H3N is the molecular formula for acetonitrile. Understanding its structure helps explain why it’s such a versatile solvent. Its simple molecular composition — two carbon atoms, three hydrogen atoms, and one nitrogen atom — allows it to dissolve a wide range of polar and non-polar compounds.
This versatility makes acetonitrile C2H3N essential not only for HPLC but also for:
DNA and protein sequencing
Organic synthesis
Battery production (especially lithium-ion batteries)
Pesticide and herbicide residue analysis
However, different applications require different grades of acetonitrile chemical. For instance, while industrial-grade acetonitrile might be acceptable for synthesis, it would be disastrous for sensitive HPLC applications.
How to Choose the Right Acetonitrile Chemical Supplier
Given how critical the right grade of acetonitrile HPLC is, picking the right supplier becomes just as important as the chemical itself. Here’s what to look for:
Purity Certification: Ensure the supplier provides Certificates of Analysis (COA) that confirm purity levels and testing methods.
Batch Consistency: Variations between batches can introduce new problems. Reliable suppliers maintain strict production standards.
Proper Packaging: Acetonitrile is volatile. Suppliers should use packaging that prevents contamination and degradation.
Technical Support: Whether it’s troubleshooting ghost peaks or selecting the right solvent mixture, having access to expert advice can make a world of difference.
Investing a little time in choosing the right source can protect you from bigger issues down the road.
Final Thoughts
When it comes to laboratory success, the little things matter — and choosing the right acetonitrile chemical is no exception. Don’t let poor solvent quality compromise your hard work. Opt for acetonitrile HPLC grade products to ensure your experiments, analyses, and operations run smoothly and deliver the reliable results you need.
If you’re looking for high-purity C2H3N that you can trust for your sensitive applications, Lab Chemicals is your go-to source. With strict quality control, competitive pricing, and excellent customer support, Lab Chemicals ensures you get the best acetonitrile chemical for every critical project.
0 notes
Text
Ethereum (ETH) Price Prediction & Analysis: The Calm Before the Storm?
TLDR Ethereum has struggled below the $2,000 level since March 11, 2025 Technical indicators like CMF and Bulls/Bears metrics suggest rising buying pressure Historical patterns from 2017 and 2020 show similar setups before major rallies ETH is currently retesting a 5-year support trendline that has triggered past recoveries Upcoming catalysts like the Pectra upgrade could fuel a potential…
View On WordPress
0 notes
Text
Bitcoin's Price Dynamics in USD: An In-Depth Analysis

As of March 27, 2025, the btc price usd (BTC) stands at approximately $87,486 USD. This valuation reflects a slight decrease of about 0.89% over the past 24 hours. Bitcoin's market capitalization is currently around $1.74 trillion USD, with a 24-hour trading volume of approximately $28.61 billion USD.
Recent Price Movements
In recent months, Bitcoin has experienced notable price fluctuations. After reaching an all-time high of $109,225 USD on January 20, 2025, the cryptocurrency has seen a decline of over 20%, stabilizing around the current price point. This downward trend has been influenced by various factors, including geopolitical events and economic policies.
Influence of Economic Policies
One significant factor impacting Bitcoin's price is the recent imposition of 25% tariffs on automotive imports into the U.S. by President Donald Trump's administration. These tariffs have raised concerns about potential inflation and slowed economic growth, prompting investors to move away from riskier assets like cryptocurrencies toward safer havens such as bonds and gold.
Market Analysis and Technical Indicators
Technical analysis indicates that Bitcoin has recently broken out of a three-month descending channel, signaling a potential shift in market structure. However, despite this breakout, the cryptocurrency continues to exhibit high volatility, and its correlation with traditional financial markets remains strong. For instance, the correlation between Bitcoin and the S&P 500 has been above 0.8 for two weeks, suggesting that both could continue to move in tandem.
Comparative Performance with Gold
In contrast to Bitcoin's recent struggles, gold has surged over 15%, hitting an all-time high of $3,050 an ounce. This increase is attributed to economic uncertainty and geopolitical tensions, which have enhanced gold's appeal as a safe-haven asset. Bitcoin, often referred to as "digital gold," has not mirrored this trend, highlighting the challenges it faces in establishing itself as a reliable store of value during turbulent times.
Future Outlook
Looking ahead, market analysts have mixed opinions on Bitcoin's trajectory. Some suggest that if Bitcoin finds support around its 200-day Exponential Moving Average (EMA) at $85,519 USD, it could extend the recovery to retest the key psychological level of $90,000 USD. However, others caution that despite short-term momentum improvements, intermediate-term indicators remain bearish, increasing the risk of a fleeting rebound.
Conclusion
Bitcoin's price in USD continues to be influenced by a complex interplay of market dynamics, economic policies, and investor sentiment. While technical indicators provide insights into potential trends, the inherent volatility of the cryptocurrency market necessitates cautious and informed investment decisions. As always, investors should stay abreast of ongoing developments and consider multiple factors when evaluating the future performance of Bitcoin.
0 notes
Text
Mobile App Usability Testing: A Step-by-Step Guide

In today’s digital landscape, mobile applications serve as essential tools for businesses and individuals alike. However, even the most well-designed apps can fail if they are not user-friendly. Usability testing ensures that an app provides a seamless experience, identifying potential issues before they reach end users. In this guide, we will walk you through the key steps of mobile app usability testing to help you create an engaging and efficient user experience.
Step 1: Define Your Testing Objectives
Before diving into usability testing, it’s essential to set clear goals. Ask yourself the following questions:
What aspects of the app are you testing (navigation, responsiveness, design, etc.)?
Who is your target audience?
What are the key user actions you want to analyze?
Defining these objectives will provide direction for the entire testing process and ensure that you gather meaningful insights.
Step 2: Identify Your Target Users
Selecting the right participants is crucial for usability testing. Ideally, your testers should represent your app’s real users. Consider factors such as:
Age, gender, and demographics
Technical expertise
Behavior patterns
Recruiting the right mix of users will help you obtain diverse perspectives and uncover potential usability issues.
Step 3: Choose the Right Usability Testing Method
There are several usability testing methods to consider:
Moderated Testing: Conducted in real-time with a facilitator guiding participants through tasks.
Unmoderated Testing: Participants complete tasks independently, providing feedback through surveys or recordings.
Remote Testing: Conducted online without requiring participants to be physically present.
A/B Testing: Compares two different versions of an app to determine which performs better.
Each method has its advantages, and the right choice depends on your objectives and resources.
Step 4: Design Test Scenarios and Tasks
To get valuable feedback, create realistic test scenarios that align with common user activities. For example:
“Find and purchase an item within three minutes.”
“Navigate to the settings page and update your profile information.”
“Use the search function to locate a specific article.”
Well-structured test tasks ensure that participants engage with key features and provide relevant insights.
Step 5: Conduct the Usability Test
Once you have your participants and test scenarios, it’s time to conduct the test. Keep these best practices in mind:
Give clear instructions but avoid guiding users too much.
Observe user interactions closely and note any difficulties they face.
Encourage participants to think aloud while performing tasks.
Record sessions for later analysis.
Step 6: Analyze and Interpret the Results
After conducting usability tests, analyze the collected data to identify patterns and pain points. Look for:
Frequent user struggles or errors
Areas where users spend the most time
Features that users find confusing or unintuitive
Using tools like heatmaps, session recordings, and direct feedback will help in data interpretation.
Step 7: Implement Improvements and Retest
Once you’ve identified usability issues, collaborate with developers and designers to implement necessary changes. After making improvements, conduct another round of testing to ensure that the updates have resolved previous problems.
Conclusion
Mobile app usability testing is an ongoing process that helps refine and enhance the user experience. By following this step-by-step approach, businesses can create apps that are intuitive, functional, and enjoyable to use. Genqe.ai provides tools and insights to streamline usability testing, ensuring your app meets the highest standards of user satisfaction.
0 notes
Text
Bitcoin Update: Dipping Below $88K Sparks $1.3B in Cryptocurrency Liquidations Amid Low Whale Interest
Key Points
Bitcoin’s price has slipped below a critical support level, triggering over $1.3 billion in crypto liquidations.
Whale investors are exiting the market, increasing the supply of Bitcoin on centralized exchanges.
The price of Bitcoin has dipped below its key support level in the past two days, falling to as low as $87.7K on some exchanges.
After breaking a significant support level of around $91k, Bitcoin’s price has been retesting a weak liquidity level of around $89.3K.
Technical Analysis of Bitcoin’s Price
If Bitcoin’s price consistently closes below $91k in the coming weeks, a reversal pattern will be confirmed.
This pattern, characterized by double tops around $108K and a bearish divergence of the Relative Strength Index (RSI), could potentially lead to a drop towards the next major support level of around $77k.
Impact of Bitcoin’s Price Drop
The recent volatility of Bitcoin has increased the fear of further crypto selloffs, emboldening short sellers.
As a result, over $1.3 billion was liquidated from the entire crypto market, mostly from long traders on BTC and Ether markets.
Over 362K traders were liquidated in the past 24 hours, with the largest single liquidation order involving $20 million of BTC/USDT on Binance.
Whale Investors Exiting the Market
On-chain data shows that more whale investors are taking profits to protect their capital.
In the past week, the overall supply of BTC on centralized exchanges has increased by about 17,185 coins.
The demand for US spot BTC ETFs has significantly declined in the past three weeks, with a net cash outflow on Monday of about $516 million.
However, Strategy (NASDAQ: MSTR), El Salvador, and Metaplanet Inc continue to accumulate BTC. Metaplanet recently announced the acquisition of 135 BTCs for $13 million.
Is the 2025 Bull Cycle Over?
The 2024/2025 crypto bull cycle has been complicated by the entrance of more institutional investors, nation-states, and complex regulatory frameworks.
As a result, geopolitical tensions, particularly those escalated by the US tariff wars, have heavily impacted the crypto market.
These macroeconomic uncertainties will negatively affect the global supply chain and, in turn, Bitcoin’s demand.
More institutional investors and central banks are now turning to the Gold market, which has recorded a new weekly all-time high since the beginning of the year.
The highly anticipated crypto parabolic rally in 2025 will be triggered by the return of whale investors and the potential inclusion of BTC in the US Sovereign Wealth Fund.
0 notes