#sangroup
Photo
Fantastic experience at Interpol World 2019 conference !! #interpolworld2019 #interpolworld #conference #police #cyberthreats #cybersecurity #Cyberbullying #tech #nextgen #internet #vulsanx #vulsanxcybersecurity #vulsanxcybersecuritybox #vulsanxpentest #vulsanxcybersecurityacademy #sangroup #prakashchristiansen (at Marina Bay Singapore) https://www.instagram.com/p/Bzs_NpGgP_5/?igshid=3q9sbymdk94u
#interpolworld2019#interpolworld#conference#police#cyberthreats#cybersecurity#cyberbullying#tech#nextgen#internet#vulsanx#vulsanxcybersecurity#vulsanxcybersecuritybox#vulsanxpentest#vulsanxcybersecurityacademy#sangroup#prakashchristiansen
0 notes
Text
Machine Learning for Data Analysis: Assignement 3
#Loading Libraries
import numpy as np
import pandas as pd
import matplotlib
import matplotlib.pyplot as plt
import scipy.stats as sp
import datetime as dt
import time as tm
import os
import csv
import seaborn
import pydotplus
import sklearn.metrics
import statsmodels.api as sm
import statsmodels.formula.api as smf
import statsmodels.stats.multicomp as multi
from pandas import Series, DataFrame
from io import StringIO
from IPython.display import Image
from scipy.spatial.distance import cdist
from sklearn import tree
from sklearn import datasets
from sklearn import preprocessing
from sklearn.model_selection import train_test_split
from sklearn.tree import DecisionTreeClassifier
from sklearn.metrics import classification_report
from sklearn.metrics import mean_squared_error
from sklearn.ensemble import ExtraTreesClassifier
from sklearn.ensemble import RandomForestClassifier
from sklearn.linear_model import LassoLarsCV
from sklearn.cluster import KMeans
from sklearn.decomposition import PCA
print('')
print('Data File')
print('-------------------------------------')
file='datamal.csv'
data=pd.read_csv(file,low_memory=False)
#data.columns=map(str.upper,data.columns)
pd.set_option('display.float_format',lambda x: '%f' %x)
data['Water']=data['Water'].apply(pd.to_numeric, errors='coerce') #Explanatory variable
data['Sanitation']=data['Sanitation'].apply(pd.to_numeric, errors='coerce') #Explanatory variable
data['Malaria']=data['Malaria'].apply(pd.to_numeric, errors='coerce') #Response variable
#Remove missing values
subdata=data[['Country', 'Water', 'Sanitation', 'Malaria']].dropna()
#Grouping explanatory variables
subdata['Watergroup']=pd.cut(subdata.Water, [0.00, 0.50, 1.00],labels=[0,1])
subdata['Sangroup']=pd.cut(subdata.Sanitation, [0.00, 0.50, 1.00],labels=[0,1])
subdata['Malgroup']=pd.cut(subdata.Malaria, [0.00, 10000.00, 12000000.00],labels=[0,1])
#Remove missing values
sub1=subdata[['Watergroup','Sangroup','Malgroup']].dropna()
print('sub1.dtypes\n',sub1.dtypes)
print('sub1.describe\n',sub1.describe())
print('')
print('# Data Management')
print('-------------------------------------')
#Split into training and testing sets
predvar=sub1[['Watergroup','Sangroup']]
target=sub1.Malgroup
# standardize predictors to have mean=0 and sd=1
predictors=predvar.copy()
predictors['Watergroup']=preprocessing.scale(predictors['Watergroup'].astype('float64'))
predictors['Sangroup']=preprocessing.scale(predictors['Sangroup'].astype('float64'))
pred_train, pred_test, tar_train, tar_test=train_test_split(predictors, target, test_size=0.3)
print('pred_train.shape\n',pred_train.shape)
print('pred_test.shape\n',pred_test.shape)
print('tar_train.shape\n',tar_train.shape)
print('tar_test.shape\n',tar_test.shape)
# specify the lasso regression model
model=LassoLarsCV(cv=10, precompute=False).fit(pred_train,tar_train)
# print variable names and regression coefficients
print(dict(zip(predictors.columns, model.coef_)))
# plot coefficient progression
m_log_alphas=-np.log10(model.alphas_)
ax=plt.gca()
plt.plot(m_log_alphas, model.coef_path_.T)
plt.axvline(-np.log10(model.alpha_), linestyle='--', color='k',
label='alpha CV')
plt.ylabel('Regression Coefficients')
plt.xlabel('-log(alpha)')
plt.title('Regression Coefficients Progression for Lasso Paths')
# plot mean square error for each fold
m_log_alphascv=-np.log10(model.cv_alphas_)
plt.figure()
plt.plot(m_log_alphascv, model.mse_path_, ':')
plt.plot(m_log_alphascv, model.mse_path_.mean(axis=-1), 'k',
label='Average across the folds', linewidth=2)
plt.axvline(-np.log10(model.alpha_), linestyle='--', color='k',
label='alpha CV')
plt.legend()
plt.xlabel('-log(alpha)')
plt.ylabel('Mean squared error')
plt.title('Mean squared error on each fold')
# MSE from training and test data
train_error=mean_squared_error(tar_train, model.predict(pred_train))
test_error=mean_squared_error(tar_test, model.predict(pred_test))
print('training data MSE')
print(train_error)
print('test data MSE')
print(test_error)
# R-square from training and test data
rsquared_train=model.score(pred_train,tar_train)
rsquared_test=model.score(pred_test,tar_test)
print('training data R-square')
print(rsquared_train)
print('test data R-square')
print(rsquared_test)
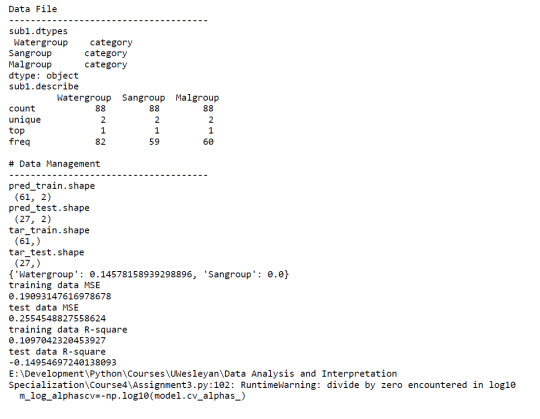

A lasso regression analysis was conducted to identify a subset of variables from 2 categorical predictor variables that best predicted a categorical response variable measuring high or low Malaria cases. Categorical predictors included Water and Sanitation Access. All predictor variables were standardized to have a mean of zero and a standard deviation of one.
Data were randomly split into a training set that included 70% of the observations (N=61) and a test set that included 30% of the observations (N=27). The least angle regression algorithm with k=10 fold cross validation was used to estimate the lasso regression model in the training set, and the model was validated using the test set. The change in the cross validation average (mean) squared error at each step was used to identify the best subset of predictor variables.
Of the 2 predictor variables, 1 was retained in the selected model. During the estimation process,water access was most strongly associated with Malaria cases.
0 notes
Photo
VULSAN X imprints the exposure at INTERPOL WORLD 2019 #interpolworld #interpolworld2019 #speaker #cybersecurity #vulsanxcybersecurity #soc #edr #mdr #penetrationtesting #nextgenmonitoring #cyberattack #technology #international #sangroup #prakashchristiansen (at Marina Bay Singapore) https://www.instagram.com/p/BzgJPf9ARzT/?igshid=1vm55xoptlc5t
#interpolworld#interpolworld2019#speaker#cybersecurity#vulsanxcybersecurity#soc#edr#mdr#penetrationtesting#nextgenmonitoring#cyberattack#technology#international#sangroup#prakashchristiansen
0 notes
Photo

#vulsanx getting acknowledged... #cyberthreats #cybersecurity #conference #idca #datacenter #dc #networksecurity #tech #newtechnology #dlp #sangroup #prakashchristiansen #linux #vulsanxcybersecuritybox (at Malaysian Global Innovation and Creativity Centre) https://www.instagram.com/p/BzU10HgAdIY/?igshid=1ivh50rxagasu
#vulsanx#cyberthreats#cybersecurity#conference#idca#datacenter#dc#networksecurity#tech#newtechnology#dlp#sangroup#prakashchristiansen#linux#vulsanxcybersecuritybox
0 notes
Photo

Women in CyberSecurity !! #women #womeninpower #womenincybersecurity #cybersecurity #vulsanx #womensocanalyst #womens #prakashchristiansen #sangroup #womenintech https://www.instagram.com/p/By9PY-3gSpa/?igshid=buy48np8qp1h
#women#womeninpower#womenincybersecurity#cybersecurity#vulsanx#womensocanalyst#womens#prakashchristiansen#sangroup#womenintech
0 notes
Photo

Humbled and Trilled to work along side with Former FBI Head and potential collaboration 2019 #cyberintelligence #cyberinvestigations #threathunting #cyberwar #cyberbullying #cyberwar #cyberterrorism #cyberattack #vulsanx #vulsanxcybersecuritybox #apt #penetrationtesting #sangroup #prakashchristiansen (at Conrad Manila) https://www.instagram.com/p/Byt1OetAwZh/?igshid=1jarh96nyzdqx
#cyberintelligence#cyberinvestigations#threathunting#cyberwar#cyberbullying#cyberterrorism#cyberattack#vulsanx#vulsanxcybersecuritybox#apt#penetrationtesting#sangroup#prakashchristiansen
0 notes
Photo

Join me here at Malaysia Tech Week as I will be at the Panel Discussion #mdec #mymagic *'EMERGING TECHNOLOGIES & SMART CITY DEVELOPMENT'* *Date : 17th June 2019 (Monday)* *Venue : Open Space, Level 4, Cyberview Sdn Bhd, Block 3750 Persiaran APEC, Cyberjaya 63000.* @blockchainacademy.asia @vulsanx #vulsanxcybersecurity #vulsanxcybersecuritybox #sangroup #cyberwar #cybersecurityexpert #threatintelligence #iot #ml #ai #emergingtech #cyberattack @skmm_mcmc @openuniversitymalaysia https://www.instagram.com/p/BySfdC6Ab3m/?igshid=1oqyb56grn8s0
#mdec#mymagic#vulsanxcybersecurity#vulsanxcybersecuritybox#sangroup#cyberwar#cybersecurityexpert#threatintelligence#iot#ml#ai#emergingtech#cyberattack
0 notes
Photo

NEXT AT VULSAN X !! #bigdata #forensics #cyberintelligence #cyberinvestigations #cybersecuritybootcamp #hacker #hacked #malware #prakashchristiansen #vulsanxcybersecurity #machinelearning #blockchain #artificialintelligence #technology #malaysia #sangroup https://www.instagram.com/p/BxrbquVjzSW/?igshid=15qi3kvw2mwqf
#bigdata#forensics#cyberintelligence#cyberinvestigations#cybersecuritybootcamp#hacker#hacked#malware#prakashchristiansen#vulsanxcybersecurity#machinelearning#blockchain#artificialintelligence#technology#malaysia#sangroup
0 notes
Photo

W O R D ! #cybersecurity #soc #blockchaintechnology #ai #ml #cybersecuritybootcamp #vulsanx #sangroup #prakashchristiansen #artificialintelligence #bigdata #vulsanxcybersecurity https://www.instagram.com/p/Bxmoxa3jxRJ/?igshid=k3pyeqa923dp
#cybersecurity#soc#blockchaintechnology#ai#ml#cybersecuritybootcamp#vulsanx#sangroup#prakashchristiansen#artificialintelligence#bigdata#vulsanxcybersecurity
0 notes
Photo

Honoured share my thoughts with YBhg Prof Emeritus Dato Dr Sheikh Omar Abdul Rahman on Digital Transformation Initiative Tech Innovation Professionals.. i call you to join me at this great initiative .. #cybersecurity #digitaltransformation #cybertechnology #blockchaintechnology #vulsanx #prakashchristiansen #sangroup #ai #ml #sme #b40 #dna23 #iidt #iide #godigital #moe @kempendidikan #iidt #iide (at Putrajaya, Wilayah Persekutuan, Malaysia) https://www.instagram.com/p/Bxj8MviABQO/?igshid=rj6pzch7fy27
#cybersecurity#digitaltransformation#cybertechnology#blockchaintechnology#vulsanx#prakashchristiansen#sangroup#ai#ml#sme#b40#dna23#iidt#iide#godigital#moe
0 notes
Photo

Forum : Transformation Leadership in Digital Era #cybersecurity #ai #blockchain #ml #digitalcommunity #digitaltransformation #entrepreneurship #dataleak @vulsanx @blockchainacademy.asia #prakashchristiansen #sangroup #vulsanx #cyberintelligence #iidt #iide #technology #unicorn https://www.instagram.com/p/BxjCMZgAUC3/?igshid=1vzacc08jkooj
#cybersecurity#ai#blockchain#ml#digitalcommunity#digitaltransformation#entrepreneurship#dataleak#prakashchristiansen#sangroup#vulsanx#cyberintelligence#iidt#iide#technology#unicorn
0 notes
Photo

Roped into UniKL faculty to share my little wisdom !! #industry4wrd #cybersecurity #unikl #csr #vulsanx #sangroup #smartcity #iot #databreach #prakashchristiansen @uniklbmi_ @uniklofficial @uniklceclub #digitaltransformation #digitalentrepreneur @vulsanx (at Universiti Kuala Lumpur British Malaysian Institute) https://www.instagram.com/p/BxP9RWkhw1d/?utm_source=ig_tumblr_share&igshid=1mlqtm2jqpug9
#industry4wrd#cybersecurity#unikl#csr#vulsanx#sangroup#smartcity#iot#databreach#prakashchristiansen#digitaltransformation#digitalentrepreneur
0 notes
Photo

Thank you #industry4wrd #cybersecurity #unikl #csr #vulsanx #sangroup #smartcity #iot #databreach #prakashchristiansen @uniklbmi_ @uniklofficial @uniklceclub #digitaltransformation #digitalentrepreneur @vulsanx (at Universiti Kuala Lumpur British Malaysian Institute) https://www.instagram.com/p/BxP9LCqB0KH/?utm_source=ig_tumblr_share&igshid=1d3cqs8tqw6nc
#industry4wrd#cybersecurity#unikl#csr#vulsanx#sangroup#smartcity#iot#databreach#prakashchristiansen#digitaltransformation#digitalentrepreneur
0 notes
Photo

Roped into UniKL faculty to share my little wisdom !! #industry4wrd #cybersecurity #unikl #csr #vulsanx #sangroup #smartcity #iot #databreach #prakashchristiansen @uniklbmi_ @uniklofficial @uniklceclub #digitaltransformation #digitalentrepreneur @vulsanx https://www.instagram.com/p/BxP89vYB9Vc/?utm_source=ig_tumblr_share&igshid=5vxztdn22b4
#industry4wrd#cybersecurity#unikl#csr#vulsanx#sangroup#smartcity#iot#databreach#prakashchristiansen#digitaltransformation#digitalentrepreneur
0 notes
Photo

Appreciation at the SME Digital Tech 4.0 conference 2019.. #cyber #security #virtualsecurity #iot #smarthome #technology #tracking #cyberresilience #ethicalhacking #penetrationtesting #prakashchristiansen #vulsanx #sangroup #internet #atcen (at Kuala Lumpur, Malaysia) https://www.instagram.com/p/Bw1O3i5hEzv/?utm_source=ig_tumblr_share&igshid=ipnhpfisbc6w
#cyber#security#virtualsecurity#iot#smarthome#technology#tracking#cyberresilience#ethicalhacking#penetrationtesting#prakashchristiansen#vulsanx#sangroup#internet#atcen
0 notes
Photo

You can Run but Can’t Hide !! #youcanrunbutyoucanthide #tracking #spy #smartphone #cyber #cybersecurity #hacker #hacks #vulsanx #prakashchristiansen #sangroup #cyberdefence #cyberattack #deepweb #iot #data #dataleak https://www.instagram.com/p/BwjRqgOhF_U/?utm_source=ig_tumblr_share&igshid=rmoq0yq5hkb6
#youcanrunbutyoucanthide#tracking#spy#smartphone#cyber#cybersecurity#hacker#hacks#vulsanx#prakashchristiansen#sangroup#cyberdefence#cyberattack#deepweb#iot#data#dataleak
0 notes
Last Seen Blogs

mikaeels-blog
like a sunset

onergconsultoria
oneRG

fadingpeachzonkathlete
Untitled

screechingsportscopwobbler-blog
Untitled

kupabardaktoptan
Kupa Bardak Toptan