#statistics with r programming for beginners
Explore tagged Tumblr posts
Visit Tumblr Blog
Explore Tumblr blogs with no restrictions, modern design and the best experience.
Last Seen Tumblr Blogs


Fun Fact
Premium Tumblr themes are available from anywhere between $9 to $49.
Text
5 أسباب جيدة لتعلم علوم البيانات في عام 2023
في السنوات الأخيرة ، برز علم البيانات كواحد من أكثر التخصصات المرغوبة ، ومن المرجح أن تتوسع أهميته فقط في عام 2023. مع تزايد الرقمنة للمؤسسات وتوافر كميات كبيرة من البيانات ، لم يكن هناك طلب أكبر على الأشخاص الذين يمكنهم فهم هذه البيانات واستخلاص رؤى مهمة. لاستخراج معلومات مفيدة من البيانات ودفع عملية صنع القرار المستندة إلى البيانات ، يجمع علم البيانات بين تخصصات متعددة مثل الإحصاء والرياضيات…

View On WordPress
#Data Analysis#Data Analytics#data driven decision making#data mining#Data Science#five good reasons to learn data science in 2023#statistics with r programming for beginners#اتخاذ القرارات القائمة على البيانات#استخراج البيانات#تحليل البيانات#خمسة أسباب وجيهة لتعلم علوم البيانات في عام 2023#علم البيانات
1 note
·
View note
Text
Why Not Write Cryptography
I learned Python in high school in 2003. This was unusual at the time. We were part of a pilot project, testing new teaching materials. The official syllabus still expected us to use PASCAL. In order to satisfy the requirements, we had to learn PASCAL too, after Python. I don't know if PASCAL is still standard.
Some of the early Python programming lessons focused on cryptography. We didn't really learn anything about cryptography itself then, it was all just toy problems to demonstrate basic programming concepts like loops and recursion. Beginners can easily implement some old, outdated ciphers like Caesar, Vigenère, arbitrary 26-letter substitutions, transpositions, and so on.
The Vigenère cipher will be important. It goes like this: First, in order to work with letters, we assign numbers from 0 to 25 to the 26 letters of the alphabet, so A is 0, B is 1, C is 2 and so on. In the programs we wrote, we had to strip out all punctuation and spaces, write everything in uppercase and use the standard transliteration rules for Ä, Ö, Ü, and ß. That's just the encoding part. Now comes the encryption part. For every letter in the plain text, we add the next letter from the key, modulo 26, round robin style. The key is repeated after we get tot he end. Encrypting "HELLOWORLD" with the key "ABC" yields ["H"+"A", "E"+"B", "L"+"C", "L"+"A", "O"+"B", "W"+"C", "O"+"A", "R"+"B", "L"+"C", "D"+"A"], or "HFNLPYOLND". If this short example didn't click for you, you can look it up on Wikipedia and blame me for explaining it badly.
Then our teacher left in the middle of the school year, and a different one took over. He was unfamiliar with encryption algorithms. He took us through some of the exercises about breaking the Caesar cipher with statistics. Then he proclaimed, based on some back-of-the-envelope calculations, that a Vigenère cipher with a long enough key, with the length unknown to the attacker, is "basically uncrackable". You can't brute-force a 20-letter key, and there are no significant statistical patterns.
I told him this wasn't true. If you re-use a Vigenère key, it's like re-using a one time pad key. At the time I just had read the first chapters of Bruce Schneier's "Applied Cryptography", and some pop history books about cold war spy stuff. I knew about the problem with re-using a one-time pad. A one time pad is the same as if your Vigenère key is as long as the message, so there is no way to make any inferences from one letter of the encrypted message to another letter of the plain text. This is mathematically proven to be completely uncrackable, as long as you use the key only one time, hence the name. Re-use of one-time pads actually happened during the cold war. Spy agencies communicated through number stations and one-time pads, but at some point, the Soviets either killed some of their cryptographers in a purge, or they messed up their book-keeping, and they re-used some of their keys. The Americans could decrypt the messages.
Here is how: If you have message $A$ and message $B$, and you re-use the key $K$, then an attacker can take the encrypted messages $A+K$ and $B+K$, and subtract them. That creates $(A+K) - (B+K) = A - B + K - K = A - B$. If you re-use a one-time pad, the attacker can just filter the key out and calculate the difference between two plaintexts.
My teacher didn't know that. He had done a quick back-of-the-envelope calculation about the time it would take to brute-force a 20 letter key, and the likelihood of accidentally arriving at something that would resemble the distribution of letters in the German language. In his mind, a 20 letter key or longer was impossible to crack. At the time, I wouldn't have known how to calculate that probability.
When I challenged his assertion that it would be "uncrackable", he created two messages that were written in German, and pasted them into the program we had been using in class, with a randomly generated key of undisclosed length. He gave me the encrypted output.
Instead of brute-forcing keys, I decided to apply what I knew about re-using one time pads. I wrote a program that takes some of the most common German words, and added them to sections of $(A-B)$. If a word was equal to a section of $B$, then this would generate a section of $A$. Then I used a large spellchecking dictionary to see if the section of $A$ generated by guessing a section of $B$ contained any valid German words. If yes, it would print the guessed word in $B$, the section of $A$, and the corresponding section of the key. There was only a little bit of key material that was common to multiple results, but that was enough to establish how long they key was. From there, I modified my program so that I could interactively try to guess words and it would decrypt the rest of the text based on my guess. The messages were two articles from the local newspaper.
When I showed the decrypted messages to my teacher the next week, got annoyed, and accused me of cheating. Had I installed a keylogger on his machine? Had I rigged his encryption program to leak key material? Had I exploited the old Python random number generator that isn't really random enough for cryptography (but good enough for games and simulations)?
Then I explained my approach. My teacher insisted that this solution didn't count, because it relied on guessing words. It would never have worked on random numeric data. I was just lucky that the messages were written in a language I speak. I could have cheated by using a search engine to find the newspaper articles on the web.
Now the lesson you should take away from this is not that I am smart and teachers are sore losers.
Lesson one: Everybody can build an encryption scheme or security system that he himself can't defeat. That doesn't mean others can't defeat it. You can also create an secret alphabet to protect your teenage diary from your kid sister. It's not practical to use that as an encryption scheme for banking. Something that works for your diary will in all likelihood be inappropriate for online banking, never mind state secrets. You never know if a teenage diary won't be stolen by a determined thief who thinks it holds the secret to a Bitcoin wallet passphrase, or if someone is re-using his banking password in your online game.
Lesson two: When you build a security system, you often accidentally design around an "intended attack". If you build a lock to be especially pick-proof, a burglar can still kick in the door, or break a window. Or maybe a new variation of the old "slide a piece of paper under the door and push the key through" trick works. Non-security experts are especially susceptible to this. Experts in one domain are often blind to attacks/exploits that make use of a different domain. It's like the physicist who saw a magic show and thought it must be powerful magnets at work, when it was actually invisible ropes.
Lesson three: Sometimes a real world problem is a great toy problem, but the easy and didactic toy solution is a really bad real world solution. Encryption was a fun way to teach programming, not a good way to teach encryption. There are many problems like that, like 3D rendering, Chess AI, and neural networks, where the real-world solution is not just more sophisticated than the toy solution, but a completely different architecture with completely different data structures. My own interactive codebreaking program did not work like modern approaches works either.
Lesson four: Don't roll your own cryptography. Don't even implement a known encryption algorithm. Use a cryptography library. Chances are you are not Bruce Schneier or Dan J Bernstein. It's harder than you thought. Unless you are doing a toy programming project to teach programming, it's not a good idea. If you don't take this advice to heart, a teenager with something to prove, somebody much less knowledgeable but with more time on his hands, might cause you trouble.
358 notes
·
View notes
Text
Why Tableau is Essential in Data Science: Transforming Raw Data into Insights

Data science is all about turning raw data into valuable insights. But numbers and statistics alone don’t tell the full story—they need to be visualized to make sense. That’s where Tableau comes in.
Tableau is a powerful tool that helps data scientists, analysts, and businesses see and understand data better. It simplifies complex datasets, making them interactive and easy to interpret. But with so many tools available, why is Tableau a must-have for data science? Let’s explore.
1. The Importance of Data Visualization in Data Science
Imagine you’re working with millions of data points from customer purchases, social media interactions, or financial transactions. Analyzing raw numbers manually would be overwhelming.
That’s why visualization is crucial in data science:
Identifies trends and patterns – Instead of sifting through spreadsheets, you can quickly spot trends in a visual format.
Makes complex data understandable – Graphs, heatmaps, and dashboards simplify the interpretation of large datasets.
Enhances decision-making – Stakeholders can easily grasp insights and make data-driven decisions faster.
Saves time and effort – Instead of writing lengthy reports, an interactive dashboard tells the story in seconds.
Without tools like Tableau, data science would be limited to experts who can code and run statistical models. With Tableau, insights become accessible to everyone—from data scientists to business executives.
2. Why Tableau Stands Out in Data Science
A. User-Friendly and Requires No Coding
One of the biggest advantages of Tableau is its drag-and-drop interface. Unlike Python or R, which require programming skills, Tableau allows users to create visualizations without writing a single line of code.
Even if you’re a beginner, you can:
✅ Upload data from multiple sources
✅ Create interactive dashboards in minutes
✅ Share insights with teams easily
This no-code approach makes Tableau ideal for both technical and non-technical professionals in data science.
B. Handles Large Datasets Efficiently
Data scientists often work with massive datasets—whether it’s financial transactions, customer behavior, or healthcare records. Traditional tools like Excel struggle with large volumes of data.
Tableau, on the other hand:
Can process millions of rows without slowing down
Optimizes performance using advanced data engine technology
Supports real-time data streaming for up-to-date analysis
This makes it a go-to tool for businesses that need fast, data-driven insights.
C. Connects with Multiple Data Sources
A major challenge in data science is bringing together data from different platforms. Tableau seamlessly integrates with a variety of sources, including:
Databases: MySQL, PostgreSQL, Microsoft SQL Server
Cloud platforms: AWS, Google BigQuery, Snowflake
Spreadsheets and APIs: Excel, Google Sheets, web-based data sources
This flexibility allows data scientists to combine datasets from multiple sources without needing complex SQL queries or scripts.
D. Real-Time Data Analysis
Industries like finance, healthcare, and e-commerce rely on real-time data to make quick decisions. Tableau’s live data connection allows users to:
Track stock market trends as they happen
Monitor website traffic and customer interactions in real time
Detect fraudulent transactions instantly
Instead of waiting for reports to be generated manually, Tableau delivers insights as events unfold.
E. Advanced Analytics Without Complexity
While Tableau is known for its visualizations, it also supports advanced analytics. You can:
Forecast trends based on historical data
Perform clustering and segmentation to identify patterns
Integrate with Python and R for machine learning and predictive modeling
This means data scientists can combine deep analytics with intuitive visualization, making Tableau a versatile tool.
3. How Tableau Helps Data Scientists in Real Life
Tableau has been adopted by the majority of industries to make data science more impactful and accessible. This is applied in the following real-life scenarios:
A. Analytics for Health Care
Tableau is deployed by hospitals and research institutions for the following purposes:
Monitor patient recovery rates and predict outbreaks of diseases
Analyze hospital occupancy and resource allocation
Identify trends in patient demographics and treatment results
B. Finance and Banking
Banks and investment firms rely on Tableau for the following purposes:
✅ Detect fraud by analyzing transaction patterns
✅ Track stock market fluctuations and make informed investment decisions
✅ Assess credit risk and loan performance
C. Marketing and Customer Insights
Companies use Tableau to:
✅ Track customer buying behavior and personalize recommendations
✅ Analyze social media engagement and campaign effectiveness
✅ Optimize ad spend by identifying high-performing channels
D. Retail and Supply Chain Management
Retailers leverage Tableau to:
✅ Forecast product demand and adjust inventory levels
✅ Identify regional sales trends and adjust marketing strategies
✅ Optimize supply chain logistics and reduce delivery delays
These applications show why Tableau is a must-have for data-driven decision-making.
4. Tableau vs. Other Data Visualization Tools
There are many visualization tools available, but Tableau consistently ranks as one of the best. Here’s why:
Tableau vs. Excel – Excel struggles with big data and lacks interactivity; Tableau handles large datasets effortlessly.
Tableau vs. Power BI – Power BI is great for Microsoft users, but Tableau offers more flexibility across different data sources.
Tableau vs. Python (Matplotlib, Seaborn) – Python libraries require coding skills, while Tableau simplifies visualization for all users.
This makes Tableau the go-to tool for both beginners and experienced professionals in data science.
5. Conclusion
Tableau has become an essential tool in data science because it simplifies data visualization, handles large datasets, and integrates seamlessly with various data sources. It enables professionals to analyze, interpret, and present data interactively, making insights accessible to everyone—from data scientists to business leaders.
If you’re looking to build a strong foundation in data science, learning Tableau is a smart career move. Many data science courses now include Tableau as a key skill, as companies increasingly demand professionals who can transform raw data into meaningful insights.
In a world where data is the driving force behind decision-making, Tableau ensures that the insights you uncover are not just accurate—but also clear, impactful, and easy to act upon.
#data science course#top data science course online#top data science institute online#artificial intelligence course#deepseek#tableau
3 notes
·
View notes
Text
Exploring Data Science Tools: My Adventures with Python, R, and More
Welcome to my data science journey! In this blog post, I'm excited to take you on a captivating adventure through the world of data science tools. We'll explore the significance of choosing the right tools and how they've shaped my path in this thrilling field.
Choosing the right tools in data science is akin to a chef selecting the finest ingredients for a culinary masterpiece. Each tool has its unique flavor and purpose, and understanding their nuances is key to becoming a proficient data scientist.
I. The Quest for the Right Tool
My journey began with confusion and curiosity. The world of data science tools was vast and intimidating. I questioned which programming language would be my trusted companion on this expedition. The importance of selecting the right tool soon became evident.
I embarked on a research quest, delving deep into the features and capabilities of various tools. Python and R emerged as the frontrunners, each with its strengths and applications. These two contenders became the focus of my data science adventures.
II. Python: The Swiss Army Knife of Data Science
Python, often hailed as the Swiss Army Knife of data science, stood out for its versatility and widespread popularity. Its extensive library ecosystem, including NumPy for numerical computing, pandas for data manipulation, and Matplotlib for data visualization, made it a compelling choice.
My first experiences with Python were both thrilling and challenging. I dove into coding, faced syntax errors, and wrestled with data structures. But with each obstacle, I discovered new capabilities and expanded my skill set.
III. R: The Statistical Powerhouse
In the world of statistics, R shines as a powerhouse. Its statistical packages like dplyr for data manipulation and ggplot2 for data visualization are renowned for their efficacy. As I ventured into R, I found myself immersed in a world of statistical analysis and data exploration.
My journey with R included memorable encounters with data sets, where I unearthed hidden insights and crafted beautiful visualizations. The statistical prowess of R truly left an indelible mark on my data science adventure.
IV. Beyond Python and R: Exploring Specialized Tools
While Python and R were my primary companions, I couldn't resist exploring specialized tools and programming languages that catered to specific niches in data science. These tools offered unique features and advantages that added depth to my skill set.
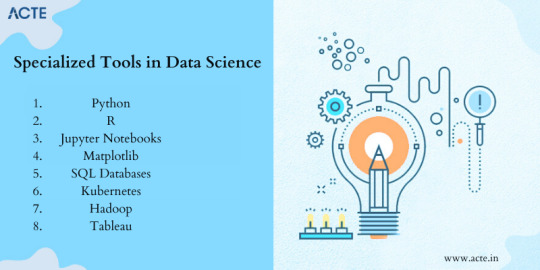
For instance, tools like SQL allowed me to delve into database management and querying, while Scala opened doors to big data analytics. Each tool found its place in my toolkit, serving as a valuable asset in different scenarios.
V. The Learning Curve: Challenges and Rewards
The path I took wasn't without its share of difficulties. Learning Python, R, and specialized tools presented a steep learning curve. Debugging code, grasping complex algorithms, and troubleshooting errors were all part of the process.
However, these challenges brought about incredible rewards. With persistence and dedication, I overcame obstacles, gained a profound understanding of data science, and felt a growing sense of achievement and empowerment.
VI. Leveraging Python and R Together
One of the most exciting revelations in my journey was discovering the synergy between Python and R. These two languages, once considered competitors, complemented each other beautifully.
I began integrating Python and R seamlessly into my data science workflow. Python's data manipulation capabilities combined with R's statistical prowess proved to be a winning combination. Together, they enabled me to tackle diverse data science tasks effectively.
VII. Tips for Beginners
For fellow data science enthusiasts beginning their own journeys, I offer some valuable tips:
Embrace curiosity and stay open to learning.
Work on practical projects while engaging in frequent coding practice.
Explore data science courses and resources to enhance your skills.
Seek guidance from mentors and engage with the data science community.
Remember that the journey is continuous—there's always more to learn and discover.
My adventures with Python, R, and various data science tools have been transformative. I've learned that choosing the right tool for the job is crucial, but versatility and adaptability are equally important traits for a data scientist.
As I summarize my expedition, I emphasize the significance of selecting tools that align with your project requirements and objectives. Each tool has a unique role to play, and mastering them unlocks endless possibilities in the world of data science.
I encourage you to embark on your own tool exploration journey in data science. Embrace the challenges, relish the rewards, and remember that the adventure is ongoing. May your path in data science be as exhilarating and fulfilling as mine has been.
Happy data exploring!
22 notes
·
View notes
Text
Common Mistakes Which Students Make in R Homework
Are you struggling with your R homework and seeking guidance on how to improve? Many students face challenges when dealing with R programming assignments. In this post, we'll discuss common mistakes students make in their R homework and provide tips on how to overcome them. Whether you're a beginner or an experienced R user, understanding these pitfalls will help you write your R homework more efficiently.
The Importance of Writing My R Homework Correctly
R programming language is widely used in statistics, data analysis, and machine learning. Properly completing R homework is crucial for mastering these skills and achieving academic success. Let's explore the common mistakes students often make and how to avoid them.
Lack of Understanding the Assignment
One prevalent mistake is starting your R homework without a clear understanding of the assignment. Before diving in, take the time to thoroughly read and comprehend the requirements. This will ensure you don't waste time on irrelevant tasks and can focus on the key objectives.
Inefficient Code Organization
Messy and disorganized code is a common pitfall. When writing R code, structure and organization matter. Use meaningful variable names, comment your code, and break it into logical sections. This not only makes your work more readable but also helps you and others understand the logic behind each step.
Ignoring Proper Documentation
Documentation is often overlooked but is crucial in R programming. Make it a habit to document your code, explaining the purpose of each function and variable. This not only helps you understand your code later but also assists others who may review or use your work.
Neglecting Error Handling
Every coder encounters errors, and R programming is no exception. Ignoring error handling can lead to frustration and wasted time. Learn to anticipate and handle errors effectively to streamline your coding process.
Not Seeking Help When Needed
Don't hesitate to seek help when you're stuck. Whether it's from your instructor, classmates, or online resources, getting assistance can help you overcome challenges and gain a deeper understanding of R programming.
The Role of "Write My R Homework" Services
If you find yourself consistently struggling with your R homework, consider exploring professional services that specialize in "write my R homework." These services can provide valuable insights, examples, and assistance, helping you improve your skills and academic performance.
Conclusion:
Mastering R programming requires practice, patience, and a proactive approach to learning. By avoiding common mistakes, organizing your code efficiently, and seeking help when needed, you can write your R homework like a pro. Remember, success in R programming is achievable with dedication and the right mindset.
#write my R Homework#R Homework help#R Homework#Homework Help#statisticshomeworkhelp#statisticshomeworkhelper
9 notes
·
View notes
Text
Exploring Career Options: Data Analytics vs. Digital Marketing
In the vast landscape of career choices, two fields have recently been in the spotlight: data analytics and digital marketing. Both offer promising avenues for growth and success, but they cater to different skill sets and interests. Whether you're inclined towards deciphering data or crafting compelling digital campaigns, understanding the intricacies of each field is essential for making an informed career decision.

In this blog post, we'll delve into the details of data analytics and digital marketing, highlighting their advantages, drawbacks, and potential career paths to help you navigate your professional journey effectively.
Data Analytics: Deciphering Insights From Data
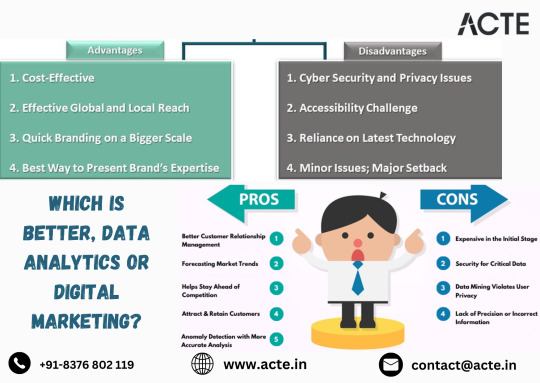
Advantages of Data Analytics:
High Demand: Data analytics is witnessing a surge in demand as businesses increasingly rely on data-driven insights to drive their decisions. Professionals proficient in analyzing data are highly sought after across various industries.
Versatility: The skills acquired in data analytics are applicable across diverse sectors, including finance, healthcare, retail, and technology. This versatility opens doors to a wide range of career opportunities.
Lucrative Salaries: Skilled data analysts command competitive salaries due to their ability to extract valuable insights from complex datasets. The demand for their expertise translates into attractive compensation packages.
Drawbacks of Data Analytics:
Steep Learning Curve: Mastering data analytics requires proficiency in statistical techniques, programming languages like Python or R, and data visualization tools. The learning curve can be steep, especially for beginners.
Continuous Upskilling: The field of data analytics is constantly evolving, necessitating professionals to stay updated with the latest trends and technologies. Continuous upskilling is crucial to remain competitive.
Technical Complexity: Dealing with large datasets and complex algorithms can be challenging. Data analysts need to possess a high level of technical expertise and attention to detail to navigate through intricate data structures.
Digital Marketing: Crafting Compelling Campaigns in the Online Sphere
Advantages of Digital Marketing:
Creativity: Digital marketing offers ample opportunities for creative expression. From crafting engaging content to designing innovative campaigns, digital marketers have the freedom to unleash their creativity.
Immediate Impact: Digital marketing campaigns can yield quick results and reach a vast audience within a short span. The immediacy of impact makes it an appealing choice for those seeking tangible outcomes.
Diverse Career Paths: Digital marketing encompasses various roles, including social media management, content marketing, SEO, and email marketing. This diversity allows individuals to explore different career paths and areas of specialization.
Drawbacks of Digital Marketing:
Rapid Changes: The digital marketing landscape is constantly evolving, with new platforms, algorithms, and trends emerging regularly. Keeping up with these changes requires adaptability and continuous learning.
Metrics-Driven: Digital marketers need to analyze data and metrics to measure the effectiveness of their campaigns. While this provides valuable insights, it also requires a basic understanding of analytics tools and methodologies.
Competitive Field: With the accessibility of digital marketing tools and platforms, the field has become increasingly competitive. Professionals need to differentiate themselves through innovation and expertise to stand out.
Choosing the Right Path for You
Ultimately, the decision between data analytics and digital marketing depends on your individual strengths, interests, and career aspirations. If you have a penchant for numbers and enjoy uncovering insights from data, data analytics might be the ideal fit. Conversely, if you're passionate about storytelling, creative content creation, and engaging with audiences online, digital marketing could be your calling.
It's essential to consider your skills, interests, and long-term goals when making this decision. Whichever path you choose, both data analytics and digital marketing offer exciting opportunities for growth, learning, and career advancement. By understanding the intricacies of each field and aligning them with your aspirations, you can embark on a fulfilling professional journey tailored to your unique strengths and passions.
Conclusion
In conclusion, the choice between data analytics and digital marketing hinges on understanding your strengths, interests, and career goals. Both fields present distinct opportunities for growth and success, catering to different skill sets and preferences. Whether you're drawn to the analytical realm of data or the creative domain of digital promotion, there's no one-size-fits-all answer. Take the time to explore your options, evaluate your strengths, and chart a career path that aligns with your aspirations. With the right mindset and determination, you can carve out a rewarding career in either data analytics or digital marketing—or even both!
#tech#training#digital marketing#digital marketing company#digital marketing course#email marketing#online marketing#search engine optimization#seo#seo services
4 notes
·
View notes
Text
Hands-On Data Science: Practical Steps for Aspiring Data Scientists
Embarking on the journey to study data science may initially seem like a complex and challenging task, but with a strategic approach, it can become a rewarding and accessible endeavor. Choosing the Best Data Science Institute can further accelerate your journey into this thriving industry. Let's explore a roadmap that can make your data science learning experience smoother and more manageable, breaking down the process into actionable steps.
1. Start with the Basics: Lay a Solid Foundation in Mathematics and Statistics
Commence your data science journey by establishing a robust foundation in the essentials of mathematics and statistics. Grasp fundamental concepts such as linear algebra and probability, which serve as the bedrock for advanced data science algorithms.
2. Learn a Programming Language: Begin Your Coding Journey with Python or R
Acquire proficiency in a programming language widely used in data science, such as Python or R. These languages are renowned for their user-friendliness and come equipped with extensive libraries and resources tailored for data science enthusiasts.
3. Explore Online Learning Platforms: Enroll in Accessible and Structured Courses
Embark on your learning adventure by enrolling in online courses specifically designed for beginners. Platforms like Coursera, edX, and ACTE Technologies offer a plethora of courses crafted by top universities and industry experts, covering fundamental topics like "Introduction to Data Science."
4. Hands-On Projects: Apply Theoretical Knowledge Through Real-world Applications
Translate theoretical knowledge into practical skills through hands-on projects. Platforms like Kaggle provide datasets and challenges that allow you to apply and implement what you've learned, solidifying your understanding through real-world applications.
5. Utilize Data Science Libraries: Master Essential Tools
Familiarize yourself with popular data science libraries in Python, such as Pandas, NumPy, and Scikit-Learn. These libraries simplify complex tasks and are widely adopted in the industry, making them indispensable tools in your data science toolkit.
6. Read Widely: Supplement Learning with In-Depth Resources
Enhance your online learning by delving into books on data science. Resources like "The Data Science Handbook" and "Python for Data Analysis" offer valuable insights into best practices and real-world applications. Follow reputable data science blogs to stay informed on emerging industry trends.
7. Engage with the Community: Join Forums and Discussions to Foster Connections
Immerse yourself in the vibrant data science community through platforms like Stack Overflow and Reddit. Actively participate in discussions, pose questions, and learn from the experiences of fellow enthusiasts. Networking is a valuable component of the learning process, offering diverse perspectives and insights.
8. Specialize Based on Interest: Explore and Deepen Your Understanding
As you advance in your studies, explore different areas within data science based on your interests. Whether it's machine learning, data engineering, or natural language processing, find a niche that resonates with your passion and curiosity.
9. Continuous Learning: Cultivate a Lifelong Learning Mindset
Recognize that data science is an ever-evolving field. Cultivate a mindset of continuous learning. Stay curious, explore advanced topics, and keep yourself updated on the latest industry developments to remain at the forefront of the field.
10. Practice Regularly: Consistency is Key to Mastery
Consistency is paramount in mastering data science. Dedicate regular time to your studies, practice coding, and engage in projects consistently. Building a habit ensures steady progress and reinforces your skills over time, enabling you to tackle increasingly complex challenges.
In conclusion, mastering data science is a journey that involves a combination of theoretical understanding, practical application, and a commitment to continuous learning. By following this roadmap and breaking down the learning process into manageable steps, you can navigate the world of data science with confidence and ease. Remember that the key to success lies not only in the destination but in the learning and growth that happens along the way. Choosing the best Data Science Courses in Chennai is a crucial step in acquiring the necessary expertise for a successful career in the evolving landscape of data science.
2 notes
·
View notes
Text
Unlock the World of Data Analysis: Programming Languages for Success!
💡 When it comes to data analysis, choosing the right programming language can make all the difference. Here are some popular languages that empower professionals in this exciting field
https://www.clinicalbiostats.com/
🐍 Python: Known for its versatility, Python offers a robust ecosystem of libraries like Pandas, NumPy, and Matplotlib. It's beginner-friendly and widely used for data manipulation, visualization, and machine learning.
📈 R: Built specifically for statistical analysis, R provides an extensive collection of packages like dplyr, ggplot2, and caret. It excels in data exploration, visualization, and advanced statistical modeling.
🔢 SQL: Structured Query Language (SQL) is essential for working with databases. It allows you to extract, manipulate, and analyze large datasets efficiently, making it a go-to language for data retrieval and management.
💻 Java: Widely used in enterprise-level applications, Java offers powerful libraries like Apache Hadoop and Apache Spark for big data processing. It provides scalability and performance for complex data analysis tasks.
📊 MATLAB: Renowned for its mathematical and numerical computing capabilities, MATLAB is favored in academic and research settings. It excels in data visualization, signal processing, and algorithm development.
🔬 Julia: Known for its speed and ease of use, Julia is gaining popularity in scientific computing and data analysis. Its syntax resembles mathematical notation, making it intuitive for scientists and statisticians.
🌐 Scala: Scala, with its seamless integration with Apache Spark, is a valuable language for distributed data processing and big data analytics. It combines object-oriented and functional programming paradigms.
💪 The key is to choose a language that aligns with your specific goals and preferences. Embrace the power of programming and unleash your potential in the dynamic field of data analysis! 💻📈
#DataAnalysis#ProgrammingLanguages#Python#RStats#SQL#Java#MATLAB#JuliaLang#Scala#DataScience#BigData#CareerOpportunities#biostatistics#onlinelearning#lifesciences#epidemiology#genetics#pythonprogramming#clinicalbiostatistics#datavisualization#clinicaltrials
4 notes
·
View notes
Text
How Quanttrix Makes Algo Trading Easy for Beginners

How Quanttrix Simplifies Algo Trading for Beginners
Imagine trying to learn a musical instrument without knowing how to read notes. Intimidating, right? That’s exactly how most people feel when they hear the words quantitative trading or algorithmic trading.
But what if there was a way to make this complex world of stock trading not just easy—but exciting? That’s where Quanttrix comes in.
This isn’t just another algo trading company in India. Quanttrix is like the friendly tutor who breaks down the complexities of music into easy rhythms anyone can follow.
Whether you’re just starting out or curious about how AI for trading stocks actually works, this guide is tailor-made for you.
Discover how Quanttrix simplifies quantitative trading for beginners using AI for trading stocks. A top algo trading company in India.
Introduction to Algo Trading and Why It Matters
Let’s start with the basics. Algorithmic trading, or algo trading, uses computer programs to make trading decisions. These programs follow a set of instructions—called algorithms—to decide when to buy or sell stocks.
In a world where stock prices change in milliseconds, relying on human judgment alone can be risky. That’s why algo trading is no longer optional—it’s essential for staying ahead in the market.
What Is Quantitative Trading? A Simple Explanation
Think of quantitative trading as trading based on math, data, and logic instead of gut feelings. It’s like using Google Maps instead of guessing your way through traffic.
With the help of numbers, statistics, and patterns, this form of trading aims to take emotion out of investing—and replace it with precision.
The Traditional Challenges Beginners Face
Before platforms like Quanttrix existed, beginners had a tough time getting into algo trading. Here’s what usually got in the way:
Complex tools and jargon
Need to know coding
Expensive platforms
Zero guidance or support
It was like trying to fly a plane without flying lessons. Dangerous and discouraging.
Meet Quanttrix ��� The Game-Changer
Quanttrix is not just another algo trading company in India—it’s a platform designed with beginners in mind.
Instead of overwhelming you with features you don’t understand, it offers a smooth, simple, and smart entry into the world of quantitative trading.
Why Quanttrix Stands Out Among Algo Trading Companies in India
There are many algo trading firms, but here’s why Quanttrix shines:
Beginner-friendly tools
No-code strategy builder
AI-driven suggestions
Live customer support
Affordable pricing
It’s not just about trading—it’s about helping you trade better.
User-Friendly Interface: No Coding? No Problem!
Most algo platforms demand you learn Python or R. Not Quanttrix.
You can build your trading strategy using drag-and-drop tools. It’s like creating a playlist on Spotify—intuitive and fun.
Want to create a rule that says, “Buy stock A when its price goes above ₹100”? Just click and set—it’s that easy.
Powerful AI for Trading Stocks – Explained Simply
Quanttrix uses advanced AI for trading stocks, but let’s make it simple.
AI here acts like your personal trading assistant. It studies the market, identifies patterns, and even suggests strategies that match your risk level and interests.
It’s like having an experienced trader whispering tips in your ear—minus the noise.
Customizable Strategies: Trading That Fits You
Everyone’s risk appetite is different. Some want quick wins; others prefer slow, steady growth.
Quanttrix allows you to tailor your strategy:
Choose your indicators (RSI, MACD, etc.)
Set your own entry and exit points
Define your stop-loss and target levels
You’re in control—but with expert support.
Real-Time Analytics: Making Smart Moves Instantly
Timing is everything in trading.
Quanttrix provides real-time data visualization to show what’s happening in the market right now. Charts, heatmaps, alerts—you see the big picture at a glance.
No more guessing. Just smart, informed decisions.
Automated Backtesting: Learn Without Losing
Want to know if your strategy would have worked in the past?
Quanttrix’s backtesting feature lets you test your plan against historical data. If your strategy loses money in the past, you’ll know before using it in real trades.
It’s like rehearsing before the big performance—without risking your money.
Risk Management Tools That Actually Help
One of the biggest fears beginners have is losing money.
Quanttrix provides built-in risk control features like:
Maximum loss per day
Position sizing calculators
Automatic stop-loss and take-profit
It helps you stay safe while you learn and grow.
Educational Resources for Lifelong Learning
Quanttrix isn’t just a tool—it’s a learning hub.
It offers:
Video tutorials
Webinars with experts
Glossaries for trading terms
Sample strategies to practice
Perfect for anyone who wants to grow from beginner to pro.
Affordable Plans for All Kinds of Traders
Unlike some platforms that cost a fortune, Quanttrix keeps its pricing transparent and beginner-friendly.
Whether you’re a student, a side-hustler, or a full-time trader, there’s a plan that fits your pocket.
Beginner Success Stories with Quanttrix
Don’t just take our word for it. Many new traders have started with zero experience and seen success using Quanttrix.
Like Rohan from Delhi, who said, "I was always scared of stock trading. But with Quanttrix, I built my first strategy in under an hour—and made my first profit in a week!"
Stories like these show that anyone can trade, with the right support.
Final Thoughts – Is Quanttrix Right for You?
If you’ve ever felt that trading was too technical, too risky, or just not for you—Quanttrix is here to change that mindset.
It brings the best of quantitative trading and AI for trading stocks, and wraps it in a user-friendly package that speaks your language.
Whether you're testing the waters or diving deep, Quanttrix is your reliable co-pilot in the exciting world of trading.
Frequently Asked Questions (FAQs)
Do I need to know coding to use Quanttrix? Not at all. Quanttrix is designed for non-coders, with a drag-and-drop interface that’s super easy to use.
Is Quanttrix suitable for someone with no trading experience? Yes! It’s made especially for beginners, offering tutorials, pre-built strategies, and helpful customer support.
How does Quanttrix use AI for trading stocks? Quanttrix’s AI studies market trends, suggests trading strategies, and continuously optimizes them to improve performance.
Can I try Quanttrix before committing to a paid plan? Absolutely. Quanttrix offers free trials so you can explore features without any upfront cost.
Is Quanttrix a registered algo trading company in India? Yes, Quanttrix complies with Indian regulations and partners with top brokers for secure, legal trading.
0 notes
Text
What is a PGP in Data Science? A Complete Guide for Beginners

Businesses in the data-driven world of today mostly depend on insights from vast amounts of data. From predicting customer behavior to optimizing supply chains, data science plays a vital role in decision-making processes across industries. As the demand for skilled data scientists continues to grow, many aspiring professionals are turning to specialized programs like the PGP in Data Science to build a strong foundation and excel in this field.
If you’re curious about what a Post Graduate Program in Data Science entails and how it can benefit your career, this comprehensive guide is for you.
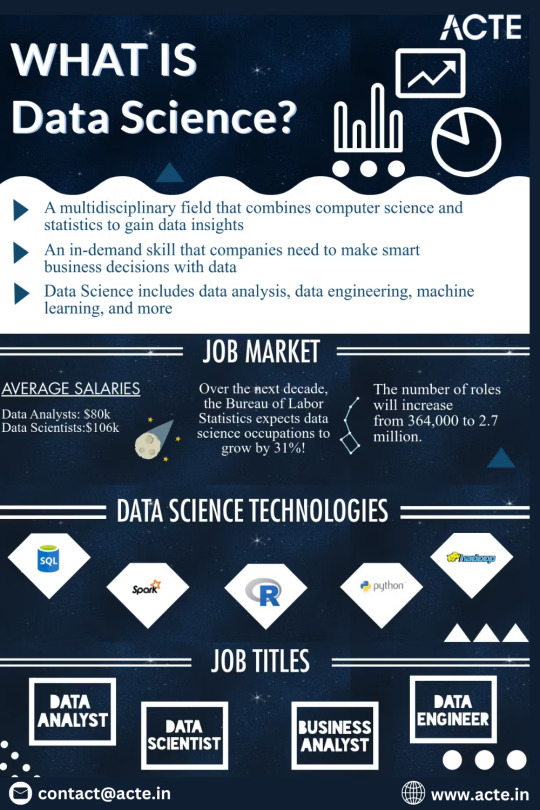
What is Data Science?
Data science is a multidisciplinary field that uses statistical methods, machine learning, data analysis, and computer science to extract insights from structured and unstructured data. It is used to solve real-world problems by uncovering patterns and making predictions.
The role of a data scientist is to collect, clean, analyze, and interpret large datasets to support strategic decision-making. With the growth of big data, cloud computing, and AI technologies, data science has become a highly lucrative and in-demand career path.
What is a PGP in Data Science?
A PGP in Data Science (Post Graduate Program in Data Science) is a comprehensive program designed to equip learners with both theoretical knowledge and practical skills in data science, analytics, machine learning, and related technologies. Unlike traditional degree programs, PGPs are typically more industry-focused, tailored for working professionals or graduates who want to quickly upskill or transition into the field of data science.
These programs are often offered by reputed universities, tech institutions, and online education platforms, with durations ranging from 6 months to 2 years.
Why Choose a Post Graduate Program in Data Science?
Here are some key reasons why a Post Graduate Program in Data Science is worth considering:
High Demand for Data Scientists
Data is the new oil, and businesses need professionals who can make sense of it. According to various industry reports, there is a massive talent gap in the data science field, and a PGP can help bridge this gap.
Industry-Relevant Curriculum
Unlike traditional degree programs, a PGP focuses on the tools, techniques, and real-world applications currently used in the industry.
Fast-Track Career Transition
PGP programs are structured to deliver maximum value in a shorter time frame, making them ideal for professionals looking to switch to data science.
Global Career Opportunities
Data scientists are in demand not just in India but globally. Completing a PGP in Data Science makes you a competitive candidate worldwide.
Key Components of a Post Graduate Program in Data Science
Most PGP in Data Science programs cover the following key areas:
Statistics and Probability
Python and R Programming
Data Wrangling and Visualization
Machine Learning Algorithms
Deep Learning & Neural Networks
Natural Language Processing (NLP)
Big Data Technologies (Hadoop, Spark)
SQL and NoSQL Databases
Business Analytics
Capstone Projects
Some programs include soft skills training, resume building, and interview preparation sessions to boost job readiness.
Who Should Enroll in a PGP in Data Science?
A Post Graduate Program in Data Science is suitable for:
Fresh graduates looking to enter the field of data science
IT professionals aiming to upgrade their skills
Engineers, mathematicians, and statisticians transitioning to data roles
Business analysts who want to learn data-driven decision-making
Professionals from non-technical backgrounds looking to switch careers
Whether you are a beginner or have prior knowledge, a PGP can provide the right blend of theory and hands-on learning.
Skills You Will Learn
By the end of a PGP in Data Science, you will gain expertise in:
Programming languages: Python, R
Data preprocessing and cleaning
Exploratory data analysis
Model building and evaluation
Machine learning algorithms like Linear Regression, Decision Trees, Random Forests, SVM, etc.
Deep learning frameworks like TensorFlow and Keras
SQL for data querying
Data visualization tools like Tableau or Power BI
Real-world business problem-solving
These skills make you job-ready and help you handle real-time projects with confidence.
Curriculum Overview
Here’s a general breakdown of a Post Graduate Program in Data Science curriculum:
Module 1: Introduction to Data Science
Fundamentals of data science
Tools and technologies overview
Module 2: Programming Essentials
Python programming
R programming basics
Jupyter Notebooks and IDEs
Module 3: Statistics & Probability
Descriptive and inferential statistics
Hypothesis testing
Probability distributions
Module 4: Data Manipulation and Visualization
Pandas, NumPy
Matplotlib, Seaborn
Data storytelling
Module 5: Machine Learning
Supervised and unsupervised learning
Model training and tuning
Scikit-learn
Module 6: Deep Learning and AI
Neural networks
Convolutional Neural Networks (CNN)
Recurrent Neural Networks (RNN)
Module 7: Big Data Technologies
Introduction to Hadoop ecosystem
Apache Spark
Real-time data processing
Module 8: Projects & Capstone
Industry case studies
Group projects
Capstone project on end-to-end ML pipeline
Duration and Mode of Delivery
Most PGP in Data Science programs are designed to be completed in 6 to 12 months, depending on the institution and the pace of learning (part-time or full-time). Delivery modes include:
Online (Self-paced or Instructor-led)
Hybrid (Online + Offline workshops)
Classroom-based (Less common today)
Online formats are highly popular due to flexibility, recorded sessions, and access to mentors and peer groups.
Admission Requirements
Admission criteria for a Post Graduate Program in Data Science generally include:
A bachelor’s degree (any discipline)
Basic understanding of mathematics and statistics
Programming knowledge (optional, but beneficial)
An exam or interview may be required by some institutions.
Why a Post Graduate Program in Data Science from Career Amend?
Career Amend offers a comprehensive Post Graduate Program (PGP) in Data Science designed to be completed in just one year, making it an ideal choice for professionals and graduates who wish to enter the field of data science without spending multiple years in formal education. This program has been thoughtfully curated to combine foundational theory with hands-on practical learning, ensuring that students not only understand the core principles. Still, it can also apply them to real-world data challenges.
The one-year structure of Career Amend’s PGP in Data Science is intensive yet flexible, catering to both full-time learners and working professionals. The curriculum spans various topics, including statistics, Python programming, data visualization, machine learning, deep learning, and big data tools. Learners are also introduced to key technologies and platforms like SQL, Tableau, TensorFlow, and cloud services like AWS or Azure. This practical approach helps students gain industry-relevant skills that are immediately applicable.
What sets Career Amend apart is its strong focus on industry integration. The course includes live projects, case studies, and mentorship from experienced data scientists. Learners gain exposure to real-time business problems and data sets through these components, making them job-ready upon completion. The capstone project at the end of the program allows students to showcase their comprehensive knowledge by solving a complex, practical problem, an asset they can add to their portfolios.
Additionally, Career Amend offers dedicated career support services, including resume building, mock interviews, and job placement assistance. Whether a student is looking to switch careers or upskill within their current role, this one-year PGP in Data Science opens doors to numerous high-growth roles such as data scientist, machine learning engineer, data analyst, and more.
Final Thoughts
A PGP in Data Science is an excellent option for anyone looking to enter the field of data science without committing to a full-time degree. It combines the depth of a traditional postgraduate degree with the flexibility and industry alignment of modern learning methods. Whether a recent graduate or a mid-level professional, enrolling in a Post Graduate Program in Data Science can provide the competitive edge you need in today's tech-driven job market.
So, suppose you're asking yourself, "Is a PGP in Data Science worth it?". In that case, the answer is a YES, especially if you are serious about building a career in one of the most dynamic and high-paying domains of the future.
#PGP in Data Science#Post Graduate Program in Data Science#data science#machine learning#data analysis#data analytics#datascience
1 note
·
View note
Text
Learn Data Analytics in Noida – From Basics to Advanced
In today’s data-driven world, businesses rely heavily on data analytics to make informed decisions, improve operations, and gain a competitive edge. Whether you're a student, recent graduate, or working professional looking to upskill, learning data analytics in Noida offers a powerful pathway to a high-demand career in tech.
Why Learn Data Analytics?
Data analytics is the backbone of digital transformation. From retail to healthcare, finance to logistics, organizations are harnessing data to improve efficiency, predict trends, and tailor experiences to customers. By mastering data analytics, you gain the ability to extract meaningful insights from raw data — a skill that is both valuable and versatile.
Why Choose Noida for Data Analytics Training?
Noida, as one of India’s leading tech hubs, is home to numerous IT companies, startups, and MNCs that are actively hiring skilled data professionals. It also hosts top-rated institutes and training centers offering comprehensive data analytics programs tailored to current industry needs.
Here’s why Noida stands out:
Industry-Oriented Curriculum Training programs cover real-world tools like Excel, SQL, Python, R, Tableau, Power BI, and advanced machine learning techniques.
Hands-On Learning Most courses offer live projects, internships, and case studies to provide practical experience.
Placement Support Institutes in Noida often have tie-ups with local tech firms, increasing your chances of landing a job right after training.
Flexible Modes Choose from classroom, online, or hybrid formats based on your convenience.
What You’ll Learn: From Basics to Advanced
1. Beginner Level:
Introduction to data and its types
Excel for data manipulation
Basics of SQL for database querying
Data visualization fundamentals
2. Intermediate Level:
Python or R for data analysis
Exploratory Data Analysis (EDA)
Working with real-time datasets
Introduction to business intelligence tools (Tableau/Power BI)
3. Advanced Level:
Predictive analytics using machine learning
Time-series analysis
Natural Language Processing (NLP)
Big data tools (Hadoop, Spark – optional)
Capstone projects and portfolio building
Who Can Enroll?
College students from IT, engineering, or statistics backgrounds
Working professionals in finance, marketing, or operations
Freshers looking to start a career in data analytics
Entrepreneurs wanting to leverage data for better business decisions
No prior coding experience? No problem — many programs start from scratch and gradually build your skills.
Final Thoughts
Learning Data Analytics in Noida opens up a world of opportunities. With the right training, mentorship, and hands-on practice, you can transition into roles such as Data Analyst, Business Analyst, Data Scientist, or BI Developer. The demand for data-savvy professionals continues to grow — and there's no better time than now to dive in.
#Data Analytics Training in Noida#Learn Data Analytics#Data Analytics Course Noida#Advanced Data Analytics Program#Data Analyst Career Noida
0 notes
Text
Unlocking Career Growth with Top Data Analytics Courses in Mumbai
In today's data-driven world, the demand for professionals skilled in data analysis continues to rise across industries. From finance and healthcare to e-commerce and marketing, companies are leveraging data insights to make informed decisions, optimize operations, and drive innovation. For those looking to break into this dynamic field or enhance their analytical capabilities, Data analytics courses in Mumbai offer an excellent pathway to gain relevant skills and hands-on experience.
Mumbai, known as the financial capital of India, is also becoming a hub for tech-driven education. A variety of institutes in the city offer comprehensive data analytics programs tailored to different skill levels. Whether you are a beginner or a working professional aiming to upskill, these courses cover critical areas such as data visualization, statistical analysis, machine learning, and programming languages like Python and R. Participants are not only trained in theoretical concepts but also get the opportunity to work on real-time industry projects, which enhances practical knowledge and job readiness.
What sets Mumbai apart is its thriving business ecosystem, giving students access to networking opportunities, internships, and job placements with leading organizations. Many of these courses are designed in collaboration with industry experts, ensuring that the curriculum remains aligned with current market needs. Flexible learning formats, including weekend and online classes, further enable learners to pursue education without interrupting their professional lives.
Another advantage of choosing Mumbai is the affordability of education without compromising on quality. Compared to international programs, the courses here are budget-friendly yet competitive, making them accessible to a broader audience. With experienced faculty, modern training infrastructure, and a focus on applied learning, these courses are ideal for aspiring data professionals.
While Mumbai leads in accessibility and industry integration, learners can also explore Data analytics courses in Pune, which offer similar benefits in a slightly quieter, tech-oriented environment. Pune has emerged as a growing educational and IT hub, making it another great option for pursuing analytics training.
0 notes
Text
How to Switch From a Non-Tech Background to Data Science: A Step-by-Step Guide
Data science is one of the most exciting and rapidly evolving fields today. With businesses relying heavily on data to drive decisions, professionals who can extract insights from complex datasets are in high demand. If you come from a non-tech background, the thought of transitioning into this realm might feel daunting, but it’s achievable!
Imagine being able to tell compelling stories with numbers, help organizations make informed choices, or even predict future trends. The world of data science opens doors not just for tech enthusiasts but for anyone willing to learn and adapt. This guide will walk you through how to switch gears and embark on an exhilarating career in data science—a journey that starts with understanding foundational skills and takes you through job opportunities tailored for beginners like yourself. Let’s dive in!

Understand What Data Science Is
Before diving in, it's essential to understand what data science entails and how it fits into today’s business and technology landscape. At its core, data science is about using data to derive insights and solve problems. It combines skills from statistics, computer science, and domain expertise to analyze data, build models, and support decision-making.
This doesn’t mean you need to be a math wizard or a coding prodigy. What matters most is your ability to learn and apply concepts to real-world problems.
Identify Your Transferable Skills
You might be surprised to learn that many skills from non-tech backgrounds—like communication, problem-solving, and domain knowledge—are highly valued in data science.
For example:
Marketing professionals bring customer insight and analytical thinking.
Finance experts understand data-driven decision-making.
Educators often excel in structured thinking and clear communication.
Project managers know how to coordinate, report, and evaluate performance.
Recognizing these transferable skills can boost your confidence and help you position yourself effectively when job hunting.
Learn the Core Concepts and Tools
To succeed in data science, you need to build a foundation in key areas like statistics, programming, and data visualization. Here’s what to focus on:
Statistics and Probability Basics
Understanding the fundamentals of statistics is crucial for interpreting data and making sound decisions. Topics like distributions, correlation, regression, and hypothesis testing are essential.
Python or R Programming
Learning a programming language like Python or R will empower you to manipulate data, run analyses, and build predictive models. Python is generally recommended for beginners due to its simplicity and widespread use.
Data Manipulation and Visualization Tools
Tools like Pandas (Python library), SQL (for querying databases), and Tableau or Power BI (for data visualization) are industry standards. These tools help you clean, explore, and present data in a meaningful way.
Take Advantage of Online Courses and Resources
Numerous free and paid resources are available specifically for beginners from non-tech fields. Here are a few reputable platforms to consider:
Coursera – Great for structured courses from top universities.
edX – Offers both free and certificate programs.
DataCamp – Interactive coding tutorials tailored to data science.
Kaggle Learn – Free micro-courses and datasets for hands-on practice.
Start small. Begin with introductory courses and gradually move to more complex topics.
5. Build Real Projects to Apply What You Learn
Hands-on projects are the fastest way to cement your learning and showcase your abilities to future employers. Try these ideas:
Analyze a dataset from Kaggle or a public data repository.
Build a dashboard showing business metrics.
Predict outcomes (e.g., sales, customer churn) using regression models.
Choose projects related to your background to highlight your domain knowledge and show how it translates into data insights.
Network and Connect With the Data Science Community
Engaging with the data science community through meetups, forums, and social media can accelerate your growth and open doors. Join:
LinkedIn groups related to data science
Reddit communities like r/datascience
Local data science meetups or online events
Hackathons and datathons to practice collaboratively
Connecting with others can lead to mentorship, feedback, and job opportunities.
8. Prepare for the Job Market
With your skills and portfolio in place, it's time to start tailoring your resume, practicing interviews, and applying for roles. Focus on:
Entry-level positions like data analyst, junior data scientist, or business intelligence analyst
Keywords in job descriptions (use them in your resume)
Storytelling during interviews—explain your career change, projects, and learning journey confidently
Practice with mock interviews and behavioral questions to build your comfort level.
9. Consider Further Education or Certifications
While not always required, a structured program or certification can provide credibility and fill in knowledge gaps. Look into:
Google Data Analytics Certificate (Coursera)
IBM Data Science Professional Certificate (Coursera)
Harvard’s Data Science MicroMasters (edX)
Certifications can help bridge the gap, especially if you lack a technical degree.
10. Stay Consistent and Keep Learning
The field of data science evolves rapidly, so continuous learning and curiosity are key to long-term success. Subscribe to newsletters, follow industry blogs, and experiment with new tools and techniques.
Treat learning like a habit, not a phase.
Final Thoughts
Breaking into data science from a non-tech background is challenging, but with perseverance, strategic learning, and confidence, it's a realistic and rewarding career move. Leverage your unique strengths, stay consistent, and remember—everyone starts somewhere.
Your past doesn’t define your potential in data science. You do.
#CareerSwitch#DataScienceJourney#NonTechToTech#CareerChange#DataScienceForBeginners#Upskill#LearnDataScience#Reskill#BreakingIntoTech#TransitionToDataScience#DataScienceGuide#TechCareerChange#DataScienceLearningPath#DataScienceTips#SwitchToTech
0 notes
Text
Navigating Challenges in R Programming Homework: A Comprehensive Guide for Students
When it comes to mastering R programming, students often find themselves facing numerous challenges in completing their homework assignments. In this comprehensive guide, we'll explore the common obstacles students encounter and provide practical tips to overcome them. Whether you're a beginner or an experienced R programmer, this handbook aims to be your go-to resource for navigating the complexities of R homework.
Understanding the Importance of R Homework
Before delving into the challenges, let's establish why R homework is crucial for students pursuing statistics or data science courses. R programming is widely used in these fields for data analysis, visualization, and statistical modeling. Completing R homework assignments not only reinforces theoretical knowledge but also hones practical skills, preparing students for real-world applications.
Challenges Faced by Students
Complexity of R Syntax Overcoming the Syntax Maze The intricacies of R syntax can be overwhelming, especially for beginners. To overcome this challenge, consider breaking down your code into smaller segments, focusing on one concept at a time. Utilize online resources and seek assistance from R programming communities to enhance your understanding of syntax rules.
Data Handling and Manipulation Mastering Data Manipulation Effective data handling is a fundamental aspect of R programming. Practice with real-world datasets and explore functions like dplyr and tidyr to enhance your data manipulation skills. Online platforms and tutorials can provide hands-on exercises to reinforce these concepts.
Debugging and Error Resolution Navigating the Debugging Terrain Encountering errors in your R code is inevitable, but learning how to debug efficiently is key. Utilize debugging tools, such as the traceback function, and carefully review error messages. Online forums and communities can be valuable resources for seeking guidance on specific error resolutions.
Time Management Balancing Act: Homework vs. Other Commitments Many students struggle with time management when it comes to R homework. Create a schedule, allocate dedicated time slots for homework, and break down tasks into manageable chunks. Prioritize assignments based on deadlines and complexity, allowing for a more structured and efficient approach.
Seeking External Support
Relying on Professional Assistance Exploring R Homework Help Services For students facing persistent challenges, seeking professional help is a viable option. Websites like StatisticsHomeworkHelper.com offer specialized R homework help services, ensuring personalized assistance and timely completion of assignments. These services can provide valuable insights and guidance, complementing your learning journey.
Conclusion
In conclusion, overcoming obstacles in completing R homework requires a strategic approach, persistence, and access to the right resources. By understanding the challenges associated with R programming, implementing effective learning strategies, and leveraging external support when needed, students can navigate the complexities of R homework successfully. Remember, mastering R programming is a gradual process, and each obstacle conquered is a step closer to becoming a proficient R programmer.
Frequently Asked Questions
Q1: Is it common for students to struggle with R homework? A1: Yes, it's common for students to face challenges in R homework, especially due to the complexity of syntax, data manipulation, and debugging. Q2: How can I improve my time management for R homework? A2: To improve time management, create a schedule, allocate dedicated time slots, and prioritize assignments based on deadlines and complexity. Q3: When should I consider seeking professional R homework help? A3: If you're facing persistent challenges and need personalized assistance, consider seeking professional help from reliable services like StatisticsHomeworkHelper.com.
By addressing the challenges associated with R homework and providing practical solutions, this handbook aims to empower students to tackle their assignments with confidence. Whether you're a beginner or an advanced R programmer, the key lies in persistence, strategic learning, and utilizing available resources to overcome obstacles successfully.
10 notes
·
View notes
Text
From Math to Machine Learning: A Comprehensive Blueprint for Aspiring Data Scientists
The realm of data science is vast and dynamic, offering a plethora of opportunities for those willing to dive into the world of numbers, algorithms, and insights. If you're new to data science and unsure where to start, fear not! This step-by-step guide will navigate you through the foundational concepts and essential skills to kickstart your journey in this exciting field. Choosing the Best Data Science Institute can further accelerate your journey into this thriving industry.

1. Establish a Strong Foundation in Mathematics and Statistics
Before delving into the specifics of data science, ensure you have a robust foundation in mathematics and statistics. Brush up on concepts like algebra, calculus, probability, and statistical inference. Online platforms such as Khan Academy and Coursera offer excellent resources for reinforcing these fundamental skills.
2. Learn Programming Languages
Data science is synonymous with coding. Choose a programming language – Python and R are popular choices – and become proficient in it. Platforms like Codecademy, DataCamp, and W3Schools provide interactive courses to help you get started on your coding journey.
3. Grasp the Basics of Data Manipulation and Analysis
Understanding how to work with data is at the core of data science. Familiarize yourself with libraries like Pandas in Python or data frames in R. Learn about data structures, and explore techniques for cleaning and preprocessing data. Utilize real-world datasets from platforms like Kaggle for hands-on practice.
4. Dive into Data Visualization
Data visualization is a powerful tool for conveying insights. Learn how to create compelling visualizations using tools like Matplotlib and Seaborn in Python, or ggplot2 in R. Effectively communicating data findings is a crucial aspect of a data scientist's role.
5. Explore Machine Learning Fundamentals
Begin your journey into machine learning by understanding the basics. Grasp concepts like supervised and unsupervised learning, classification, regression, and key algorithms such as linear regression and decision trees. Platforms like scikit-learn in Python offer practical, hands-on experience.
6. Delve into Big Data Technologies
As data scales, so does the need for technologies that can handle large datasets. Familiarize yourself with big data technologies, particularly Apache Hadoop and Apache Spark. Platforms like Cloudera and Databricks provide tutorials suitable for beginners.
7. Enroll in Online Courses and Specializations
Structured learning paths are invaluable for beginners. Enroll in online courses and specializations tailored for data science novices. Platforms like Coursera ("Data Science and Machine Learning Bootcamp with R/Python") and edX ("Introduction to Data Science") offer comprehensive learning opportunities.
8. Build Practical Projects
Apply your newfound knowledge by working on practical projects. Analyze datasets, implement machine learning models, and solve real-world problems. Platforms like Kaggle provide a collaborative space for participating in data science competitions and showcasing your skills to the community.
9. Join Data Science Communities
Engaging with the data science community is a key aspect of your learning journey. Participate in discussions on platforms like Stack Overflow, explore communities on Reddit (r/datascience), and connect with professionals on LinkedIn. Networking can provide valuable insights and support.
10. Continuous Learning and Specialization
Data science is a field that evolves rapidly. Embrace continuous learning and explore specialized areas based on your interests. Dive into natural language processing, computer vision, or reinforcement learning as you progress and discover your passion within the broader data science landscape.
Remember, your journey in data science is a continuous process of learning, application, and growth. Seek guidance from online forums, contribute to discussions, and build a portfolio that showcases your projects. Choosing the best Data Science Courses in Chennai is a crucial step in acquiring the necessary expertise for a successful career in the evolving landscape of data science. With dedication and a systematic approach, you'll find yourself progressing steadily in the fascinating world of data science. Good luck on your journey!
3 notes
·
View notes
Text
Data Science Demystified: Your Guide to a Career in Analytics After Computer Training

For the technology era, data lives everywhere-from your daily social media scroll to intricate financial transactions. Raw data is just numbers and alphabets; Data Science works behind the scenes to transform it into actionable insight that leads to business decisions, technological advances, or even social changes. If you've finished your computer training and want to undertake a career that offers challenges alongside rewards, then the data-science-and-analytics lane would be just perfect for you.
At TCCI- Tririd Computer Coaching Institute, we have seen the rise of data skills. Our computer classes in Ahmedabad build the foundation; our Data Science course in Ahmedabad is then taught to take students from beginner-level computer knowledge to an extremely high-demand career in analytics.
So what is data science? And how could you start your awesome journey? Time to demystify!
What is Data Science, Really?
Imagine a wide ocean of information. The Data Scientist is a skilled navigator using a mixture of statistics, programming, and domain knowledge to:
Collect and Clean Data: Gather information from various sources and prepare it for its analysis (sometimes preparing data takes as much as 80% of the actual work!).
Analyze: Use statistical methods and machine learning algorithms to find common patterns, occurrences, and co-relations.
Interpret Results: Translate very complex results into understandable insights for business purposes.
Communicate: Tell a story with data through visualization, giving decision-makers the information they need to confidently take action.
It is the multidisciplinary field comprising computer science, engineering, mathematics, and business know-how.
Key Skills You'll Need for a Career in Data Analytics
Your computer training is, to begin with, a wonderful advantage. Let's analyze the specific set of skills you will develop on this foundation:
1. Programming (Python & R):
Python: The principal language used by data scientists, with its rich ecosystem of libraries (like Pandas, NumPy, Scikit-learn, TensorFlow, Keras) used for tasks involving data wrangling, data analysis, and machine-learning researchers.
R: Favorited among statisticians for strong statistical modeling and fine capabilities in data visualization.
This is where your basic programming from computer classes will come into good use.
2. Statistics and Mathematics:
Things like defining and understanding probability, hypothesis testing, regression, and statistical modeling are what permit you to get to an interpretation of the data.
It's here that the analytical thinking learned in your computer training course will be useful.
3. Database Management (SQL):
Structured Query Language (SQL) is the language you will use to query and manipulate data stored in relational databases to extract relevant data for analysis.
4. Machine Learning Fundamentals:
Understanding algorithms such as linear regression, decision trees, clustering, and neural networks in order to develop predictive models and search for patterns.
5. Visualization of Data:
Using tools such as Matplotlib and Seaborn in Python; ggplot2 in R; Tableau; or Power BI for building compelling charts and graphs that convey complex insights in straightforward terms.
6. Domain Knowledge & Business Acumen:
One must understand the domain or business context in question to be able to ask the right questions and interpret data meaningfully.
7. Communication & Problem Solving:
The capability of communicating complex technical findings to non-technical stakeholders is paramount. Data scientists are basically storytellers with data.
Your Journey: From Computer Training to Data Science Success
If you've completed foundational computer training, then you've already taken a first step! You might have:
Logical thinking and problem-solving skills.
Some knowledge of the programming basics.
Some knowledge of the operating systems or software.
A Data Science course will then build on this knowledge by introducing you to statistical concepts, advanced programming for data, machine learning algorithms, and visualization tools.
Promising Career Paths in Data Science & Analytics
A career in data science isn't monolithic. Here are some roles you could pursue:
Data Scientist: The all-rounder, involved in the entire data lifecycle from collection to insight.
Data Analyst: Focuses on interpreting existing data to answer specific business questions.
Machine Learning Engineer: Specializes in building and deploying machine learning models.
Business Intelligence (BI) Developer: Creates dashboards and reports to help businesses monitor performance.
Big Data Engineer: Builds and maintains the large-scale data infrastructures.
Why TCCI is Your Ideal Partner for a Data Science Course in Ahmedabad
The Data Science course at TCCI, for data professionals aspiring to grow in Ahmedabad, follows a very comprehensive and industry-relevant syllabus for maximum real-world impact.
Expert Faculty: Instructors who have had extensive real-time experience in the data science and analytics environment themselves conduct classes.
Hands-On Projects: Building portfolios with a sprinkle of practice exercises and real-world case studies is in the curriculum.
Industry-Relevant Tools: Be it Python, R, or SQL along with other trending tools for data visualization.
Career Guidance & Placement Support: Career counseling and placement assistance will be an end-to-end process whereby the trainee will be positioned in their dream job.
Data Science Course in Ahmedabad with a Difference-Fresh Updates to the Curriculum All the Time- Most Relevant and In-Demand Skills for Earning.
Data Science is one booming thing, opening myriad possibilities to whoever possesses the requisite skill set. Right here in Ahmedabad is where your journey of new data specialists begins.
Ready to transform your computer skills into a rewarding career in Data Science?
Contact us
Location: Bopal & Iskcon-Ambli in Ahmedabad, Gujarat
Call now on +91 9825618292
Visit Our Website: http://tccicomputercoaching.com/
#DataScience#DataAnalytics#CareerInTech#AhmedabadTech#TCCIDataScience#LearnDataScience#FutureReady#ComputerTraining#TCCI
0 notes