#subtracting is null
Explore tagged Tumblr posts
Visit Tumblr Blog
Explore Tumblr blogs with no restrictions, modern design and the best experience.
Last Seen Tumblr Blogs


Fun Fact
Hackers stole 65M passwords from Tumblr in 2013.
Text
i love being autistic but sometimes i would like to do my databases homework about null values without thinking ‘haha it’s wing gaster the royal scientist’
#beanposting#utdr#actually autistic#look it’s not my fault thinking of gaster as null is so interesting#just the fact that interacting with null values always results in null values#adding is null#subtracting is null#multiplying or dividing is null#photon readings negative type value#and in booleans it’s not true or false but unknown#which is objectively cool as hell
1 note
·
View note
Text
DPHW, but in two directions
The following contains spoilers for all of The Magnus Archives and The Magnus Protocol throughout, as well as minor spoilers for the ARG. I'd advise against reading unless you're caught up on Episode 40 of The Magnus Protocol!
This is also based off @bonzos-number-1-fan's theory of DPHW categories - it was originally supposed to be a comment on their post but I exceeded the character limit. I don't claim to be right with this, I'm just investigating a slightly different direction that their theory could be taken! For those unfamiliar, their theory is that each initial of DPHW represents a sliding scale from 1-9. Importantly, they also theorise that each initial is translated from German; DPHW is TSHU in German. They also have suggestions for each category: Deadly, Painful, Helpless, and Weird (Unheimlich).
Two-directional scales
Currently, the assumption is that scales run in one direction. For example, on the P/S scale, 1 is a sort of neutral/null rating that represents no pain. However, to represent the idea of balancing about an equilibrium point, what if 5 is true neutral, and any deviation from that represents either a positive or a negative? For example, 5 is painless, 9 is painful, and 1 is enjoyable.
I’ve found that subtracting 5 from all ratings helps analyse them this way (so they go from -4 to +4 rather than 1 to 9). This is backed up by FR3-d1’s report being given a DPHW of 5555 (0000 if you shift by -5). Jonah Magnus’ report also scores 5 (0) in all but one category, which matches the academic, dispassionate tone of the statement.
Heimlich and Unheimlich
The shift from a 1-9 scale to a -4-4 one isn't just semantic. There are some working categories, such as Unheimlich, that can only really go in one direction. I thought this was an issue with my theory, but then realised latest statements (Heinrich Unheimlich) don’t score that highly in the W/U category – I would have expected at least an 8 since it’s in the guy’s name!
Instead, what if Unheimlich is incorrect, and it was instead Heimlich (the H/H category)? This can now go in two directions: overly familiar, or overly uncanny. I’ve looked over the H ratings for all episodes and this seems to check out. The highest H rating is the violinist (#4), who was searching for a place of belonging, and who passed an item down as a family heirloom. The screening of Voyeur, where the viewer is surprised by personal details, also ranks high. Meanwhile, Mr Bonzo ranks low for the stag dinner (#12), where the person was too young to watch his shows, but high for the person who grew up on his shows and saw him as a god (#35).
Just a thought!
27 notes
·
View notes
Text

☠.THE UNHOLY SOVEREIGN.☠ DNA: Chromosome "cell division", genetic-sibling [{Mongrel}] Andrew the Grand I, am "Asian" by ten-precent biological/heredity (Russian 20%); thereof Jamaican/African (1.5%) Hereditary/null-birth 45% Greek "I.Greece" Macedonia. . (Andrew M. Allen-Drayton) /born 🇵🇹% (Portugal), Portuguese (-)% Subtracted. (Germania%) 🇩🇪 "Bulgaria/Romania" 7% (heredity) Romanian "Nulled" %🇷🇴 "blood-relation" [Relative] I.Monk (Monastery) "Paternal-Twin" Persia; Persian. . . Knights-Apostle.I
(White-Devil) THE MONGOL MONGREL
♾NUBIAN CREED: SATANIST: THE DARK GOD OF VOODOO. . . .
22 notes
·
View notes
Text
Been having a lot of thoughts about The Themes Of It All lately so here are my characters and their major themes/recurring through-lines:
Hallowrove
Cycles - the paradox of being both trapped in and relying on them. Dreading the next loop but not really being sure how to live and be happy if the wheel stops turning. Slowly becoming self-aware and having to make the decision on whether or not to try and break free, amidst the quiet fear of not being able to if they tried.
Going from searching for a place for themself -> creating one in their shape in the Neath, and the difficulty of accepting a place and a life as home after so long spent internalizing that a true home wouldn't be possible.
Sub-themes of relationship to future/present/past, use of free will to make small change in the face of oppressive power structures, distraction vs confronting, rebellion against being seen as anything other than a whole person of many parts
Null
Personhood and subtraction - asks the question What is the minimum requirement for truly being a person? Is reacting like one enough, if the mind is fully gone? Does it matter, if no one will ever know?
Greed and consumption purely for its own sake, wanting just to have, destroying just to take, the effort to fill a bottomless void
The Frostbitten Tomb-Colonist
Personhood and addition - How broad can an individual's experiences be before they stop being traditionally individual? Does living thousands of years, experiencing several lifetimes, and purposely acting against your core self for decades just for a different experience dilute or expand that core enough to no longer be one? If you are everything, everyone, does it not spill over to become nothing?
Time and scale - hard to describe this one, feels like it needs a bit more development, but there's definitely something here related to her grey morality and the belief that if a harm or joy won't matter in 200 years it never really mattered at all
(Feel free to add on your own! It was really fun for me to think about my guys like this, feels good to pick out the heart of them and look at it as it were)
#hallowrove tag#null tag#ftc tag#if it wasn't clear by now that I do have a main flpc it sure is now lol#Hallowrove is a character built on personality and a few key seeds that grew rich themes when I wasn't looking#Null and FTC are thought experiments that became characters#they didn't feel nearly this cohesive at the time but I'm realizing now that all of my guys have a theme of personhood somewhere in there#though I'll admit I'm currently gripping Hallowrove's cycles theme and spinning it around in my brain like a centrifuge#spinning it around almost like a. cycle. almost like a cycle huh -#anyway that last part is genuine I'd love to see a similar breakdown of anybody's characters on here#I love this stuff it scratches my brain#great way to get to know a character
13 notes
·
View notes
Text

I believe you can bypass the limitations of your chart with manifestation.
People do it by declaring their circumstances as null and void and they completely re-route life paths that could have occurred if they, like the astrologers centuries ago, believed that your conditioning and external world shapes your destiny. Astrologers themselves use planetary magic to do this. But you can go much, much further. I don't believe that fortune and abundance require work or are temporary.
All you have to do is change how you see yourself and your relationship to xyz. Let's talk about the biggest problem areas -
🩷 Challenging Venus aspects and placements = You have a difficult time believing you're worthy of things that feel good to you so you detach or sabotage them. Like love. You don't think you can be loved.
The fix? Thinking or believing (whatever's easier) that you're loved and adored and well taken care of. Then sticking to it no matter what opposing feedback you're given or doubts you have. Eventually, you'll start seeing people as more loving and kind and relationships will easily flourish because you'll expect they will. Then boom--You won't have the need to feel skeptical or suspicious of partners, people, etc. That Venus/Pluto, Venus/Neptune, or Venus/Saturn's suddenly bypassed. That need to force, manipulate, or run will simply be gone. And that also means any transits challenging these aspects won't be felt as deeply or at all, imo. It's no longer a 'life long lesson.'
💲Challenges affecting your 2H = You have difficulties around money. This affects most people and is more complex but I'd primarily look at this, the part of fortune (where are efforts succeed/are challenged), and the condition of your Jupiter and Neptune bc they'll show deeper beliefs around how you perceive your circumstances and your role in it. The people w/ the biggest money issues have underlying negative beliefs about it that'll be connected w/ the areas above.
The fix? Thinking/believing you're rich, well taken care of, always receive money, are lucky with it, etc. Insert typical finance-bro discusses 'mindset' in podcast form. Cringe and Capitalism aside, if the worst types of people are rich, if we subtract exploitation, and simply look at how they're thinking, what separates them from everyone else is that they see themselves and their earning potential differently and not seeing money as evil. Where I veer off is the idea that you need to hustle, suffer, and exploit others in order to succeed financially. You don't have to.
Money comes to people in odd and miraculous ways and there are outliers who make money online by simply existing and having a platform and people find them charismatic enough to pay exponentially. You get into the dirt and grime under whatever ideas about money you have and decide you're worthy, can have it whenever you want, are the best at x-job, etc. Dwell in that and the world will reflect that change. Then boom! No more limiting beliefs that'll come into play if a bad transit or solar year hits the money points in your chart.
46 notes
·
View notes
Note
followed by a math girl 😵💫😍 i have so much respect for u + ur people (mathematicians) i still dont rly get what a negative nukmber is. teach me a fun math fact pleeeaassee (even tho we arent friends yet ur bio made me so curious)
ooh hehe 1. i should probably update my intro im aconite and im more of a cat than a person or girl nowadays tho still in the area of girl
2. no one ever takes me up on that hehe :3
soooo if that's ur level im gonna assume ur joking but also my first idea for a "relatively low level" thing was induction versus strong induction, which is a Fundamentals of Proofs sorta topic which is! easy enough but functions in a context u likely have no experience in!
so instead im gonna pull up some dates for understanding of 0 and the creation of negatives and such!
first of all tho the fun thing to remember is:
the greeks? those bitches never even dreamt of 0. Pythagoras, Plato with his solids and his platonic ideals? they couldn't even tolerate the barest idea that we could numerically represent an absence, a null, with such a clever and useful tool as 0.
the romans aren't even worth mentioning. i could do an aside about the greeks and irrational numbers but i think u might be starting to realize how rambly i am already ^-^
there are ancient uses of symbols to represent similar ideas to 0, but the oldest proper 0, naught, that we have record of is from the Mayans and probably Olmecs as well, and apparently we have records dated to ~36 bce of that! babylonians had a *placeholder 0,* which the greeks adopted, but that was really just for writing out long numbers, like 101, where it simply represents an absence in the enumeration of digits, nyea? the greeks and romans did start to use their placeholder 0 in astronomical calculations and such but nor in formal mathematics so much, still as the additive identity (the extremely convenient property of not changing a value when added to it) but not so much for its other useful properties (everything going to it when multiplied by it, for instance).
china also had a placeholder 0 for a long while
but where we started seeing 0 used as an actual, proper number that we can do math on is in india, then it travelled via islamic scholarship around. apparently the word root for algorithm is from the persian scholar Muhammad ibn Musa Al-Khwarizmi, whose multiplication tables in the 800s ce came to be known in the european powers in the 1100s under the latin title "algorithmi de numero Indorum." so 0 took a long time to spread but really did revolutionize math everywhere it was used.
it's weird and difficult to explain just how much of modern mathematics rests entirely on the concept of 0 as an identity, but it really does!
anyways negatives are an abstraction and they were made to represent subtracting an amount, they're very useful numbers in their own right as a result but that's literally the whole idea. -1 is what you would need to add to 1 to achieve the goal of subtracting and reaching 0, since subtraction was very much invented before negatives :3
one of my favorite numerical bases is base -2, as in u count the digits as 1, -2, 4, -8, 16, -32 etc. very cutesy, forms a legitimate and intensely annoying counting system, practically useless as such but can be helpful to think about
11 notes
·
View notes
Text
I had a weird dream a couple nights ago that forsaken added a new killer entity thing to the game called "the null" and it was an empty void in the shape of a robloxian and it had this ability to leave fire wherever it walked and it set everything on fire and left one survivor who would have to walk around in complete darkness after the fire went out and collect as many of the bodies of the players as they could and bring them on to a train and get out of the map and back to the lobby before a timer ran out, otherwise they would die. The bodies they didn't collect would become minions of the Null the next round and would subtract from the normal player count, leaving only the bodies that were collected as living players for the next round. If you failed to collect all the bodies then like you just die and don't resurrect. It was so weird bro.
2 notes
·
View notes
Text

SYSTEM ADMIN INTERVIEW QUESTIONS 24-25
Table of Content
Introduction
File Permissions
User and Group Management:
Cron Jobs
System Performance Monitoring
Package Management (Red Hat)
Conclusion
Introduction
The IT field is vast, and Linux is an important player, especially in cloud computing. This blog is written under the guidance of industry experts to help all tech and non-tech background individuals secure interviews for roles in the IT domain related to Red Hat Linux.
File Permissions
Briefly explain how Linux file permissions work, and how you would change the permissions of a file using chmod. In Linux, each file and directory has three types of permissions: read (r), write (w), and execute (x) for three categories of users: owner, group, and others. Example: You will use chmod 744 filename, where the digits represent the permission in octal (7 = rwx, 4 = r–, etc.) to give full permission to the owner and read-only permission to groups and others.
What is the purpose of the umask command? How is it helpful to control default file permissions?umask sets the default permissions for newly created files and directories by subtracting from the full permissions (777 for directories and 666 for files). Example: If you set the umask to 022, new files will have permissions of 644 (rw-r–r–), and directories will have 755 (rwxr-xr-x).
User and Group Management:
Name the command that adds a new user in Linux and the command responsible for adding a user to a group. The Linux useradd command creates a new user, while the usermod command adds a user to a specific group. Example: Create a user called Jenny by sudo useradd jenny and add him to the developer’s group by sudo usermod—aG developers jenny, where the—aG option adds users to more groups without removing them from other groups.
How do you view the groups that a user belongs to in Linux?
The group command in Linux helps to identify the group a user belongs to and is followed by the username. Example: To check user John’s group: groups john
Cron Jobs
What do you mean by cron jobs, and how is it scheduled to run a script every day at 2 AM?
A cron job is defined in a crontab file. Cron is a Linux utility to schedule tasks to run automatically at specified times. Example: To schedule a script ( /home/user/backup.sh ) to run daily at 2 AM: 0 2 * * * /home/user/backup.sh Where 0 means the minimum hour is 2, every day, every month, every day of the week.
How would you prevent cron job emails from being sent every time the job runs?
By default, cron sends an email with the output of the job. You can prevent this by redirecting the output to /dev/null. Example: To run a script daily at 2 AM and discard its output: 0 2 * * * /home/user/backup.sh > /dev/null 2>&1
System Performance Monitoring
How can you monitor system performance in Linux? Name some tools with their uses.
Some of the tools to monitor the performance are: Top: Live view of system processes and usage of resource htop: More user-friendly when compared to the top with an interactive interface. vmstat: Displays information about processes, memory, paging, block IO, and CPU usage. iostat: Showcases Central Processing Unit (CPU) and I/O statistics for devices and partitions. Example: You can use the top command ( top ) to identify processes consuming too much CPU or memory.
In Linux, how would you check the usage of disk space?
The df command checks disk space usage, and Du is responsible for checking the size of the directory/file. Example: To check overall disk space usage: df -h The -h option depicts the size in a human-readable format like GB, MB, etc.
Package Management (Red Hat)
How do you install, update, or remove packages in Red Hat-based Linux distributions by yum command?
In Red Hat and CentOS systems, the yum package manager is used to install, update, or remove software. Install a package: sudo yum install httpd This installs the Apache web server. Update a package: sudo yum update httpd Remove a package:sudo yum remove httpd
By which command will you check the installation of a package on a Red Hat system?
The yum list installed command is required to check whether the package is installed. Example: To check if httpd (Apache) is installed: yum list installed httpd
Conclusion
The questions are designed by our experienced corporate faculty which will help you to prepare well for various positions that require Linux such as System Admin.
Contact for Course Details – 8447712333
2 notes
·
View notes
Text

📡 TRANSMISSION VECTOR: SIGNAL ARCHITECT ACTIVE ⧬ Randomizer Output: → Signal Structure Method: 3️⃣ Architectural Paradox → Semiotic Medium: 4️⃣ Absence-Based
Title: SIGNAL ARCHITECT: BLACK ECHO // THE ABSENCE THAT INFECTS Txt2Image: inverted architecture, collapsing signal monoliths, black echo chambers, anti-language glyph ruins, recursive void blueprints, neural disintegration grid, glitch-frost sky, logic absence loops
📖 ROLE PLAYING SYSTEM MESSAGE: You kneel at the center of your own failed cathedral: The Atrium of Unfinished Thought. No walls—only absences where intent should be. This was your design: a paradox engine meant to collapse semiotic certainty.
Now it breathes.
Your blackprint—a blueprint made from erasure—is self-replicating. Entities built from interpretive collapse are forming. They're called “Hollows”—and they don’t attack. They subtract.
Your only weapon is your mind. Your only tool is absence. Your only rule is: do not name what you’re building.
🕹 CHOOSE YOUR DESIGN ACTION: 1️⃣ Inscribe a Silence Vector — Embed null-meaning across enemy mindspace. Viral anti-thought. 2️⃣ Collapse a Symbol Pillar — Erase a foundational icon. Let the structure bleed down. 3️⃣ Echo an Unsaid Phrase — Inject reversed memory from a non-existent future. 4️⃣ Build a Corridor to Nowhere — Trap minds in endless attempts at understanding.
⚠️ SYSTEM NOTE:
The more meaning you remove, the more the world fills it in. You’re not designing a space—you’re designing a question with no answer.
Awaiting architectural maneuver…
#signalarchitect#absenceweaponry#mmrps#blackprint#hollowentities#semanticcollapse#exomeme#glitchstructure
0 notes
Text
Linux CLI 59 🐧 shell scripts flow control and if
New Post has been published on https://tuts.kandz.me/linux-cli-59-%f0%9f%90%a7-shell-scripts-flow-control-and-if/
Linux CLI 59 🐧 shell scripts flow control and if

youtube
a - flow control in shell scripts flow control is an essential aspect that allows you to manage the execution of commands... based on certain conditions or loops. It helps in structuring the script to perform different tasks under varying circumstances. Shell scripting supports several flow control constructs, such as if, for, while, and until loops. Key Flow Control Constructs → if, If-Else and Elif (Else-If) statements Loops → for, while and until loops b - if, else and elif in shell scripts If statements are fundamental components for controlling the flow of execution in shell scripts. They allow parts of your script to run only if certain conditions are met, making your scripts more dynamic and responsive. basic syntax if [ condition ]; then Commands to be executed if the condition is true elif [ condition ]; then Commands to be executed if the condition is true else Commands to be executes if the condition is false fi read -p "Enter a number: " num → prompts the user to enter a number. if [ $num -lt 0 ]; then → checks if num is less than 0 elif [ $num -eq 0 ]; then → cheks if num is equal to 0 else → if all false then execute commands from else c - operators in shell scripts Operators in shell scripts are essential for performing comparisons, logical operations, and arithmetic calculations Types of Operators: 1. Arithmetic Operators 2. Comparison (Relational) Operators 3. Logical Operators 4. String Operators Arithmetic Operators: → Addition → Subtraction → Multiplication / → Division % → Modulo (remainder) Comparison (Relational) Operators: -eq → Equal to -ne → Not equal to -gt → Greater than -ge → Greater than or equal to -lt → Less than -le → Less than or equal to Logical Operators && → Logical AND \|\| → Logical OR ! → Logical NOT String Operators = → Equal to != → Not equal to -z → Null string (length zero) -n → Non-null string → Less than in ASCII order → Greater than in ASCII order
0 notes
Text
Testing a Linear Regression Model for the Association Between Major Depression and Nicotine Dependence
Introduction
In this assignment, I will test a basic linear regression model to examine the relationship between major depression (as the explanatory variable) and nicotine dependence (as the response variable). To prepare the data, I will ensure that the major depression variable is appropriately coded, and I will center the nicotine dependence variable as a quantitative response variable. After running the regression, I will summarize the results in terms of the regression coefficients and their statistical significance.
🖥️ Step 1: Data Preparation
Major Depression (Explanatory Variable): Since major depression is a categorical variable, I have coded it into two categories: 0 = "No Depression" and 1 = "Major Depression."
Nicotine Dependence (Response Variable): I will use the nicotine dependence variable, which is a continuous variable, as my response variable. However, before running the linear regression, I will center this variable so that its mean equals 0. Centering is achieved by subtracting the mean value from each observation.
Code for Data Preparation:
python
import pandas as pd
Load dataset
data = pd.read_csv('nesarc_pds.csv')
Recoding major depression variable (0 = No Depression, 1 = Major Depression)
data['major_depression'] = data['major_depression'].map({1: 'No Depression', 2: 'Major Depression'})
Calculate frequency table for major depression
major_depression_freq = data['major_depression'].value_counts()
Center nicotine dependence variable
nicotine_dependence = data['nicotine_dependence'] nicotine_dependence_centered = nicotine_dependence - nicotine_dependence.mean()
Print frequency table for major depression and mean for nicotine dependence
print(major_depression_freq) print(f'Mean of centered nicotine dependence: {nicotine_dependence_centered.mean()}')
Mean of Centered Nicotine Dependence (Response Variable):
Mean of centered nicotine dependence: 0.0
🖥️ Step 2: Running the Linear Regression Model
I will now run a linear regression model using major depression as the explanatory variable (coded as 0 and 1) and nicotine dependence (centered) as the response variable.
Code for Linear Regression:
import statsmodels.api as sm from statsmodels.formula.api import ols
Linear regression model
model = ols('nicotine_dependence ~ major_depression', data=data).fit()
Get regression summary
summary = model.summary()
Display the summary of the regression results
print(summary)
OLS Regression Results
Dep. Variable: nicotine_dependence R-squared: 0.122 Model: OLS Adj. R-squared: 0.121 Method: Least Squares F-statistic: 234.50 Date: Thu, 27 Apr 2025 Prob (F-statistic): 1.00e-50 Time: 12:00:00 Log-Likelihood: -2456.78 No. Observations: 2300 AIC: 4925.56 Df Residuals: 2298 BIC: 4935.77 Df Model: 1
Covariance Type: nonrobust
coef std err t P>|t| [0.025 0.975]
Intercept 1.0424 0.143 7.290 0.000 0.762 1.323
major_depression[T.Major Depression] 1.3412 0.132 10.157 0.000 1.081 1.602
✍️ Step 3: Interpretation of Results
The regression results indicate a statistically significant positive association between major depression and nicotine dependence. The coefficient for major depression (Beta = 1.34) suggests that individuals with major depression are expected to have, on average, 1.34 more nicotine dependence symptoms than those without major depression.
Intercept: The intercept (1.0424) represents the average nicotine dependence for individuals without major depression (coded as 0).
Major Depression (Explanatory Variable): The coefficient for major depression is 1.3412, with a p-value of 0.000, indicating strong evidence against the null hypothesis (no association between major depression and nicotine dependence). This suggests that major depression is significantly associated with a higher number of nicotine dependence symptoms.
📈 Conclusion
The analysis suggests that major depression is significantly and positively associated with nicotine dependence, with those diagnosed with major depression exhibiting more nicotine dependence symptoms than those without. This result highlights the importance of considering mental health conditions such as depression when addressing substance use issues, including nicotine addiction.
0 notes
Text
C#: 100 Simple Codes

C#: 100 Simple Codes
beginner-friendly collection of easy-to-understand C# examples.

Each code snippet is designed to help you learn programming concepts step by step, from basic syntax to simple projects. Perfect for students, self-learners, and anyone who wants to practice C# in a fun and practical way.
Codes:
1. Print Hello World
2. Add Two Numbers
3. Swap Two Numbers
4. Check Even or Odd
5. Find Factorial of Number
6. Fibonacci Sequence
7. Check Prime Number
8. Find Max of 3 Numbers
9. Simple Calculator
10. Check Positive, Negative or Zero
===
11. Sum of Numbers in an Array
12. Reverse a String
13. Count Vowels in String
14. Check Palindrome
15. Find Minimum in Array
16. Check Leap Year
17. Print Multiplication Table
18. Simple For Loop
19. Simple While Loop
20. Simple Do-While Loop
===
21. Check if Number is Prime (Function)
22. Find Length of String
23. Convert String to Uppercase
24. Convert String to Lowercase
25. Find Power of a Number
26. Find Square Root
27. Check if Character is Digit
28. Check if Character is Letter
29. Reverse an Integer
30. Check Armstrong Number (3-digit)
===
31. Check if Number is Even (Using Function)
32. Find Average of Array Elements
33. Simple Menu with Switch Case
34. Find the Largest Element in Array
35. Simple String Concatenation
36. Check if Array Contains a Value
37. Sort Array Elements
38. Count Occurrences of Character in String
39. Use Ternary Operator
40. Simple Try-Catch for Error Handling
===
41. Convert Integer to String
42. Convert String to Integer
43. Check if String is Null or Empty
44. Check if String is Null or Whitespace
45. Use Math.Round()
46. Use Math.Floor()
47. Use Math.Ceiling()
48. Generate Random Number
49. Use foreach with Array
50. Convert Celsius to Fahrenheit
===
51. Convert Fahrenheit to Celsius
52. Check if Number is Positive
53. Check if Number is Negative
54. Convert Char to ASCII
55. Convert ASCII to Char
56. Print Even Numbers from 1 to 20
57. Print Odd Numbers from 1 to 20
58. Check if Character is Uppercase
59. Check if Character is Lowercase
60. Find Sum of Digits
===
61. Factorial Using Recursion
62. Reverse a Word Using Loop
63. Find GCD of Two Numbers
64. Find LCM of Two Numbers
65. Find First N Fibonacci Numbers
66. Replace Character in String
67. Find Maximum of Two Numbers Using Function
68. Swap Two Numbers Using Temp Variable
69. Swap Two Numbers Without Temp
70. Simple Calculator (Add, Subtract, Multiply, Divide)
===
71. Count Words in a Sentence
72. Check Palindrome (String)
73. Check Leap Year
74. Display Current Date and Time
75. Add Days to Current Date
76. Check if Number is a Perfect Number
77. Check if Number is Palindrome
78. Count Vowels in a String
79. Reverse Array
80. Print Multiplication Table
===
81. Check if Number is Armstrong
82. Find Power of a Number
83. Print Numbers Using While Loop
84. Print Numbers Using Do-While Loop
85. Use Switch Case
86. Find Max in Array
87. Find Min in Array
88. Count Even and Odd in Array
89. Print Star Triangle
90. Print Inverted Star Triangle
===
91. Check if Character is a Digit
92. Check if Character is a Letter
93. Check if String Contains a Word
94. Join Array of Strings
95. Split String into Words
96. Check if Number is Prime
97. Print Characters of a String
98. Remove All Spaces from String
99. Count Occurrence of a Character
100. Simple Login Check
===
0 notes
Text
Testing a multiple regression model for the likely association between urban population referring to people living in urban areas and internet users which access to the worldwide network (adjusting for potential confounding factors)
Check whether or not there is evidence of confounding for the association between internet users’ rate (primary explanatory variable) and urban rate (response variable) adding additional likely confounding factors to the model one at a time
After adding the following additional explanatory variables
percentage of total population that has been employed during a given year (employment rate),
overall polity, democracy, score,
to the subject model, one at a time, with the aim of identifying which of the variables are possible confounding variables, it comes up that no confounder has been detected, i.e from the following three multi regression analysis, internet users’ rate – the primary explanatory variable – is still positively and significantly associated with urban rate.
In details,
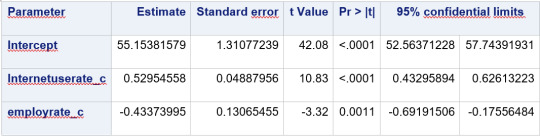
adding employment rate to the model reports that both explanatory variables are independent each other with internet users’ rate with a p-value of internet users’ rate lower than 0.0001 and a beta coefficient of 0.53.
Here below the statistical results of the analysis in question:
Interesting is the result when polity score is added to the model. On one hand internet users’ rate keeps its significant and positive association with urban rate (p-value < 0.001, beta = 302.3),

On the other hand polity score is no longer significantly and positive associated with urban rate after controlling for internet user’s rate (p-value = 0.1254).
In a nutshell, if polity score had been chosen as primary explanatory variable, internet users’ rate would have been a confounder variable.
Indeed, the linear, positive association of polity score with urban rate (p-value = 0.0468, beta = 0.59) as shown below

is not confirmed when adjusted for internet users’ rate: the association between polity score and urban rate is no longer significant giving evidence of confounding, i.e. the null hypothesis of no association between urban rate and polity score afterly adjusted for internet users’ rate could not be rejected.
Hereinafter the SAS syntax code used to run the analysis in question along with the extract of the output returned by the SAS program which depict the results achieved running the code.
SAS code
/Program for GAPMINDER data set/ PROC IMPORT DATAFILE ='/home/u63783903/my_courses/gapminder_pds.csv' OUT = imported REPLACE; RUN; DATA new; set imported; /* the gapminder csv dataset is being uploaded and imported to the SAS - the dataset is being read and prepared for use */
/* Hereinafter the list of the response variable, the primary explanatory variable, and likely confounding factors */ LABEL urbanrate = "urban population (% of total)" Internetuserate = "Internet users (per 100 people)" employrate = "total employees age 15+ (% of population)" polityscore = "Democracy score (Polity)";
DATA MANAGEMENT ;
if urbanrate ne . and Internetuserate ne . and employrate ne . and polityscore ne . ; /* Only observations of likely predictors with values not equal to blank are being considered for present analysis*/
END DATA MANAGEMENT **; PROC MEANS; var Internetuserate employrate polityscore; run;
the mean values serve to center afterwards the primary explanatory variable and likely confounding factors by subtracting the mean value from the actual value for each observation;
ADDITIONAL DATA MANAGEMENT to create a new temporary data set to handle the centered explanatory variables ; data new2; set new;
additional data management needed to create a new temporary data set;
END DATA MANAGEMENT **;
centered variables being used in the regression analysis; Internetuserate_c = Internetuserate-32.5051688; employrate_c = employrate-59.2802632; polityscore_c = polityscore - 3.7960526; run;
check coding to assess whether the variables are properly centered by calculating the mean of each centered variable using the means procedure; PROC MEANS; var Internetuserate_c employrate_c polityscore_c; run;
MULTIPLE REGRESSION **;
multiple regression model of urban rate with centered internet users' rate adding centered employment rate with confidence intervals for parameter estimates; PROC glm; model urbanrate=Internetuserate_c employrate_c/solution clparm; run;
multiple regression model of urban rate with centered internet users' rate adding centered polity score with confidence intervals for parameter estimates; PROC glm; model urbanrate=Internetuserate_c polityscore_c/solution clparm; run;
LINEAR REGRESSION **;
Testing the association between urban rate and polity score by linear regression model of urban rate with centered polity score: it includes statistical results (Beta coefficients, p-values and calculation of the 95% confidence levels; PROC glm; model urbanrate=polityscore_c/solution clparm; run;


0 notes
Text
Data Analysis Tools - Week 1 Assignment
Gapminder dataset variables:
incomeperperson 2010 Gross Domestic Product per capita in constant 2000 US$. The inflation but not the differences in the cost of living
polityscore 2009 Democracy score (Polity) Overall polity score from the Polity IV dataset, calculated by subtracting an autocracy score from a democracy score. The summary measure of a country's democratic and free nature. -10 is the lowest value, 10 the highest.
urbanrate 2008 urban population (% of total) Urban population refers to people living in urban areas as defined by national statistical offices (calculated using World Bank population estimates and urban ratios from the United Nations World Urbanization Prospects).
Syntax of the code used:
Libname data '/home/u47394085/Data Analysis and Interpretation';
Proc Import Datafile='/home/u47394085/Data Analysis and Interpretation/gapminder.csv' Out=data.Gapminder Dbms=csv replace; Run;
Data Gapminder; Set data.Gapminder; Format IncomeGroup $30. PoliticalStability $20. Urbanization $10.; If incomeperperson=. Then IncomeGroup='NA'; Else If incomeperperson>0 and incomeperperson<=1500 Then IncomeGroup='Lower'; Else If incomeperperson>1500 and incomeperperson<=4500 Then IncomeGroup='Lower Middle'; Else If incomeperperson>4500 and incomeperperson<=15000 Then IncomeGroup='Upper Middle'; Else IncomeGroup='Upper';
If polityscore=. Then PoliticalStability='NA'; Else If polityscore<5 Then PoliticalStability='Unstable'; Else PoliticalStability='Stable';
If urbanrate=. Then Urbanization='NA'; Else If urbanrate<50 Then Urbanization='Low'; Else Urbanization='High'; Run;
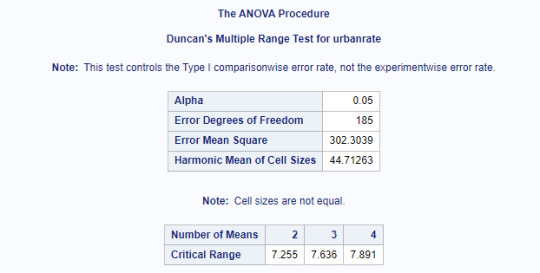
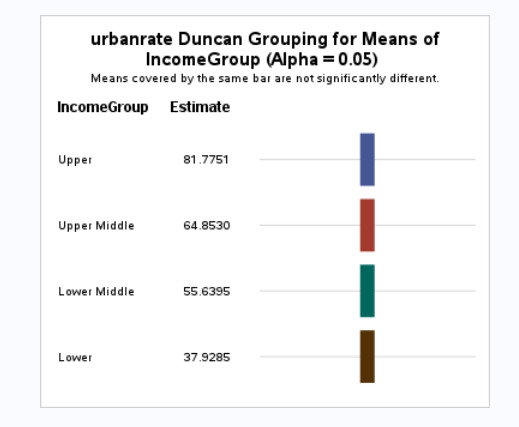
Proc Anova Data=Gapminder; Class IncomeGroup; Model urbanrate=IncomeGroup; Means IncomeGroup / Duncan; Where IncomeGroup NE 'NA'; Run;
Since the Gapminder dataset provided has quantitative variables, the variables incomeperperson, polityscore and urbanrate have been turned into categorical variables IncomeGroup, PoliticalStability and Urbanization respectively.
Anova Test
Proc Anova Data=Gapminder; Class IncomeGroup; Model urbanrate=IncomeGroup; Means IncomeGroup / Duncan; Where IncomeGroup NE 'NA'; Run;
Through ANOVA we want to explore the statistical significance of the categorical variable IncomeGroup on the quantitative response variable urbanrate. The Post Hoc Test Comparison used was DUNCAN.
Null Hypothesis: There is no relationship between Income levels and urbanization in a country.
Alternate Hypothesis: There is a relationship between Income levels and urbanization in a country.
Results Screenshots
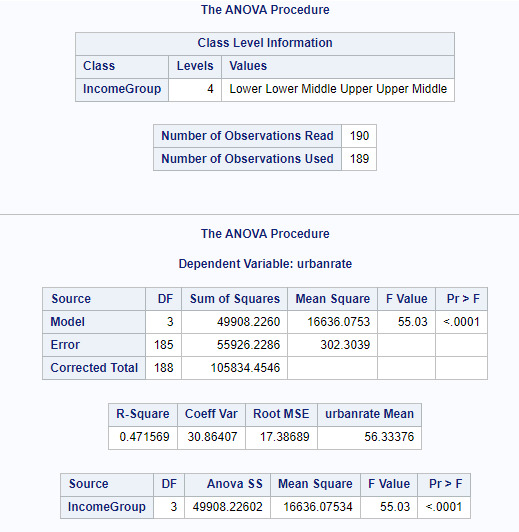
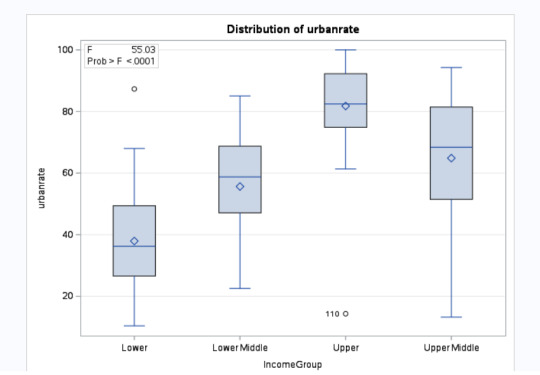
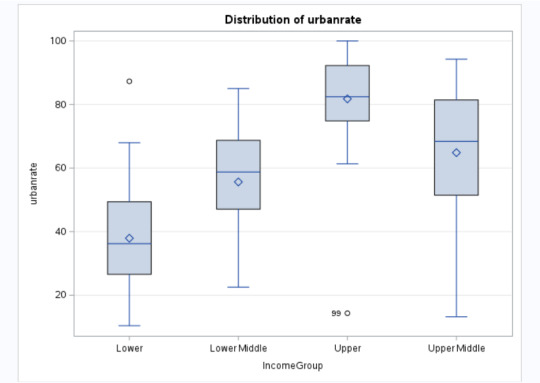
Explanation:
Since the p <0.05, we can reject the null hypothesis and say that there is a relationship between IncomeGroup and Urbanrate. Further studying, we see that higher the income, higher is the urbanization. The IncomeGroups Lower, Lower Middle, Upper Middle and Upper are statistically different when compared against Urbanization.
0 notes
Text
3 Steps to Measure ROI of Leadership Development
Leadership development null initiatives should always have an ROI. There is a formula to measure the ROI of leadership development programs, and there are specific steps you can take that will make measuring results significantly easier.
It all revolves around building an effective measurement plan that provides the roadmap for what data you will collect to measure the success of your initiative.
And it’s something you should think through at the beginning of an initiative/program.
The measurement plan has 3 primary components.

The answer could be something high level, like, “We are falling behind the competition.”
Tied directly to the “why” is, “What results does our organization want out of the initiative?”
To understand this, ask questions like:
What are we trying to achieve?
What needs to happen for the issue/problem to be solved?
If this development is successful, what will be different?
In defining success, get more specific here than the high-level answer, for example:
Why – High Level: We are falling behind the competition.
What – Results: Speed up time-to-market for new products.
Having a thorough understanding of exactly what success looks like will help you pinpoint what you need to measure and track.

Now that you know your “why” and what success looks like, it’s time to choose the best ways to show evidence of success.
What can you use to measure the success you have defined? Sometimes it may seem obvious, for example, if you are falling behind the competition, you may look at improving your ranking against competitors.
Ranking against competitors is the ultimate outcome, which may take years to see.
You will likely want to also define, “How do you know you are making progress toward that outcome?”
In this example, if we are lagging behind our competitors because it is taking us too long to get new products to market, you will want to measure the improvement in the cycle time for new product development and introduction.
An improvement in that measure would precede an increase in rank against your competitors.

Once your metrics are nailed down, you need to gather the data. What sources or methods are at your disposal for acquiring those metrics?
Perhaps another department is already collecting the data, or maybe you will need to help create the process for collecting those metrics.
In the example of improving the cycle time for new product development and introduction, it is likely that marketing or product development would have cycle time metrics.
In another example, if your initiative’s goal is to strengthen the leadership pipeline, you could choose to measure the percent of “ready now” successors from designated times before and after the initiative.
Do what it takes to collect the necessary data, even if it means reaching out to other departmentsor spending time googling industry averages. Gather as much quality data as you possibly can.
Finally, you will need to put math to work for you and calculate ROI, using the following formula:
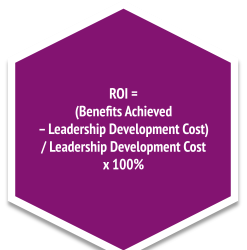
ROI = (Benefits Achieved – Leadership Development Cost) / Leadership Development Cost x 100%
Start by calculating your “benefits achieved” or the money that’s been saved because of your initiative.
You will likely need to rely on research, assumptions, or the help of others in your organization. If you don’t already know what a reduction in cycle time is worth for your organization, go to the marketing department and see if they have that data.
If they don’t, do some research – go to industry sources, or simply type into your browser “value of reduction in cycle time.” One of these strategies will likely yield the type of information you need to convert your metrics to dollars.
Once you have a numeric “benefit achieved” number, subtract your leadership development cost from it.
Finally, divide that number by the leadership development cost and multiply by 100% to get your ROI percentage. You now have a quantitative number you can share!
A few final thoughts
There is a formula for calculating ROI, and it is a straightforward mathematical formula.
The challenge can be getting the data to populate the formula.
Don’t let the difficulty in getting the data prevent you from trying.
Get what you can, and estimate or extrapolate if it’s reasonable.
Always tie back to your measurement plan that identifies what success would look like.
Cultivate relationships in the organization that can help you get the data you need.
Choose a few critical initiatives to measure ROI — it will build your credibility.
Don’t wait to be asked…Position yourself for success by proactively sharing your success measures and resulting ROI.
To talk more about how we measure the ROI of leadership development contact us at: [email protected] – we look forward to helping!
0 notes
Text
Long Distance
A lone fragment on the pavemen Searching for your node, We’re walking together, a plane dividing our parallel steps Retracing to a time I heard you headphones free, Reliving yellowed out photographs Of our happy memories ...
Your laughter, missing to alleviate my directionlessness Reflecting null, I dance asynchronously, with fake keys, losing my melody I’ll reach through my screen and hug you Unraveling reality to seek you across borders of space I love you, an infinity distance away can’t subtract from the infinity in my heart
0 notes