#treemap
Explore tagged Tumblr posts
Visit Tumblr Blog
Explore Tumblr blogs with no restrictions, modern design and the best experience.
Last Seen Tumblr Blogs


Fun Fact
The KCSC sent more than 20K requests to delete posts related to prostitution and porn to Tumblr from January to June 2017.
Text
JavaCollections: Your Data, Your Way
Master the art of data structures:
List: ArrayList, LinkedList
Set: HashSet, TreeSet
Queue: PriorityQueue, Deque
Map: HashMap, TreeMap
Pro tips:
Use generics for type safety
Choose the right collection for your needs
Leverage stream API for elegant data processing
Collections: Because arrays are so last century.
#JavaCollections: Your Data#Your Way#Master the art of data structures:#- List: ArrayList#LinkedList#- Set: HashSet#TreeSet#- Queue: PriorityQueue#Deque#- Map: HashMap#TreeMap#Pro tips:#- Use generics for type safety#- Choose the right collection for your needs#- Leverage stream API for elegant data processing#Collections: Because arrays are so last century.#JavaProgramming#DataStructures#CodingEfficiency
2 notes
·
View notes
Text
Common Pitfalls in Pie Charts: Best Practices for Effective Data Presentation
Data Visualization Types: Common Questions Answered
1. What types of data are best suited for heat maps, and how can they enhance the understanding of complex datasets?
Maps are best suited for quantitative data, such as statistics, frequency counts, or performance metrics across two dimensions (e.g., time and categories). They enhance understanding by visually representing variations in data intensity, making patterns, trends, and outliers easier to identify. This helps users quickly grasp complex relationships and insights within large datasets.
2. In what situations would you choose to use a scatter plot over a bubble chart, and what additional information does a bubble chart provide?
I would choose a scatter plot when comparing two variables without needing to represent a third dimension. A bubble chart is useful when I want to add a third variable, represented by the size of the bubbles, allowing for more complex data representation. This additional information helps to visualize relationships and the magnitude of values simultaneously.
3. Can you explain the concept of a treemap and discuss its advantages for displaying hierarchical data compared to traditional tree structures?
A treemap is a visual representation of hierarchical data using nested rectangles, where the size and color of each rectangle represent different metrics. Its advantages over traditional tree structures include better space utilization, easier comparison of sizes, and the ability to display complex data briefly, making patterns and relationships more accessible and interpretable.
4. What role do infographics play in data visualization, and how can they be effectively designed to enhance understanding and engagement with complex data sets?
Infographics simplify complex data by visually representing information, making it easier to understand and engage with. Effective design includes clear visuals, concise text, a logical flow, and a focus on key insights. Using color, icons, and charts can enhance clarity and attract attention, while ensuring accessibility helps reach a wider audience.
5. How do pie charts effectively communicate proportions, and what are some common pitfalls to avoid when using them?
Pie charts effectively communicate proportions by visually representing data as slices of a whole, making it easy to compare relative sizes. Each slice's angle corresponds to its proportion, aiding quick comprehension of parts versus the whole. Common pitfalls to avoid include using too many slices, which can clutter the chart and confuse viewers, and failing to label slices clearly, making interpretation difficult. Additionally, using similar colors for adjacent slices can create visual confusion. It's essential to limit categories and ensure clarity for effective communication of data.

Visit: VS Website See: VS Portfolio
0 notes
Photo

Die Treemap zeigt die Farbverteilung der lateinamerikanischen Flaggen in Form einer Flagge. Eine bunte Darstellung der Vielfalt der Region. Den ganzen Artikel gibt es hier: https://nordischepost.de/unterhaltung/design/bunte-vielfalt-treemap-der-farben-lateinamerikanischer-flaggen-in-flaggenform/?feed_id=74223&_unique_id=6666041d675df
#Design#bunte#der#Farben#Flagge#Flaggen#Flaggenform#lateinamerikanischeFlaggen#lateinamerikanischer#Treemap#Vielfalt
0 notes
Photo

If you're looking for a simple yet powerful way to visualize hierarchical data, a treemap in Google's Data Studio is a great option. In this step-by-step guide, we'll show you how to create and use a treemap in your Data Studio account. Step 1: Access Data Studio Start by logging into your Data Studio account. If you don't have an account, go to Cratos.ai and click "Sign up for Data Studio." Step 2: Create a New Report Once you're logged in, click "Create" in the top right-hand corner of the page. This will bring up a new report. Step 3: Add a Blank Page Click on the "Add a Page" button in the sidebar on the left-hand side of the page. Select "Blank Page" from the drop-down menu. Step 4: Create a Treemap To create a treemap, drag and drop a "Treemap" chart from the "Charts" panel in the sidebar. Choose the data source you'd like to use from the "Data" panel. Step 5: Configure Your Treemap Chart Once you've created your treemap, you can configure it to your liking. Add dimensions and metrics to the chart by dragging and dropping them into the appropriate fields in the "Data" panel. Experiment with different color schemes and chart styles by toggling the options in the "Style" panel. Step 6: Use the Treemap Now that you've created your treemap, you can use it to analyze hierarchical data. Click on different sections of the chart to drill down into the data and reveal more information. Congratulations! You've now successfully created and used a treemap in Data Studio. Remember, treemaps are a powerful tool for visualizing hierarchical data and can help you gain insights into your organization's data in new and meaningful ways. Don't forget to check out Cratos.ai for more great data visualization tools and resources! 📊💡
0 notes
Text

0 notes
Photo
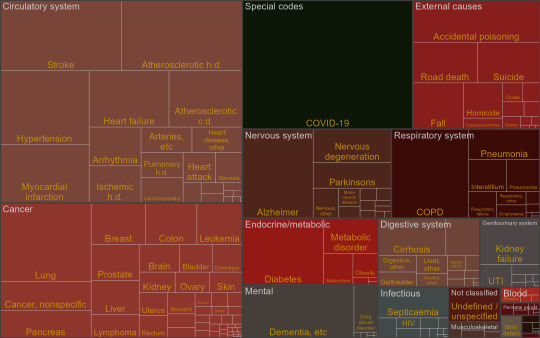
Treemap of causes of death in the US, 2021
by u/zummit
44 notes
·
View notes
Text

My dog Potato's Wisdom Panel test results, visualized as a Voronoi treemap
I'm selling these personalized with your dog's information. Check them out in my Ko-fi Shop.
4 notes
·
View notes
Text
This day in history

On September 22, I'm (virtually) presenting at the DIG Festival in Modena, Italy. On September 27, I'll be at Chevalier's Books in Los Angeles with Brian Merchant for a joint launch for my new book The Internet Con and his new book, Blood in the Machine.

#20yrsago Verisign is damage: route around it https://web.archive.org/web/20030924211055/https://www.wired.com/news/technology/0,1282,60473,00.html
#20yrsago Al Franken’s Supply-Side Jesus https://web.archive.org/web/20030923212204/https://buzzflash.com/contributors/03/09/17_franken.html
#20yrsago Kevin Werbach’s kick-ass spectrum paper https://werbach.com/research/supercommons.pdf
#15yrsago RIAA wants to fine lawyer who defends file-sharers for blogging about it https://www.wired.com/2008/09/riaa-decries-at/
#15yrsago Infographic shows Wall Street’s losses https://archive.nytimes.com/www.nytimes.com/interactive/2008/09/15/business/20080916-treemap-graphic.html
#15yrsago How SEC rule-exemptions led to the Wall St collapse https://bigpicture.typepad.com/comments/2008/09/regulatory-exem.html
#10yrsago Expanded “Welcome to Bordertown” audiobook, with @neil-gaiman, Steven Brust, Ellen Kushner and more https://web.archive.org/web/20140620215953/https://www.bordertownseries.com/audio.html
#15yrsago Testimony of Troy Davis, on death row in Georgia https://web.archive.org/web/20080919061107/http://www.protectthehuman.com/videos/hear-troy-davis
#10yrsago Script for the Gong Show movie https://web.archive.org/web/20131125112945/http://www.bloodyrarebooks.com/pages/books/5987/sr-chuck-barris-robery-downey/the-gong-show-movie-original-screenplay
#10yrsago Ten notes on communication from John Scalzi https://whatever.scalzi.com/2013/09/16/speech-conversation-debate-engagement-communication/
#10yrsago Rasl: dark comic from Bone creator Jeff Smith https://memex.craphound.com/2013/09/17/rasl-dark-comic-from-bone-creator-jeff-smith/
#5yrsago Photos: Hong Kong Disneyland in the aftermath of Super Typhoon Mangkhut https://disneyandmore.blogspot.com/2018/09/photos-hong-kong-disneyland-devastated.html
#5yrsago Ajit Pai: California net neutrality law is “illegal” https://arstechnica.com/tech-policy/2018/09/ajit-pai-calls-californias-net-neutrality-rules-illegal/
#5yrsago North Carolina Verizon customers, trapped by Hurricane Florence, say they’re being throttled and upsold https://www.reddit.com/r/LateStageCapitalism/comments/9glj90/big_shout_out_to_verizon_for_throttling_data_for/
#5yrsago Anatomy of a Reddit cryptocurrency spam-factory https://www.vice.com/en/article/438v7j/inside-a-reddit-sockpuppet-operation-spam-upvote-shadowbanned
#5yrsago Georgia Republican introduces legislation to kill PACER, the outrageous paywall around the US justice system https://arstechnica.com/tech-policy/2018/09/new-bill-would-finally-tear-down-federal-judiciarys-ridiculous-paywall/
#5yrsago Birtherism for everyone: Kansas woman told birth certificate can’t be used for passport renewal https://web.archive.org/web/20180911045911/https://www.kctv5.com/news/kansas-woman-told-birth-certificate-wasn-t-enough-to-prove/article_144c19aa-b50f-11e8-94f5-6b921312a97a.html

5 notes
·
View notes
Text
Ready to take your Power BI skills to the next level? This intermediate-level Power BI tutorial goes beyond the basics and dives into advanced techniques for visualizing and analyzing data. You’ll learn how to *customize Stacked Column Charts, Funnel Charts, treemaps, and matrix tables; apply *DAX calculations; and optimize reports for *better interactivity and insights.
0 notes
Text
The Best Data Visualization Techniques and Tools for Strategic Decision-Making
In the age of big data and real-time analytics, the ability to extract insights and communicate them clearly is paramount. Data visualization has emerged as a mission-critical function for business leaders, analysts, and strategists across all industries. But with an abundance of tools, techniques, and design frameworks available, identifying the best data visualization practices is essential for effective decision-making.
This guide explores the most impactful data visualization methods, best-in-class tools, and professional standards to elevate your organization's data strategy in 2025 and beyond.
What is Data Visualization?
Data visualization is the graphical representation of information and data through visual elements such as charts, graphs, infographics, and interactive dashboards. It enables stakeholders to interpret complex datasets, discover trends, and make data-driven decisions with clarity and speed.
High-quality visualizations transform abstract numbers into actionable intelligence, aligning decision-makers across departments and accelerating strategic outcomes.
Why Data Visualization is a Strategic Priority
As organizations generate massive volumes of structured and unstructured data, traditional reporting methods fall short. The best data visualization practices offer significant advantages:
Clarity – Translate complex analytics into digestible visual narratives.
Speed – Enable faster comprehension of trends, anomalies, and correlations.
Alignment – Facilitate clear communication between technical teams and executives.
Actionability – Highlight areas for improvement, opportunity, or intervention.
Engagement – Elevate stakeholder interest and retention through compelling visuals.
In an increasingly competitive landscape, companies that leverage data visualization effectively gain a measurable edge in agility and innovation.
Top Data Visualization Techniques for Business Intelligence
Professionals must select the appropriate visualization type based on the context, audience, and objective of the data. Below are some of the most effective and widely applied methods:
1. Bar and Column Charts
Ideal for comparing discrete categories or values. They are simple, versatile, and suitable for most business dashboards.
2. Line Graphs
Best for tracking changes over time. Common in financial reporting, forecasting, and operational monitoring.
3. Heatmaps
Used for identifying patterns or intensity within data sets. Often deployed in website analytics, correlation matrices, and customer behavior analysis.
4. Scatter Plots
Illustrate relationships and correlations between two variables. Useful in market research, statistical modeling, and quality control.
5. Geographic Maps
Essential for location-based data. Businesses use these to analyze regional performance, logistics networks, or demographic distributions.
6. Treemaps and Sunburst Charts
Efficient in displaying hierarchical data within a compact space. Frequently used in portfolio breakdowns and organizational data.
7. Gantt Charts
Used for project planning and tracking. Visualize tasks, timelines, dependencies, and resource allocation.
8. Interactive Dashboards
Combine multiple visualizations into a single, dynamic interface for real-time monitoring and analysis. Often employed in executive reporting and enterprise-wide KPIs.
Best Data Visualization Tools in 2025
Selecting the right tool is just as important as choosing the right chart. Here are the top-tier platforms professionals use to create powerful visualizations:
Tool
Key Strengths
Use Case Scenarios
Tableau
Enterprise-grade analytics, drag-and-drop UI
Corporate BI, executive dashboards
Microsoft Power BI
Seamless integration with Microsoft ecosystem
Internal reporting, financial data modeling
Looker (Google Cloud)
Embedded analytics, real-time metrics
Cloud-native dashboards, SaaS products
D3.js
Fully customizable via JavaScript
Advanced, interactive, web-based visualizations
Qlik Sense
Associative data model for self-service BI
Departmental analytics, ad hoc exploration
Plotly / Dash
Python-based, high-quality visuals
Scientific research, custom applications
Google Data Studio
Free and easy to use for Google users
Marketing and digital analytics
Infogram
Fast, design-driven infographics
Content marketing, reports, presentations
Best Practices for Professional Data Visualization
Even with the best tools, poor execution can undermine the message. Apply these professional best practices for optimal impact:
✅ Design for the Audience
Tailor visualizations to the data literacy level and expectations of the target audience—executives, analysts, or customers.
✅ Prioritize Clarity Over Aesthetics
Avoid unnecessary embellishments. Every design element should serve a purpose and support data interpretation.
✅ Select the Right Chart for the Right Story
Match the chart type to the analytical question: comparison, composition, distribution, or relationship.
✅ Maintain Data Integrity
Ensure that all visualizations are statistically accurate and contextually honest. Misleading scales or incomplete data can erode trust.
✅ Tell a Story with the Data
Use titles, annotations, and progressive layout to guide the viewer toward the insight—not just the image.
✅ Use Color Intelligently
Colors should highlight key insights, not distract. Stick to accessible palettes and maintain consistency across dashboards.
Industry Applications: Real-World Use Cases
📈 Financial Services
Risk analysis, portfolio monitoring, and regulatory reporting with real-time dashboards and trend visualizations.
🏥 Healthcare
Visualizing patient outcomes, clinical trials, and resource allocation for enhanced operational decisions.
🛒 Retail & E-Commerce
Sales performance tracking, inventory optimization, and customer segmentation through dynamic charts and heatmaps.
🚀 Technology & SaaS
User behavior, product engagement, and A/B test results visualized to inform product and marketing strategies.
🌍 Supply Chain & Logistics
Route optimization, delivery efficiency, and supplier performance monitored through geospatial and temporal data.
Conclusion: Elevating Strategy Through the Best Data Visualization
In an environment where speed, clarity, and precision drive results, the best data visualization practices empower businesses to harness the full potential of their data. By combining the right techniques, tools, and storytelling strategies, organizations can transform raw data into a strategic asset.
0 notes
Text
📚 Comparing Java Collections: Which Data Structure Should You Use?
If you're diving into Core Java, one thing you'll definitely bump into is the Java Collections Framework. From storing a list of names to mapping users with IDs, collections are everywhere. But with all the options like List, Set, Map, and Queue—how do you know which one to pick? 🤯
Don’t worry, I’ve got you covered. Let’s break it down in simple terms, so you can make smart choices for your next Java project.
🔍 What Are Java Collections, Anyway?
The Java Collection Framework is like a big toolbox. Each tool (or data structure) helps you organize and manage your data in a specific way.
Here's the quick lowdown:
List – Ordered, allows duplicates
Set – Unordered, no duplicates
Map – Key-value pairs, keys are unique
Queue – First-In-First-Out (FIFO), or by priority
📌 When to Use What? Let’s Compare!
📝 List – Perfect for Ordered Data
Wanna keep things in order and allow duplicates? Go with a List.
Popular Types:
ArrayList – Fast for reading, not so much for deleting/inserting
LinkedList – Good for frequent insert/delete
Vector – Thread-safe but kinda slow
Stack – Classic LIFO (Last In, First Out)
Use it when:
You want to access elements by index
Duplicates are allowed
Order matters
Code Snippet:
java

🚫 Set – When You Want Only Unique Stuff
No duplicates allowed here! A Set is your go-to when you want clean, unique data.
Popular Types:
HashSet – Super fast, no order
LinkedHashSet – Keeps order
TreeSet – Sorted, but a bit slower
Use it when:
You care about uniqueness
You don’t mind the order (unless using LinkedHashSet)
You want to avoid duplication issues
Code Snippet:
java

🧭 Map – Key-Value Power Couple
Think of a Map like a dictionary. You look up values by their unique keys.
Popular Types:
HashMap – Fastest, not ordered
LinkedHashMap – Keeps insertion order
TreeMap – Sorted keys
ConcurrentHashMap – Thread-safe (great for multi-threaded apps)
Use it when:
You need to pair keys with values
You want fast data retrieval by key
Each key should be unique
Code Snippet:
java

⏳ Queue – For First-Come-First-Serve Vibes
Need to process tasks or requests in order? Use a Queue. It follows FIFO, unless you're working with priorities.
Popular Types:
LinkedList (as Queue) – Classic FIFO
PriorityQueue – Sorted based on priority
ArrayDeque – No capacity limit, faster than LinkedList
ConcurrentLinkedQueue – Thread-safe version
Use it when:
You’re dealing with task scheduling
You want elements processed in the order they come
You need to simulate real-life queues (like print jobs or tasks)
Code Snippet:
java

🧠 Cheat Sheet: Pick Your Collection Wisely

⚙️ Performance Talk: Behind the Scenes

💡 Real-Life Use Cases
Use ArrayList for menu options or dynamic lists.
Use HashSet for email lists to avoid duplicates.
Use HashMap for storing user profiles with IDs.
Use Queue for task managers or background jobs.
🚀 Final Thoughts: Choose Smart, Code Smarter
When you're working with Java Collections, there’s no one-size-fits-all. Pick your structure based on:
What kind of data you’re working with
Whether duplicates or order matter
Performance needs
The better you match the collection to your use case, the cleaner and faster your code will be. Simple as that. 💥
Got questions? Or maybe a favorite Java collection of your own? Drop a comment or reblog and let’s chat! ☕💻
If you'd like me to write a follow-up on concurrent collections, sorting algorithms, or Java 21 updates, just say the word!
✌️ Keep coding, keep learning! For More Info : Core Java Training in KPHB For UpComing Batches : https://linktr.ee/NIT_Training
#Java#CoreJava#JavaProgramming#JavaCollections#DataStructures#CodingTips#DeveloperLife#LearnJava#ProgrammingBlog#TechBlog#SoftwareEngineering#JavaTutorial#CodeNewbie#JavaList#JavaSet#JavaMap#JavaQueue#CleanCode#ObjectOrientedProgramming#BackendDevelopment#ProgrammingBasics
0 notes
Text

Small multiple treemaps showing "for the United States and for each state, with distinction of sex, the ratio between the total population over 10 years of age and the number of persons reported as engaged in each principal class of gainful occupations and also as attending school, compiled from the returns of population at the Ninth Census 1870." From Statistical Atlas Of The United States based on the results of the Ninth Census 1870, as reproduced in Fraser's Federal Reserve Archive.
Francis A. Walker
0 notes
Text
Comparing Treemaps and Mekko Charts: Choosing the Right Visualization for Your Data
Data Visualization: Frequently Asked Inquiries Explained
1.What is a Mekko chart format?
A Mekko chart, also known as a Marimekko chart, is a visual representation that displays categorical data with varying widths and heights. It combines features of a bar chart and a stacked column chart, allowing for the comparison of different categories and subcategories in terms of size and proportion. This format effectively illustrates market share, revenue, or other metrics.
2. How to make mekko chart in PPT?
To create a Mekko chart in PowerPoint, follow these steps:
1. Insert a blank slide.
2. Use the "Insert" tab, select "SmartArt," and choose a suitable layout.
3. Manually adjust the sizes of rectangles to represent data proportions.
4. Add text and labels to each section.
5. Customize colors and styles as needed for clarity and presentation.
3. What are the benefits of a Mekko chart?
A Mekko chart visually represents data across two dimensions, allowing for easy comparison of categories and subcategories. It effectively displays market share and growth potential, helping identify opportunities and trends. Its clear layout aids in decision-making and presentations, making complex data more accessible and understandable for stakeholders.
4. What is the difference between Tree map and Mekko chart?
A Tree map displays hierarchical data using nested rectangles, showing proportions through size and color. In contrast, a Mekko chart (or Marimekko chart) combines bar and area charts to represent categorical data with variable width bars and varying heights, illustrating both market share and category size. Essentially, Tree maps focus on hierarchy, while Mekko charts emphasize categorical comparisons.
5. How do you add a second Y axis in Mekko Graphics?
To add a second Y axis in Mekko Graphics, select your chart, go to the “Format” menu, and choose “Axes.” Then, enable the secondary Y axis option. You can customize its scale and labels as needed. This allows you to display two different data series with distinct Y axes for better comparison and analysis.

Visit: VS Website See: VS Portfolio
0 notes
Photo

Hispanic Heritage Hues: Treemap of color distribution of Latin American flags
by u/Metalytiq
14 notes
·
View notes
Text
I have posted an article for Chinese.
0 notes
Text
Data Analyst Course and Storytelling: Creating Impactful Dashboards and Charts Using Tools Like Tableau and Power BI
In the modern data-driven world, raw data is only as valuable as the insights derived from it. For businesses, conveying these insights in an impactful and comprehensible way is critical for decision-making. This is where the art of storytelling in data analysis comes into play. A dedicated module on data visualisation and storytelling in a Data Analyst Course in Nagpur equips professionals to create impactful dashboards and charts using industry-leading tools like Tableau and Power BI.
The Role of Storytelling in Data Analysis
Storytelling in data analysis involves transforming complex datasets into visually compelling narratives that resonate with stakeholders. It bridges the gap that creeps in between data insights and actionable business strategies. Key components of effective data storytelling include:
Clarity: Simplifying complex information for easy comprehension.
Context: Providing relevant background to make data meaningful.
Engagement: Using visuals to capture and hold attention.
Actionability: Delivering insights that lead to informed decisions.
Why Focus on Dashboards and Charts?
Dashboards and charts serve as the backbone of data storytelling. They provide an interactive and visual medium to:
Monitor key performance indicators (KPIs).
Track trends and patterns over time.
Highlight anomalies and areas requiring attention.
Support data-driven decision-making with clarity and precision.
Key Features of Tableau and Power BI
Tableau:
Renowned for its user-friendly interface and powerful visualisation capabilities.
Allows integration with multiple sources of data for comprehensive analysis.
Offers advanced features like drag-and-drop functionality, real-time data updates, and storytelling dashboards.
Supports interactive visualisations like heatmaps, treemaps, and scatter plots.
Power BI:
A robust Microsoft tool that integrates seamlessly with Office 365 and other Microsoft products.
Provides AI-driven insights and natural language querying.
Offers a wide range of visual templates and customisation options.
Ideal for creating enterprise-grade reports and dashboards.
Course Highlights: Mastering Visualisation Tools
A Data Analyst Course focusing on storytelling and visualisation covers the following key areas:
Data Preparation and Cleaning:
Importing, cleaning, and organising datasets for visualisation.
Handling large and disparate data sources.
Designing Dashboards:
Principles of effective dashboard design: layout, colour theory, and usability.
Building interactive and dynamic dashboards in Tableau and Power BI.
Charting Techniques:
Selecting the right chart type for the data and audience.
Creating advanced visualisations like histograms, box plots, and waterfall charts.
Storytelling Frameworks:
Structuring narratives around visualisations.
Using annotations, highlights, and sequences to guide the audience.
Real-World Projects:
Hands-on experience with industry-relevant datasets.
Creating end-to-end dashboards addressing business scenarios.
Benefits of Mastering Data Storytelling
Professionals trained in data storytelling with tools like Tableau and Power BI can:
Communicate insights effectively and efficiently to both technical and non-technical audiences.
Drive strategic decisions with data-backed narratives.
Enhance their employability in industries prioritising data-driven approaches.
Build visually engaging reports that foster collaboration and understanding.
Conclusion
A Data Analyst Course in Nagpur emphasising storytelling and visualisation is essential for anyone aiming to excel in today’s data-centric roles. By mastering tools like Tableau and Power BI, participants can create dashboards and charts that not only inform but inspire action. This skillset ensures that data analysis evolves from mere number crunching to impactful decision-making support.
0 notes