#tsuga canadensis
Photo


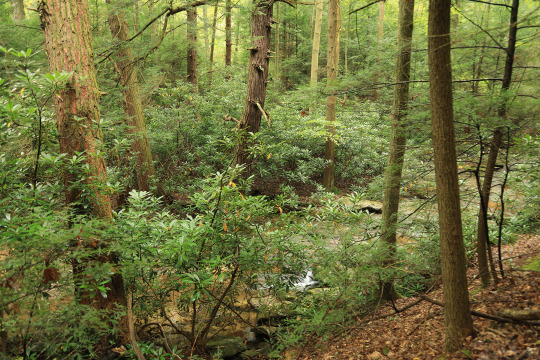
Those fragile, fleeting afternoons // Part 17
April 29th, 2022
390 notes
·
View notes
Text

Hemlock, Yellow Birch and Cinnamon Fern - October 1st 2023
#tsuga canadensis#betula lenta#nature#original phography#photographers on tumblr#lensblr#autumn#the poconos#Pennsylvania#forest
69 notes
·
View notes
Text

Blake exploring the old waterworks at Tibbs Run Preserve near Morgantown.
#appalachia#vandalia#west virginia#early summer#tibbs run preserve#ruins#human history#natural history#old growth forest#eastern hemlock#tsuga canadensis
55 notes
·
View notes
Photo
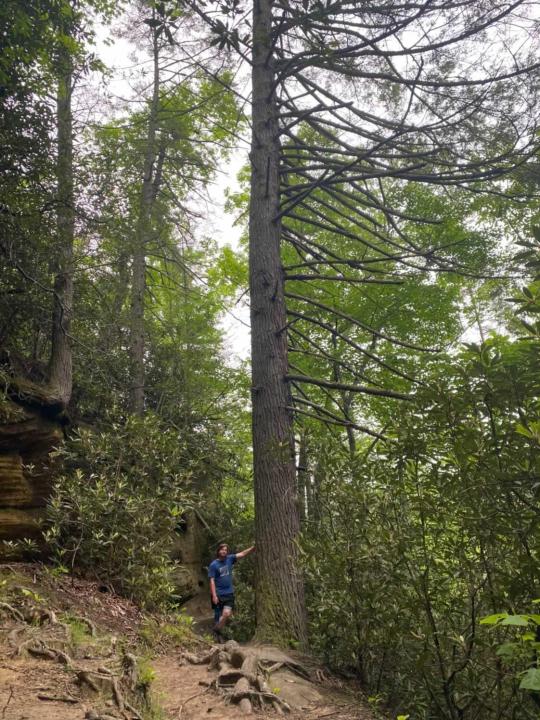
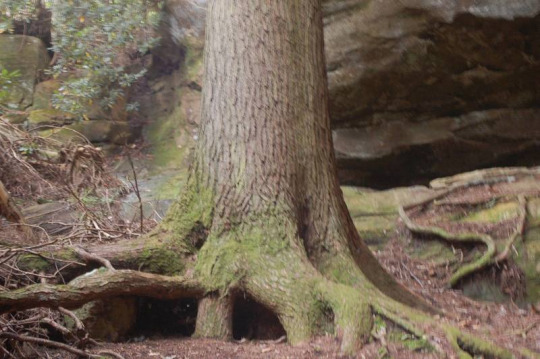
Most of the older remaining eastern hemlock in RRG are roughly 45 dbh -40 dbh, the two largest individuals i’ve seen are in muir valley labelled as the local Methuselah(mangled old behemoth) tree around 60 dbh, and one ive found 55 dbh in devils canyon. This and many other moderate examples can be seen throughout rough trail. Sadly, hwa and hes are major threats that are very real and don’t seem to have a real proactive method of management associated with them just yet.
Tsuga canadensis
15 notes
·
View notes
Video

flickr
P5170131 by Piyushgiri Revagar
Via Flickr:
Canadian hemlock (Tsuga canadensis)
#tree#nature#green#plant#tsuga canadensis#coniferous#conifer#hemlock#summer#branch#foliage#tsuga#background#leaves#eastern hemlock#park#evergreen#canadian hemlock#outdoor#garden#natural#decorative#wood#canadian#eastern hemlock-spruce#landscape#ornamental#cone#needles#forest
1 note
·
View note
Photo

Traditional Landscape - Landscape
#Inspiration for a large traditional full sun courtyard gravel driveway. cobble#garden maintenance#gravel#tsuga canadensis#reclaimed granite#granite#chip seal
0 notes
Text
One reason why it is important to include the scientific name when discussing plants:
Hemlock (Conium maculatum) - Highly toxic, invssive weed in North America
Hemlock (Tsuga canadensis) - tree, not poisonous, has many uses
21 notes
·
View notes
Photo


Hemlock forests (Tsuga canadensis)
27 notes
·
View notes
Audio
(via Ciona Rouse: "Red-Shouldered Hawk")
We met in the middle of the street only to discuss
the Buteo lineatus, but we simply said hawk
because we knew nothing of Latin. We knew nothing
of red in the shoulder, of true hawks versus buzzards,
or what time they started their mornings,
what type of snake they stooped low
and swift to eat. We knew nothing.
Or, I should say, at least I knew nothing,
and he said nothing of what he knew that day
except one thing he said he thought, but now I say
he knew: I’m going to die soon, my neighbor said to me
and assured he had no diagnosis, just a thought. He said it
just two weeks before he died outdoors just
twenty steps away from where we stood that day—
he and I between the porch I returned to and twisted
the key to my door to cross the threshold into my familiar
like always I do and the garage he returned to
and twisted some wrench probably on a knob of the
El Camino like always he did every day when usually
I’d wave briefly en route from carport to door
sometimes saying “how’s it going,” expecting
only the “fine” I had time to digest. Except today
when I stepped out of my car, he waved me over to see
what I now know to call the Buteo. When first I read its
Latin name, I pronounced it boo-TAY-oh
before learning it’s more like saying beauty (oh!).
I can’t believe I booed when it’s always carrying awe.
Like on this day, the buzzard—red-shouldered and
usually nesting in the white pine—cast a shadow
upon my lawn just as I parked, and stared back at us—
my mesmerized neighbor and me—perched, probably hunting,
in the leaning eastern hemlock in my yard. Though
back then I think I only called it a tree because I knew nothing
about distinguishing evergreens because I don’t think I ever asked
or wondered or searched yet. I knew nothing about how they thrive
in the understory. Their cones, tiny. And when they think
they’re dying, they make more cones than ever before. How did he
know? Who did he ask and what did he search to find
the date that he might die, and how did he know
to say soon to me and only me and then, right there
in that garage with his wrench and the some other parts
unknown for the El Camino and the radio loud as always
it was, stoop down, his pledge hand anxious against his chest,
and never rise again? And now the hemlock, which also goes
by Tsuga canadensis, which is part Latin, part Japanese,
still leans, still looks like it might fall any day now, weighed
down by its ever-increasing tiny fists. And the Buteo returns
each winter to reclaim the white pine before spring.
Most hawks die by accident—collision, predation, disease.
But when it survives long enough to know it’s dying, it may
find a familiar tree and let its breath weaken in a dark cranny.
And my neighbor’s wife and I now meet in the middle,
sometimes even discussing birds but never discussing
that day. And I brought her roses on that first anniversary
without him because we sometimes discuss a little more
than birds. And the Buteo often soar in twos, sometimes solo.
So high I cannot see their shoulders, but I know their voices
now and can name them even when I don’t see them. No matter
how high they fly, they see me, though I don’t concern them.
They watch a cottonmouth, slender and sliding
silent in tall grass. And the cardinals don’t sing.
They don’t go mute, either. They tink.
Close to their nests and in their favorite trees, they know
when the hawk looms. And their voices turn
metallic: tink, tink, tink.
Copyright © 2024 by Ciona Rouse. Originally published in Poem-a-Day on March 28, 2024, by the Academy of American Poets.
#Ciona Rouse#Red-Shouldered Hawk#Poets.org#poetry#good company#birds#spring#hawks#grief#death#neighbour#bird
0 notes
Photo


Those fragile, fleeting afternoons // Part 10
April 29th, 2022
302 notes
·
View notes
Text
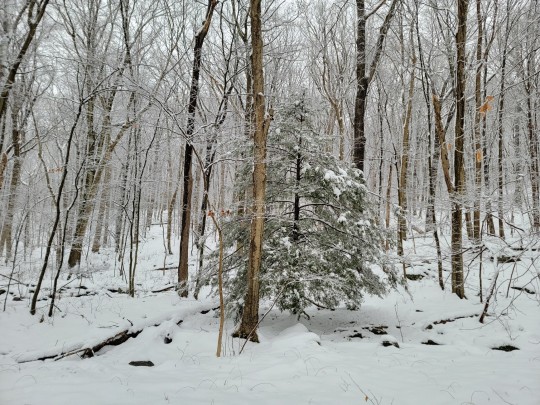
Lone Eastern Hemlock in a Forest Swamp - January 7th 2023
#tsuga canadensis#love these trees#photographers on tumblr#nature#original phography#forest#new jersey#njlocal#winter#snow#yellow birch in front...i think thats betula alleghenensis? thats certainly spelled incorrectly
21 notes
·
View notes
Photo

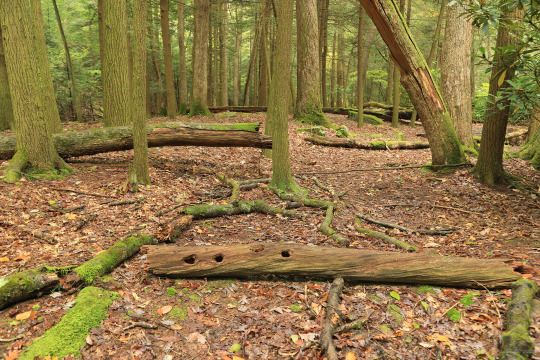
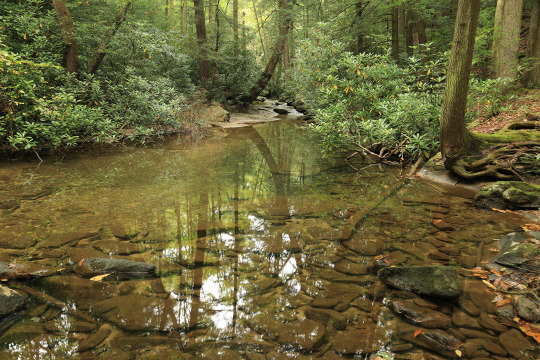
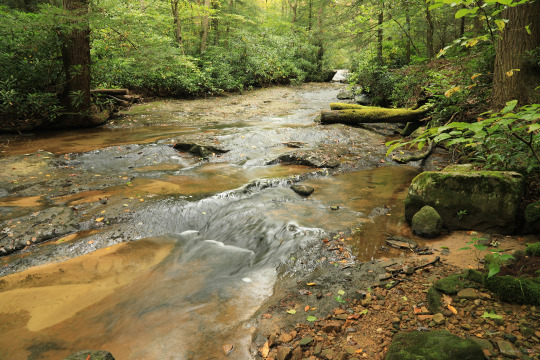
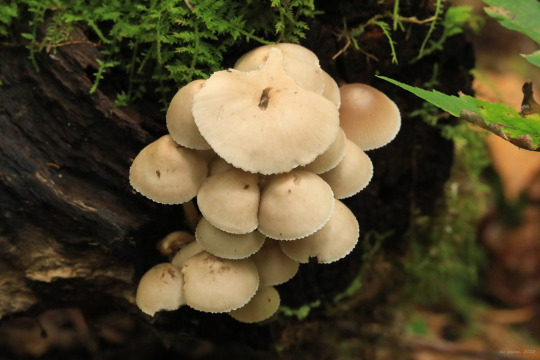

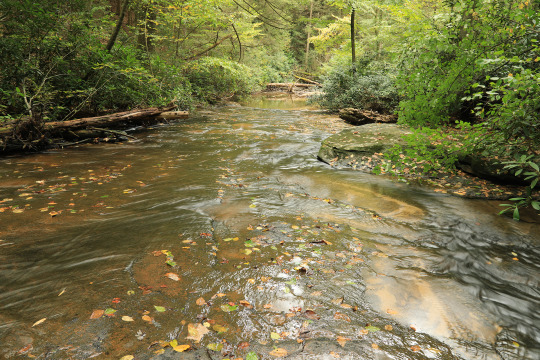
Walk with me: an early October stroll through the virgin hemlock forest along Little Laurel Run in Coopers Rock State Forest. The older I get the more I find myself drawn to animism. It’s so easy to walk in an old forest like this and imagine that everything in it - rocks, trees, moss - has been gifted with a sentient awareness. Not by some hateful, spiteful god, but by the grace of nature in her infinite wisdom.
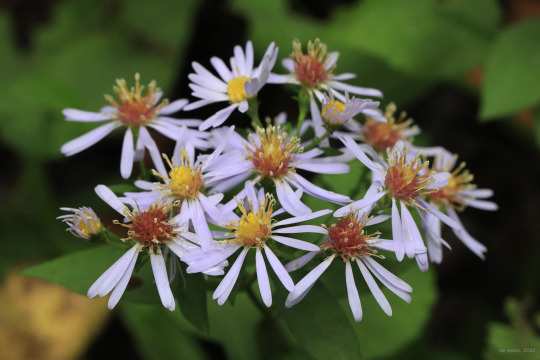
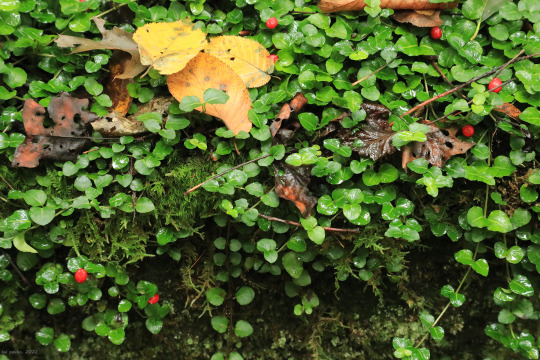
#appalachia#vandalia#west virginia#coopers rock state forest#little laurel run#virgin hemlock trail#virgin hemlock forest#tsuga canadensis#eastern hemlock#canadian hemlock#lophocampa caryae#hickory tussock moth#hickory tiger moth#eurybia macrophylla#big-leaved aster#bigleaf aster#large-leaved aster#mitchella repens#partridgeberry#partridge berry#autumn#fall#wildflowers#flora#berries#fungi
264 notes
·
View notes
Text
Notes from a plant nerd: Hope for the Hemlocks
In springtime, there is hope. I recently got the opportunity to walk in the woods and talk with Dr. McBug, a.k.a. Richard McDonald of Symbiont Biological Pest Management Co. whose research and work with the Hemlock trees (Tsuga canadensis and Tsuga caroliniana) and the tiny exotic invasive insect that has been decimating them up and down the east coast of the US, the hemlock wooly adelgid…
View On WordPress
0 notes
Text
Judith’s Garden Adapting to Challenges
Today we’re visiting with Judith.
After 25 years of living in my home in Pines Lake, a lake community in Wayne, New Jersey, my garden is still a work in progress with constant challenges.
I have a tiered property, and the upper woodland area area was once filled with hemlocks (Tsuga canadensis, Zones 3–7), but the woolly adelgid decimated this area. I now have the area covered in moss with…

View On WordPress
0 notes
Text
Annotated Bibliography
Adhikari, Pradeep & Lee, Yong Ho & Adhikari, Prabhat & Hong, Sun & Park, Yong-Soon. (2022). Climate change-induced invasion risk of ecosystem disturbing alien plant species: An evaluation using species distribution modeling. Frontiers in Ecology and Evolution. 10:880987.. 13. 10.3389/fevo.2022.880987.
Species distribution models have become an effective tool for monitoring invasive species. In South Korea, invasive species cause a loss of 22.6 billion Korean Won per year. Because of the extreme effect that invasives pose on the South Korean economy, scientists and land managers are motivated to monitor and manage this problem. Two statistical regression models were used along with three machine learning models. The two regression models used in this study were generalized linear model (GLM) and multivariate adaptive regression splines (MARS). The three machine learning models used in this study were artificial neural network (ANN), maximum entropy (MaxEnt), and random forest (RF). One of the two main objectives for this study was to determine the best algorithm and estimate the potential distribution area of 12 invasive species. Several variables were considered for this study including land cover change, distance from the road. distance from water and 19 bioclimatic variables. Through analysis of the various algorithms, it was determined that the random forest model had the highest predictive performance. The random forest model was determined to be the best model based on the average area under the curve (AUC), true skill statistics (TSS), and Kappa scores. The random forest model also determined that coastal areas of the northwestern and southern regions are at high risk for invasion of alien species. Some large cities of South Korea including Incheon, Seoul, and Busan are also at high risk for invasion. Climate change still poses a great threat to South Korea in regard to invasive species spread.
Bonneau, Laurent & Shields, Kathleen & Civco, Daniel. (1999). Using Satellite Images to Classify and Analyze the Health of Hemlock Forests Infested by the Hemlock Woolly Adelgid. Biological Invasions. 1. 10.1023/A:1010021629127.
The eastern hemlock (Tsuga canadensis) is a coniferous tree that can be found across the eastern United States. In southern New England, it can be found often in rocky ravines. This particular tree retains its lower branches, providing thermal cover for birds and small mammals during cold, winter months. T. canadensis has a unique ecological niche in that it provides structural habitat diversity for populations of small mammals and fish. This species is threatened by the hemlock woolly adelgid, which is an insect that was introduced from Asia. The hemlock woolly adelgid feeds on eastern hemlock by feeding on storage cells and can introduce toxins into the tree. Satellite imaging has made it possible to study insect infestations on forest lands. The main objectives of this study are to 1) evaluate a variety of image enhancement techniques to classify hemlock health and 2) to correlate hemlock stand health with landscape features. In the first phase of this study, the authors created a map to identify the location of hemlock in the study area, evaluate the health of hemlock stands through field surveys and compare image enhancing techniques to classify hemlock pixels based on health. In the second phase of this study, the authors examined the distribution of hemlock health and associated the following attributes: slope, aspect, basal area, canopy height and digital soils data. Through this study, the authors found that the MSAVI2 vegetation index produced the most accurate map regarding hemlock forest health. It was also found that hemlock forest health was positively correlated with deep, excessively drained, medium textured soils. The use of the techniques from this study could help further understand migration patterns of the Hemlock woolly adelgid.
Boyte, Stephen & Wylie, Bruce. (2016). Near-Real-Time Cheatgrass Percent Cover in the Northern Great Basin, USA, 2015. Rangelands. 38. 278-284. 10.1016/j.rala.2016.08.002.
Cheatgrass has become a great concern threatening sagebrush steppe ecosystems in the Great Basin. With the invasion of the annual grass, comes an increased fire frequency. With increased fire frequency comes altered ecosystems susceptible to higher rates of spread of invasive species. The invasive annual grass known as cheatgrass contributes to soil erosion on the landscape and destroys wildlife habitat, specifically for the now endangered species, the greater sage grouse. Greater sage grouse populations have declined an average 2% every year from 1965 to 2003. They have now been listed as an endangered species. Understanding the spread of invasive annual grasses, such as cheatgrass, can assist land managers, fire modelers and policy makers with addressing relevant issues such as decreased wildlife habitat and increased wildfire frequency. The authors used a two-step process to produce an estimation of percent cover and location of cheatgrass in the Northern Great Basin. A regression-tree software was used to develop parameters for an ecological model. Cheatgrass data from 2001 to 2006 was used to train the ecological model. Four datasets were added to the model, specifically expedited Moderate Resolution Imaging Spectroradiometer17 (eMODIS) normalized difference vegetation index (NDVI) data. The data collected from eMODIS and NDVI are available as a continuous weekly time series, which added a time-step feature to the cheatgrass model. The model allowed for the production of a cheatgrass cover dataset and maps from 2000 to 2013. The ecological model created was then applied to site specific variables from 2015. This was able to create the 2015 near-real-time cheatgrass cover estimate, which showed a slightly higher cover percentage of cheatgrass than the previous 14 year model. The authors determined that the increase in cover percentage was likely due to higher average annual precipitation. For the development and creation of future models, historical data is important and needed for accuracy.
Carrión-Klier C, Moity N, Sevilla C, Rueda D, Jäger H. The Importance of Very-High-Resolution Imagery to Map Invasive Plant Species: Evidence from Galapagos. Land. 2022; 11(11):2026. https://doi.org/10.3390/land11112026
Biodiversity on the Galapagos Islands is threatened by invasive plant species. Invasive species alter ecosystem functions and displace native and endemic species. Invasive species also have a huge impact on the economy, contributing to an estimated cost of 120 billion USD in the United States. In this study, the authors evaluated the effects spatial resolution has on accurately mapping invasive species on the Galapagos Islands. The guava tree (Psidium guajava), Cuban cedar (Cedrela odorata) and blackberry bush (Rubus niveus) are the invasive species of interest in the study. The study area is located on Santa Cruz Island, in the highlands of the Galapagos National Park. The authors in the study used very-high-resolution (VHR) WorldView-2 images to identify the invasive species of interest. Images from the hot and wet season in the Galapagos were used with <10% cloud cover. The vegetation is green and lush during the hot and wet seasons, making it easier to distinguish between species in the images. The authors used both VHR imagery and medium-resolution (MR) imagery and found that VHR imagery produced more accurate species distribution models. VHR imagery is a great resource for identifying and mapping invasive species.
Cho, Ki Hwan & Park, Jeong-Soo & Kim, Ji & Kwon, Yong & Lee, Do-Hun. (2022). Modeling the distribution of invasive species (Ambrosia spp.) using regression kriging and Maxent. Frontiers in Ecology and Evolution. 10. 10.3389/fevo.2022.1036816.
Biodiversity is threatened by the invasion of non-native species. Human activities can promote the spread of invasive species by unintentional seed dispersal. In this study, the authors use spatial and non-spatial models for distribution of Ambrosia artemisiifolia and Ambrosia trifida. A. artemisiifolia and A. trifida are two invasive plant species that are widely distributed throughout South Korea. These two species have difficulty dispersing long distances by wind due to their morphological characteristics Two modeling techniques used in this study were regression kriging (RK) and Maxent. Regression kriging is an interpolation method that takes into account spatial autocorrelation. The regression model allows for predictions to be made. Maxent is a machine learning-based species distribution model that was used the model the distributions of Ambrosia spp. Maxent uses presence-only data to model species distributions by evaluating habitat suitability. Habitat suitability is evaluated by comparing the probability density of background samples with the probability density of presence data. The habitat suitability index (HSI) estimated by Maxent indicated a high HSI for A. artemisiifolia in the northwestern part of the study area and a low HSI for A. trifida in the northwestern and eastern parts of the study area. The authors found that the RK model provides better predictive performance than Maxent. The RK model predicted lower occurrence probability of A. artemisiifolia because fewer individuals were identified in the study area. Maxent did not take into account the spatial context of the data used in the model and predicted a higher HSI. It was determined that invasive species distribution models are likely to produce more accurate model results with the use of spatial autocorrelation.
Henry, Annie & González, Eduardo & Robinson, W. & Sher, Anna. (2018). Spatial modeling improves understanding patterns of invasive species defoliation by a biocontrol herbivore. Biological Invasions. 20. 10.1007/s10530-018-1794-0.
In the American southwest, land managers and ecologists struggle with controlling the invasive tree Tamarix spp. Spatial modeling has become useful for understanding plant populations and their growth habits but has yet to understand the impacts of a biological control agent on invasive species. In this study, a biocontrol herbivore was introduced to aid in the containment of the invasive species Tamarix spp. Tamarix spp. was introduced to the U.S. in the early 19th century. This tree was primarily used as a bank stabilizer, an ornamental and a windbreak. River regulations and the changing of flood regimes assisted in the establishment of Tamarix spp. as a dominant species. This species severely affects ecosystems in that it changes the soil salinity of an ecosystem, increases fire frequency and alters river geomorphology. In this study, the authors quantified various environmental variables against spatial structure in determining defoliation patterns of Tamarix. The biocontrol agent used in this study was Diorhabda spp., which is a low cost and effective method for reducing Tamarix dominance. Diorhabda carinulata was released at 12 locations between 2004 and 2006. 79 field sites were established throughout Grand County, Utah to monitor defoliation in Tamarix after Northern tamarisk beetles were released. Monitoring occurred once per growing season between 2013 and 2016. Point intercept method was used to measure canopy cover. Permanent transects were established along the edge of Tamarix stands to record whether an individual was alive or dead. Geographic features, stand characteristics and soil characteristics were included in the dataset. Average live canopy of Tamarix varied from 42% to 59%. 2013 showed the highest average live canopy for Tamarix with a slight decrease the following years. It was determined that live canopy cover increases with the number of years since first defoliated and decreases with stand age. It was also found that most of the variability within the canopy was not related to environmental variables. This study will open new pathways for understanding biological control agents effects on invasive plant species.
Holcombe, Tracy & Stohlgren, Thomas & Jarnevich, Catherine. (2007). INVASIVE SPECIES MANAGEMENT AND RESEARCH USING GIS.
Geographic Information Systems (GIS) and Global Positioning Systems (GPS) are key tools for spatial analysis. Maps can be quickly and easily produced and spatial analysis becomes extremely easier. Many industries have been positively impacted through the development of GIS including health care, agriculture and the environmental industry. A large, ongoing problem within the environmental industry is the development of invasive species. Invasive species typically thrive in all types of environments, with little to no resources (ex. sunlight, water availability, etc). GIS is a very important, applicable tool in the environmental industry because it can create potential distribution maps for early detection and rapid assessment of invasive species. Using GIS applications, the authors analyzed the distribution patterns of the invasive species, Cane Toad, in the United States at the 6-digit Hydrologic Unit Code (HUC) level. The authors used data obtained from USGS Florida Integrated Science Center’s Non-Indigenous Aquatic Species database on the invasive cane toad. Using a logistic regression model, the authors determined potential habitat for the invasive cane toad within the US. Variables used in the logistic regression model included minimum temperature, minimum radiation, mean temperature, maximum temperature, maximum humidity, and maximum growing degree day. The results of this model showed that the cane toad population had already invaded the majority of suitable habitat (mostly within the state of Florida) from the model's prediction. The authors used another GIS application to estimate potential suitable habitat for the cane toad, which resulted in the cane toad not having much more suitable habitat than the areas it was already occupying within the state of Florida.
Joshi, Chudamani & De Leeuw, Jan & Van Duren, Iris. (2004). Remote sensing and GIS applications for mapping and spatial modeling of invasive species. ISPRS. 35.
Remote sensing (RS) and Geographic Information Systems (GIS) have become important tools for land management agencies. RS and GIS can produce habitat suitability models for early detection of invasive species. There are various systems used in remote sensing including aerial imagery, multispectral scanners, broad-band scanners and hyperspectral scanners. The authors in this article review remote sensing techniques and GIS used for mapping potential distribution patterns of invasive species. Since remote sensing is based on the use of satellite imagery, remote sensing data is strongly correlated to canopy cover. In this article, invasive species are categorized based on their canopy cover within an ecosystem. Canopy cover is broken down into four classes including class I: Canopy dominating species, class II: Mixed canopy dominant species, class III: Invaders influencing canopy dominant species and class IV: Understory species. Various studies have noted the significance of differences in canopy architecture, leaf pubescence and vegetative density for mapping invasive species using aerial photography. Using reflectance imagery for aquatic invasive species has been described as limiting, because little light is reflected off of submerged vegetation, resulting in inaccurate measurements. Other studies have found remote sensing reflectance imagery to be an effective and accurate tool for mapping invasives. It has also been found extremely challenging to map invasive plants and animals occupying the understory using any of the remote sensing techniques mentioned. There are still improvements to be made for accurately documenting invasive species distributions using remote sensing techniques.
Lee W-H, Song J-W, Yoon S-H, Jung J-M. Spatial Evaluation of Machine Learning-Based Species Distribution Models for Prediction of Invasive Ant Species Distribution. Applied Sciences. 2022; 12(20):10260. https://doi.org/10.3390/app122010260
Artificial intelligence has recently been used to advance the production of species distribution models (SDMs). Machine learning algorithms are utilized to determine environmental characteristics for potential habitats. MaxEnt is a type of model that utilizes the maximum entropy theory to assess the probability of species occurrence and distribution based on environmental factors. Random Forest (RF) is another popular tool used to identify suitable habitat for target species. Multi-layer perceptron (MLP) is a recent approach that classifies the presence or absence of a species. In this study, the authors use MaxEnt, RF and MLP to predict potential global species distribution for two species of ants, Solenopsis invicta and Anoplolepis gracilipes. Data points were gathered and used in the models, which included 6163 data points for S. invicta and 1297 data points for A. gracilipes. Climate data and bioclimatic variables were also used for predicting the distribution of the ant species. Model performance metrics were used to compare the 3 models. The authors found the MaxEnt model showed the highest performance while MLP showed low performance. Accuracy of each model for both species exceeded 0.9 except MLP accuracy for A. gracilipes. This could be correlated with less data points available for the models to be trained with in regards to A. gracilipes. The authors found that the amount of data correlates with the performance of the model. Ideally, more data availability will improve the performance of future species distribution models.
Masocha, Mhosisi & Skidmore, Andrew. (2022). INTEGRATING CONVENTIONAL CLASSIFIERS WITH A GIS EXPERT SYSTEM IMPROVES INVASIVE SPECIES MAPPING.
Biodiversity is threatened by the invasion of alien plants in an ecosystem. With the loss of biodiversity, comes the loss of ecosystem functions and environmental services. It has become an important task for natural resource managers to accurately map and understand potential areas that invasive species threaten. Remote sensing has become increasingly important for managing invasive species but has been found to be insufficient and inaccurate. Remote sensing is ideal for plants that occur in the canopy, but most smaller invasive plants occur below the canopy and are therefore undetected by remote sensing. Because field / ground-based surveys can be inefficient and time consuming, land managers need a more efficient approach to this large task of managing, treating and reducing populations of invasive species. The authors in this study hypothesized that using expert systems, such as computer programs using symbolic logic, combined with conventional image classification methods can increase the accuracy for mapping invasive species. The authors chose the invasive species L. camara for this study because it has a complex growth habit and is not easily detected from remote sensing. The study takes place in southern Zimbabwe. During December 2006, 187 plots were sampled and the presence / absence of L. camara was recorded as well as the number of stems and cover percentage in four cover classes. The four cover classes included in the study were absent (0% cover), low (1–30% cover), medium (31–50%) and high (>50% cover). Four methods were used to map the cover of L. camara including neural network, support vector machine, hybrid neural network plus expert system and hybrid support vector machine plus expert system. The accuracy of these methods were calculated using a dataset that was produced specifically for testing accuracy. This study found that the hybrid neural network plus expert system method achieved the highest accuracy for mapping invasives with an accuracy of 82.9%. This supports the hypothesis that combining a Geographic Information System (GIS) expert system with a single classifier would produce more accurate results.
Qiao X, Liu X, Wang F, Sun Z, Yang L, Pu X, Huang Y, Liu S, Qian W. A Method of Invasive Alien Plant Identification Based on Hyperspectral Images. Agronomy. 2022; 12(11):2825. https://doi.org/10.3390/agronomy12112825
Invasive species are a huge threat to ecosystems and biodiversity. Hyperspectral technology has become a resourceful tool for accurately detecting invasive species. An efficient and low-cost approach to managing invasive species is to accurately identify and monitor populations. However, field surveys can become time consuming and tedious. In this study, the authors attempt to identify invasive species based on hyperspectral imagery. In this study, the high-speed imaging spectrograph I185 was used to collect hyperspectral images of several invasive plant species in China. First derivative, Savitzky–Golay Smoothing and Standard Normal Variable Transformation were used as preprocessing methods to reduce noise, astigmatism and baseline drift within the hyperspectral data. Reducing the dimensionality of hyperspectral data also improves the efficiency and performance of the model. Principal Component Analysis and Ant Colony Optimization were utilized to reduce dimensionality. The Random Forest Model (RF) and Support Vector Machine (SVM) were utilized for the identification of seven invasive species. The authors found that M. micrantha had the highest reflectivity in the wavelength range followed by B. pilosa, M. pudica, L. cairica, A. conyzoides, S. calendulacea and L. camara. Overlapping regions between species was relatively large and the background reflectance was relatively scattered. The authors determined that attempting to classify seven different invasive species simultaneously is challenging and difficult. The preprocessing methods proved to reduce noise in the data but none of the processing methods significantly reduced noise. This study is helpful in understanding how hyperspectral imagery can be a useful tool for understanding invasive species distribution patterns but should not yet be utilized to identify multiple species simultaneously.
Randall, Joshua & Inglis, Nicole & Smart, Lindsey & Vukomanovic, Jelena. (2022). From Meadow to Map: Integrating Field Surveys and Interactive Visualizations for Invasive Species Management in a National Park. ISPRS International Journal of Geo-Information. 11. 525. 10.3390/ijgi11100525.
A widespread issue among many land management agencies is the invasion of non-native species that pose threats to their respective ecosystems. The National Park service is geared towards providing the public with recreational opportunities while protecting the National Parks natural resources. In this study, the authors working for Valley Forge National Historic Park (VAFO) co-developed a Geospatial Meadow Management Tool (GMMT) to assist in the development of a new method for efficiently collecting and analyzing invasive species distribution data. The GMMT aims to provide a quick and efficient way to analyze data while also providing a simple way to understand species distributions. The GMMT incorporated the use of Survey123 for field data collection, ArcGIS Pro for data analysis and ArcGIS Online for data visualization. The GMMT utilized three main applications including simplified layer management, ability to set filters for specific species and specific years and create line graphs responsive to the year and species selected. Using the GMMT, the Valley Forge National Historic Park was able to analyze and display complex spatial and temporal species cover data and eliminate time consuming data entry.
Tarbox, Bryan & Schmidt, Nathan & Shyvers, Jessica & Saher, D. & Heinrichs, Julie & Aldridge, Cameron. (2022). Bridging the Gap Between Spatial Modeling and Management of Invasive Annual Grasses in the Imperiled Sagebrush Biome. Rangeland Ecology & Management. 82. 10.1016/j.rama.2022.01.006.
Throughout the Western US, native plant communities (specifically the sagebrush-steppe) are quickly being altered by the spread of invasive annual grass species including cheatgrass, medusahead and ventenata. Land management agencies use spatial data to analyze the distribution and abundance of invasive annual grasses to make management decisions. Early detection of invasive annual grasses is key for successful eradication. The authors of this study collaborated with a multipartner stakeholder group to address the needs for advancement of spatial product development to address this issue. The goals for this project were 1) conduct a review of spatial products used for management of invasive annual grasses (IAG) including cheatgrass, medusahead and ventenata, 2) determine barriers of the spatial products and 3) provide recommendations and resources for the development of higher quality spatial products. The stakeholder group tested 23 spatial products with a variety of uses for displaying and interpreting data. Some of the uses included in these spatial products vary from generating maps of percent cover to determining habitat suitability. The stakeholder group found that spatial products improved over time with regards to temporal and spatial resolution. This is important because higher spatial resolution can allow for early detection of invasions of invasive annual grasses. It was also determined that in order to achieve the production of higher quality spatial products, product users would need to assist in product development by providing data from regions where models struggle to assess invasive annual grasses.
Uden, Daniel & Allen, Craig & Angeler, David & Corral, Lucia & Fricke, Kent. (2015). Adaptive invasive species distribution models: A framework for modeling incipient invasions. Biological Invasions. Online. 10.1007/s10530-015-0914-3.
Species distribution models (SDMs) are relatively accurate for modeling non-invasive species. However, using SDMs to model invasive species distribution patterns is still relatively inaccurate. In this study, the authors develop a framework for adaptive, niche-based, invasive species distribution model (iSDM) development by reviewing species distribution models, biological invasions and adaptive practices in ecological management. In the 10-step framework, designed by the authors, the hope is that the iSDM development will allow for further improvements in invasive species modeling. The 10 step framework consists of (1) invasion characterization; (2) objectives statement; (3) assumption and uncertainty articulation; (4) scale recognition and assignment; (5) predictor variable selection; (6) modeling technique adoption; (7) autocorrelation supervision; (8) prediction, validation and mapping; (9) management and monitoring; and (10) refinement. Through analysis of these 10 categories, the authors have found that the 10-step iSDM framework recognizes changes in invasive drivers, combines correlative and mechanistic modeling techniques and creates the opportunity for improvement in models and management of invasives.
West, Amanda & Evangelista, Paul & Jarnevich, Catherine & Schulte, Darin. (2018). A tale of two wildfires; testing detection and prediction of invasive species distributions using models fit with topographic and spectral indices. Landscape Ecology. 33. 10.1007/s10980-018-0644-x.
Species distribution models (SDMs) are ideal tools for understanding the potential areas that invasive species will overtake. SDMs can model potential habitat suitability for invasive species across a landscape. SDMs take into account many variables including climatic conditions. Typically, these models determine the presence or absence of a species in a particular area. SDMs are useful for distinguishing native species from invasive species. Wildfire plays an important role in the spread of invasive species, since invasive species tend to thrive on disturbance. The western United States is threatened by increased wildfire frequency due to the invasion of Bromus tectorum (cheatgrass) on the landscape. B. tectorum is a highly invasive annual grass species that has changed the fire regime from 60-500 years down to 3-5 years. In this study, the authors identify post-burn sites in the Medicine Bow National Forest in Wyoming, USA. The two burn sites used in the study were from the Squirrel Creek fire and the Arapaho fire. Field surveys were conducted for the presence of cheatgrass in both burn sites. Circular plots were sampled and percent cover was recorded for cheatgrass, forbs, grasses, shrubs, rock and bare ground. Cheatgrass was determined present in a plot if the cover percent was greater than 40%. Plots with less than 40% cover of cheatgrass were considered absent sites. Data used to fit the models included 56 plots sampled with 10 cheatgrass presences for the Squirrel Creek fire and 148 plots sampled with 32 cheatgrass absences for the Arapaho fire. Four species distribution models were used for both the Squirrel Creek fire and the Arapaho fire. From the four SDMs, it was determined that Random Forest (RF) and Generalized Linear Model (GLM) algorithms were sufficient in predicting cheatgrass habitat.
0 notes
Text
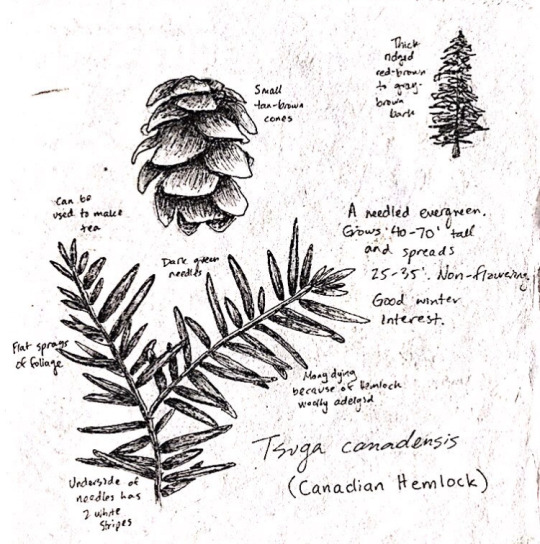
tsuga canadensis
#my art#botanical illustration#pen#black and white#horticulture#botany#scientific illustration#plants#flowers#gardening#field guide#tsuga canadensis#canadian hemlock
43 notes
·
View notes
Last Seen Blogs